San Jose–San Francisco–Oakland, CA Combined Statistical Area
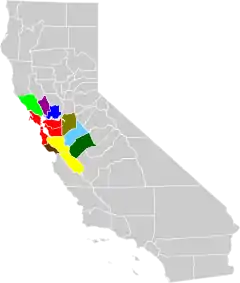
The San Jose–San Francisco–Oakland, CA Combined Statistical Area is a 14-county Combined Statistical Area (CSA) designated by the United States Office of Management and Budget in Northern California that includes the San Francisco Bay Area.[1] The CSA is more extensive than the popular local definition of the Bay Area, which consists of only the nine counties bordering San Francisco and San Pablo Bays: Alameda, Contra Costa, Marin, Napa, San Francisco, San Mateo, Santa Clara, Solano, and Sonoma.[2] This group of counties also elects boards for regional planning and air quality control regulation.[3][4] The CSA includes Merced, San Joaquin, Santa Cruz, San Benito, and Stanislaus counties, which do not directly border the San Francisco or San Pablo bays, but are economically connected to the other nine counties that do. Merced and Stanislaus Counties were added to the CSA in September 2018.[5][6]
The CSA ranks as the fifth most populous combined statistical area of the United States, and second in California.[7]
Geography
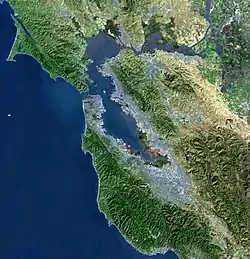
The CSA includes the vast geographic diversity of the traditional nine-county region, composed of at least six terranes (continental, seabed, or island arc fragments with distinct characteristics) pushed together over many millions of years by the forces of plate tectonics. These landscapes range from cool foggy mountains and temperate forests on the San Francisco Peninsula and Marin County, to the semi-arid, near-desert terrain in the easternmost portions of the East Bay.
San Joaquin, Merced, and Stanislaus Counties extend the CSA further east into the agricultural lands of the San Joaquin Valley, the southern half of the larger California Central Valley. San Joaquin County includes portions of the Sacramento–San Joaquin River Delta, formed by the confluence of the Sacramento and San Joaquin rivers before they eventually flow west into the Bay Area. Several cities and communities like Tracy and Mountain House in San Joaquin County, Patterson in Stanislaus County, and Los Banos in Merced County have become exurbs of the Bay Area because of population growth.
Santa Cruz and San Benito counties extend the CSA to the south of the traditional nine-county region, into the northernmost part of the California Central Coast. The City of Santa Cruz in Santa Cruz County and the Hollister region in San Benito County have also become exurbs for people working in Santa Clara County.
Census statistics
The CSA comprises nine Metropolitan Statistical Areas (MSAs). The United States Census Bureau estimates the population and gross domestic product (GDP) of the CSA and its seven component MSAs as of July 1, 2018 as follows:[8][9]
| Metropolitan Statistical Areas | County(ies) | 2018 Estimate | 2010 Census | Change | Area (land) | Density | 2018 GDP | 2018 GDP per capita |
|---|---|---|---|---|---|---|---|---|
| San Francisco–Oakland–Berkeley MSA | Alameda, Contra Costa, San Francisco, San Mateo, and Marin | 4,729,484 | 4,335,391 | +9.09% | 2,474 sq mi (6,410 km2) | 1,912/sq mi (738/km2) | $548.6B |
$115,999 |
| San Jose–Sunnyvale–Santa Clara MSA | Santa Clara and San Benito | 1,999,107 | 1,836,911 | +8.83% | 2,679 sq mi (6,940 km2) | 746/sq mi (288/km2) | $331.0B |
$165,584 |
| Stockton-Lodi MSA | San Joaquin County | 752,660 | 685,306 | +9.83% | 1,391 sq mi (3,600 km2) | 541/sq mi (209/km2) | $32.3B |
$42,952 |
| Modesto MSA (added September 2018) | Stanislaus County | 549,815 | 514,453 | +6.87% | 1,495 sq mi (3,870 km2) | 368/sq mi (142/km2) | $25.1B |
$45,713 |
| Santa Rosa-Petaluma MSA | Sonoma County | 499,942 | 483,878 | +3.32% | 1,576 sq mi (4,080 km2) | 317/sq mi (122/km2) | $32.0B |
$63,927 |
| Vallejo–Fairfield MSA | Solano County | 446,610 | 413,344 | +8.05% | 822 sq mi (2,130 km2) | 543/sq mi (210/km2) | $26.4B |
$59,203 |
| Santa Cruz–Watsonville MSA | Santa Cruz County | 274,255 | 262,382 | +4.53% | 445 sq mi (1,150 km2) | 616/sq mi (238/km2) | $15.3B |
$55,825 |
| Merced MSA (added September 2018) | Merced County | 274,765 | 255,793 | +7.42% | 1,935 sq mi (5,010 km2) | 142/sq mi (55/km2) | $9.8B |
$35,665 |
| Napa MSA | Napa County | 139,417 | 136,484 | +2.15% | 748 sq mi (1,940 km2) | 186/sq mi (72/km2) | $11.3B |
$81,173 |
| San Jose-San Francisco-Oakland CSA | 9,666,055 | 8,923,942 | +8.32% | 13,621 sq mi (35,280 km2) | 710/sq mi (274/km2) | $1,031.9B |
$106,757 |
|
Economy and transportation
In 2017 the San Jose–San Francisco–Oakland CSA had a GDP of $878 billion, which would rank 17th among countries and 5th among states.[9] Among Combined Statistical Areas, the Bay Area is 5th in terms of population, but 3rd in terms of GDP. Silicon Valley, the leading high technology region in the world, is located in Santa Clara County. Major corporations in San Francisco, San Jose, Oakland, and the surrounding cities help make the region second in the nation in concentration of Fortune 500 companies, after New York.[13] The Bay Area's northern counties encompass California's famous Wine Country, home to hundreds of vineyards and wineries. San Benito, Santa Cruz, San Joaquin, and Stanislaus counties extend the area's agriculture and wine-producing areas.
Transportation in the San Francisco Bay Area is reliant on a complex multimodal infrastructure consisting of roads, bridges, highways, rail, tunnels, airports, and bike and pedestrian paths. The Bay Area possesses an extensive freeway and highway system. The CSA contains the three principal north-south highways in California: Interstate 5, U.S. Route 101, and California State Route 1. U.S. 101 and State Route 1 directly serve the traditional nine-county region, while Interstate 5 bypasses to the east in San Joaquin County to provide a more direct Los Angeles-to-Sacramento route. Additionally, the region is also served by several passenger rail networks such as the Amtrak Capital Corridor , San Francisco Municipal Railway (MUNI), Bay Area Rapid Transit (BART), Caltrain, the Altamont Commuter Express, and the Santa Clara Valley Transportation Authority (VTA) Light Rail.
The area is also home to several ports, including the Port of Oakland, the fifth busiest container port in the United States,[14] and the Port of Stockton, a major inland deepwater port along the San Joaquin River. San Francisco International Airport (SFO) is the primary international airport of the region. Other airports with regular passenger service include Oakland International Airport (OAK) and San Jose International Airport (SJC), and to a lesser extent Sonoma County Airport (STS) and Stockton Metropolitan Airport (SCK).
See also
- List of metropolitan areas of the United States
- List of primary statistical areas of the United States
- List of Combined Statistical Areas
References
- "OMB Bulletin No. 13-01: Revised Delineations of Metropolitan Statistical Areas, Micropolitan Statistical Areas, and Combined Statistical Areas, and Guidance on Uses of the Delineations of These Areas" (PDF). United States Office of Management and Budget. February 28, 2013. Retrieved April 17, 2013.
- "San Francisco Bay Area Vision Project". Focus. Archived from the original on 2013-10-29.
- "The Association of Bay Area Governments". Association of Bay Area Governments.
- "BAAQMD: About the Air District". Baaqmd.gov. Retrieved 7 November 2017.
- Office of Management and Budget (2018-09-14). "OMB Bulletin 18-04" (PDF). Retrieved 2019-04-25.
- Office of Management and Budget (2018-04-10). "OMB Bulletin 18-03" (PDF). Retrieved 2019-04-25.
- "Metropolitan and Micropolitan Statistical Area Population Totals Tables: 2010-2016". 2016 Population Estimates. United States Census Bureau, Population Division. March 2017. Archived from the original on June 22, 2018. Retrieved April 19, 2017.
- Bureau, U.S. Census. "American FactFinder - Results". factfinder.census.gov. Archived from the original on 2020-02-13. Retrieved 2019-04-20.
- "Gross Domestic Product by Metropolitan Area, 2016" (Press release). Bureau of Economic Analysis. Retrieved 2017-12-08.
- "GCT-PH1 – Population, Housing Units, Area, and Density: 2010 – State — Place and (in selected states) County Subdivision". 2010 United States Census. United States Census Bureau. Archived from the original on February 12, 2020. Retrieved January 16, 2012.
- "Census 2010: Table 3A — Total Population by Race (Hispanic exclusive) and Hispanic or Latino: 2010". California Department of Finance. Archived from the original (Excel) on December 3, 2013. Retrieved January 16, 2012.
- "Corrections to 2010 Census Population and Housing Units Counts in the State of California" (PDF). California Department of Finance. Archived from the original (PDF) on May 16, 2013. Retrieved January 16, 2012.
- "Fortune 500 2010: Annual ranking of America's largest corporations from Fortune Magazine". Fortune. Retrieved August 11, 2010.
- "NORTH AMERICA CONTAINER TRAFFIC : 2011 PORT RANKING BY TEUs" (PDF). Aapa.files.cms-plus.com. Retrieved 7 November 2017.
| Bodies of water |
|  |
|---|---|---|
| Counties | ||
| Major cities | ||
| Cities and towns 100k–250k | ||
| Cities and towns 50k–99k | ||
| Cities and towns 25k–50k | ||
| Cities and towns 10k–25k |
| |
| Sub-regions | ||