Nickel Belt
Nickel Belt is one of two federal electoral districts serving the city of Greater Sudbury, Ontario, Canada. It has been represented in the House of Commons of Canada since 1953.
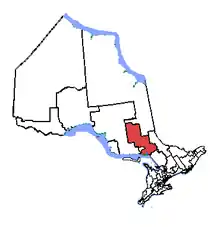 Nickel Belt in relation to other Ontario electoral districts | |||
| Federal electoral district | |||
| Legislature | House of Commons | ||
| MP |
Liberal | ||
| District created | 1952 | ||
| First contested | 1953 | ||
| Last contested | 2019 | ||
| District webpage | profile, map | ||
| Demographics | |||
| Population (2011)[1] | 90,962 | ||
| Electors (2015) | 72,134 | ||
| Area (km²)[2] | 30,490 | ||
| Pop. density (per km²) | 3 | ||
| Census division(s) | Greater Sudbury, Sudbury District plus small portions of Timiskaming, Manitoulin, Nipissing and Parry Sound | ||
| Census subdivision(s) | Biscotasing, Cartier, French River, Gogama, Greater Sudbury, Killarney, Markstay-Warren, St. Charles, West Nipissing, Whitefish Lake | ||
Geography
It consists of:
- the part of the Territorial District of Timiskaming lying west of the townships of Fallon and Cleaver;
- the Territorial District of Sudbury, excluding:
- the part lying west of and including the townships of Shenango, Lemoine, Carty, Pinogami, Biggs, Rollo, Swayze, Cunningham, Blamey, Shipley, Singapore, Burr and Edighoffer;
- the part lying south and west of a line and including the townships of Acheson, Venturi and Ermatinger and Totten, west of and excluding the City of Greater Sudbury, and west of and including the Township of Roosevelt;
- the northeast part of the City of Greater Sudbury;
- the Town of Killarney (in the territorial district of Manitoulin and Parry Sound);
- the unorganized territory lying on the north shore of Georgian Bay and east of the town of Killarney in the Territorial District of Manitoulin; and
- the Municipality of West Nipissing (in the Territorial District of Nipissing).
History
The riding of Nickel Belt was created in 1952 from parts of Algoma East, Algoma—Manitoulin, Nipissing, Parry Sound—Muskoka, Sudbury and Timiskaming—Cochrane ridings. It has traditionally included much of the Sudbury District and small parts of the Algoma, Nipissing and Timiskaming Districts, along with all but the urban core of Greater Sudbury.
It consisted initially of parts of the territorial districts of Sudbury and Algoma, and excluding the city of Sudbury, town of Copper Cliff, and the township of McKim. In 1966, it was redefined to consist of parts of the territorial districts of Sudbury excluding the City of Sudbury and the Town of Copper Cliff, and the northeast part of the territorial district of Manitoulin.
In 1976, it was redefined to consist of the southern part of Regional Municipality of Sudbury, the southeast part of the Territorial District of Sudbury, and the part of the Territorial District of Manitoulin including and lying east of the Townships of Killarney, and Rutherford and George Island.
In 1987, it was redefined to consist of the southern part of the Regional Municipality of Sudbury; the geographic townships of Cartier, Cascaden, Foy, Hart, Harty, Hess and Moncrieff and that part of the geographic Township of Trill not within the Town of Walden in the Territorial District of Sudbury; Wahnapitei Indian Reserve No. 11; and Whitefish Lake Indian Reserve No. 6.
In 1996, it was redefined to consist of:
- the part of the Territorial District of Timiskaming lying west of the eastern limit of the geographic townships of Douglas and Geikie;
- the Territorial District of Sudbury excluding:
- the part lying west of the eastern boundary of the townships of Shenango, Lemoine, Carty, Pinogami, Biggs, Rollo, Swayze, Cunningham, Blamey, Shipley, Singapore, Burr and Edighoffer;
- the part lying south and west of and including the townships of Acheson, Venturi, Ermatinger, Totten and west of but excluding the Regional Municipality of Sudbury, and west of but including the Townships of Foster and Curtin.
- the part lying east of a line and including the Townships of Stull, Valin, Cotton, Beresford and Creelman, east of and excluding the Regional Municipality of Sudbury and the Township of Hawley, east of and excluding the Townships of Hendrie and Hoskin, east of and excluding the Townships of Cosby, Mason and Martland;
- the part of Regional Municipality of Sudbury south of a line drawn from east to west along Highway 69, south along Long Lake Road, and west along the north boundary of the Township of Broder.
In 2003, it was given its current boundaries as described above.
This riding lost fractions of territory to Nipissing—Timiskaming and Algoma—Manitoulin—Kapuskasing during the 2012 electoral redistribution.
Members of Parliament
This riding has elected the following Members of Parliament:
| Parliament | Years | Member | Party | |
|---|---|---|---|---|
| Nickel Belt Riding created from Algoma East, Algoma—Manitoulin, Nipissing, Parry Sound—Muskoka, Sudbury and Timiskaming—Cochrane |
||||
| 22nd | 1953–1957 | Léo Gauthier | Liberal | |
| 23rd | 1957–1958 | |||
| 24th | 1958–1962 | Osias Godin | ||
| 25th | 1962–1963 | |||
| 26th | 1963–1965 | |||
| 27th | 1965–1968 | Norman Fawcett | New Democratic | |
| 28th | 1968–1972 | Gaetan Serré | Liberal | |
| 29th | 1972–1974 | John Rodriguez | New Democratic | |
| 30th | 1974–1979 | |||
| 31st | 1979–1980 | |||
| 32nd | 1980–1984 | Judy Erola | Liberal | |
| 33rd | 1984–1988 | John Rodriguez | New Democratic | |
| 34th | 1988–1993 | |||
| 35th | 1993–1997 | Raymond Bonin | Liberal | |
| 36th | 1997–2000 | |||
| 37th | 2000–2004 | |||
| 38th | 2004–2006 | |||
| 39th | 2006–2008 | |||
| 40th | 2008–2011 | Claude Gravelle | New Democratic | |
| 41st | 2011–2015 | |||
| 42nd | 2015–2019 | Marc Serré | Liberal | |
| 43rd | 2019–present | |||
Election results
| 2019 Canadian federal election | ||||||||
|---|---|---|---|---|---|---|---|---|
| Party | Candidate | Votes | % | ±% | Expenditures | |||
| Liberal | Marc Serré | 19,046 | 39.0 | -3.80 | $96,428.93 | |||
| New Democratic | Stéphane Paquette | 15,656 | 32.1 | -5.68 | $18,983.01 | |||
| Conservative | Aino Laamanen | 10,343 | 21.2 | +4.54 | $7,684.88 | |||
| Green | Casey Lalonde | 2,644 | 5.4 | +2.92 | none listed | |||
| People's | Mikko Paavola | 1,159 | 2.4 | – | none listed | |||
| Total valid votes/Expense limit | 48,848 | 100.0 | ||||||
| Total rejected ballots | 298 | |||||||
| Turnout | 49,146 | 64.7 | ||||||
| Eligible voters | 75,971 | |||||||
| Liberal hold | Swing | +0.94 | ||||||
| Source: Elections Canada[3][4] | ||||||||
| 2015 Canadian federal election | ||||||||
|---|---|---|---|---|---|---|---|---|
| Party | Candidate | Votes | % | ±% | Expenditures | |||
| Liberal | Marc Serré | 21,021 | 42.80 | +28.74 | $39,869.30 | |||
| New Democratic | Claude Gravelle | 18,556 | 37.78 | -17.20 | $94,855.24 | |||
| Conservative | Aino Laamanen | 8,221 | 16.74 | -11.29 | $14,060.79 | |||
| Green | Stuart McCall | 1,217 | 2.48 | -0.31 | $3,772.22 | |||
| Marxist–Leninist | Dave Starbuck | 98 | 0.20 | +0.07 | – | |||
| Total valid votes/Expense limit | 49,113 | 100.00 | $233,625.58 | |||||
| Total rejected ballots | 192 | 0.39 | – | |||||
| Turnout | 49,305 | 67.70 | – | |||||
| Eligible voters | 72,828 | |||||||
| Liberal gain from New Democratic | Swing | +22.97 | ||||||
| Source: Elections Canada[5][6] | ||||||||
| 2011 federal election redistributed results[7] | |||
|---|---|---|---|
| Party | Vote | % | |
| New Democratic | 24,276 | 54.99 | |
| Conservative | 12,373 | 28.03 | |
| Liberal | 6,210 | 14.07 | |
| Green | 1,231 | 2.79 | |
| Others | 59 | 0.13 | |
| 2011 Canadian federal election | ||||||||
|---|---|---|---|---|---|---|---|---|
| Party | Candidate | Votes | % | ±% | Expenditures | |||
| New Democratic | Claude Gravelle | 24,566 | 54.97 | +8.43 | – | |||
| Conservative | Lynne Reynolds | 12,503 | 27.98 | +6.28 | – | |||
| Liberal | Joe Cormier | 6,382 | 14.28 | -12.02 | – | |||
| Green | Christine Guillot | 1,252 | 2.80 | -2.23 | – | |||
| Marxist–Leninist | Steve Rutchinski | 59 | 0.13 | -0.03 | ||||
| Total valid votes/Expense limit | 44,688 | 100.00 | – | |||||
| Total rejected ballots | 171 | 0.38 | -0.09 | |||||
| Turnout | 44,859 | 62.60 | – | |||||
| Eligible voters | 71,659 | – | – | |||||
| 2008 Canadian federal election | ||||||||
|---|---|---|---|---|---|---|---|---|
| Party | Candidate | Votes | % | ±% | Expenditures | |||
| New Democratic | Claude Gravelle | 19,021 | 46.54 | +7.94 | $63,497 | |||
| Liberal | Louise Portelance | 10,748 | 26.30 | -16.90 | $61,589 | |||
| Conservative | Ian McCracken | 8,869 | 21.70 | +9.00 | ||||
| Green | Fred Twilley | 2,056 | 5.03 | +2.93 | $2,065 | |||
| Independent | Yves Villeneuve | 112 | 0.27 | – | – | |||
| Marxist–Leninist | Steve Rutchinski | 66 | 0.16 | +0.06 | ||||
| Total valid votes/Expense limit | 40,872 | 100.00 | $94,270 | |||||
| Total rejected ballots | 193 | 0.47 | ||||||
| Turnout | 41,065 | |||||||
| New Democratic Party gain from Liberal | Swing | +12.42 | ||||||
| 2006 Canadian federal election | ||||||||
|---|---|---|---|---|---|---|---|---|
| Party | Candidate | Votes | % | ±% | Expenditures | |||
| Liberal | Ray Bonin | 19,775 | 43.20 | +0.79 | $64,036 | |||
| New Democratic | Claude Gravelle | 17,668 | 38.60 | +4.10 | $75,188 | |||
| Conservative | Margaret Schwartzentruber | 5,822 | 12.70 | -6.12 | $10,196 | |||
| Progressive Canadian | Mathieu Péron | 1,044 | 2.30 | – | ||||
| Green | Mark McAllister | 975 | 2.10 | -0.44 | ||||
| Marijuana | Michel D. Ethier | 421 | 0.90 | -0.16 | ||||
| Marxist–Leninist | Steve Rutchinski | 42 | 0.10 | -0.03 | $68 | |||
| Total valid votes/Expense limit | 45,747 | 100.00 | $87,252 | |||||
| 2004 Canadian federal election | ||||||||
|---|---|---|---|---|---|---|---|---|
| Party | Candidate | Votes | % | ±% | Expenditures | |||
| Liberal | Ray Bonin | 17,188 | 42.41 | -13.16 | $44,339 | |||
| New Democratic | Claude Gravelle | 13,980 | 34.50 | +13.34 | $32,073 | |||
| Conservative | Mike Dupont | 7,628 | 18.82 | -4.45 | $59,250 | |||
| Green | Steve Lafleur | 1,031 | 2.54 | – | ||||
| Marijuana | Michel D. Ethier | 430 | 1.06 | – | ||||
| Independent | Don Lavallee | 217 | 0.54 | – | $2,875 | |||
| Marxist–Leninist | Steve Rutchinski | 51 | 0.13 | – | $435 | |||
| Total valid votes/Expense limit | 40,525 | 100.00 | $84,953 | |||||
Note: Conservative vote is compared to the total of the Canadian Alliance vote and Progressive Conservative vote in 2000 election.
| 2000 Canadian federal election | ||||||||
|---|---|---|---|---|---|---|---|---|
| Party | Candidate | Votes | % | ±% | Expenditures | |||
| Liberal | Ray Bonin | 19,187 | 55.57 | +6.72 | $42,569 | |||
| New Democratic | Sandy Bass | 7,304 | 21.16 | -12.32 | $61,722 | |||
| Alliance | Neil Martin | 6,369 | 18.45 | 6.49 | $13,072 | |||
| Progressive Conservative | Reg Couldridge | 1,665 | 4.82 | 0.40 | $2,739 | |||
| Total valid votes/Expense limit | 34,525 | 100.00 | $68,755 | |||||
Note: Canadian Alliance vote is compared to the Reform vote in 1997 election.
| 1997 Canadian federal election | ||||||||
|---|---|---|---|---|---|---|---|---|
| Party | Candidate | Votes | % | ±% | Expenditures | |||
| Liberal | Ray Bonin | 19,489 | 48.85 | -8.34 | $43,205 | |||
| New Democratic | Elie Martel | 13,355 | 33.48 | +10.37 | $62,794 | |||
| Reform | Neil Martin | 4,771 | 11.96 | -0.74 | $13,794 | |||
| Progressive Conservative | Reg Couldridge | 1,763 | 4.42 | -1.01 | $5,596 | |||
| Canadian Action | Don Scott | 369 | 0.92 | – | $1,181 | |||
| Natural Law | Mitchell Hibbs | 145 | 0.36 | -0.03 | ||||
| Total valid votes/Expense limit | 39,892 | 100.00 | $65,400 | |||||
| 1993 Canadian federal election | ||||||||
|---|---|---|---|---|---|---|---|---|
| Party | Candidate | Votes | % | ±% | Expenditures | |||
| Liberal | Ray Bonin | 25,237 | 57.19 | +33.62 | $42,807 | |||
| New Democratic Party | John Rodriguez | 10,197 | 23.11 | −21.62 | $52,551 | |||
| Reform | Janice Weitzel | 5,604 | 12.70 | $4,156 | ||||
| Progressive Conservative | Ian Munro | 2,395 | 5.43 | −15.32 | $4,808 | |||
| National | Brian Woods | 346 | 0.78 | $0 | ||||
| Natural Law | Daniel Jolicoeur | 173 | 0.39 | $533 | ||||
| Non-Affiliated | Ernie Ashick | 122 | 0.27 | $571 | ||||
| Abolitionist | Cindy Burton | 53 | 0.12 | $0 | ||||
| Total valid votes | 44,127 | 100.00 | ||||||
| Total rejected ballots | 329 | |||||||
| Turnout | 44,456 | 70.71 | −5.47 | |||||
| Electors on the lists | 62,869 | |||||||
| Source: Thirty-fifth General Election, 1993: Official Voting Results, Published by the Chief Electoral Officer of Canada. Financial figures taken from official contributions and expenses provided by Elections Canada. | ||||||||
| 1988 Canadian federal election | ||||||||
|---|---|---|---|---|---|---|---|---|
| Party | Candidate | Votes | % | ±% | Expenditures | |||
| New Democratic | John Rodriguez | 17,418 | 44.73 | +6.13 | $39,240 | |||
| Liberal | Pierre Legros | 9,178 | 23.57 | −5.98 | $36,271 | |||
| Progressive Conservative | Richard Berthiaume | 8,080 | 20.75 | −10.45 | $35,830 | |||
| Confederation of Regions | Billie Christiansen | 4,066 | 10.44 | $9,695 | ||||
| Rhinoceros | Keith Claven | 202 | 0.52 | −0.13 | $330 | |||
| Total valid votes | 38,944 | 100.00 | ||||||
| Total rejected ballots | 147 | |||||||
| Turnout | 39,091 | 76.18 | ||||||
| Electors on the lists | 51,312 | |||||||
| Note: Percentage change numbers are not factored for redistribution. | ||||||||
| 1984 Canadian federal election | ||||||||
|---|---|---|---|---|---|---|---|---|
| Party | Candidate | Votes | % | ±% | ||||
| New Democratic | John Rodriguez | 17,141 | 38.60 | −3.46 | ||||
| Progressive Conservative | Gord Slade | 13,857 | 31.20 | +21.00 | ||||
| Liberal | Judy Erola | 13,124 | 29.55 | −17.97 | ||||
| Rhinoceros | Derek Aardvark Orford | 288 | 0.65 | – | ||||
| Total valid votes | 44,410 | 100.00 | ||||||
| Total rejected ballots | 250 | 0.01 | ||||||
| Turnout | 44,660 | 79.55 | ||||||
| Electors on the lists | 56,139 | |||||||
| 1980 Canadian federal election | ||||||||
|---|---|---|---|---|---|---|---|---|
| Party | Candidate | Votes | % | ±% | ||||
| Liberal | Judy Erola | 19,805 | 47.52 | +8.97 | ||||
| New Democratic | John Rodriguez | 17,529 | 42.06 | −1.31 | ||||
| Progressive Conservative | Dennis Tappenden | 4,250 | 10.20 | −7.63 | ||||
| Marxist–Leninist | David Starbuck | 89 | 0.21 | −0.04 | ||||
| Total valid votes | 41,673 | 100.00 | ||||||
| Total rejected ballots | 119 | |||||||
| Turnout | 41,792 | 75.18 | −1.90 | |||||
| Electors on the lists | 55,587 | |||||||
| 1979 Canadian federal election | ||||||||
|---|---|---|---|---|---|---|---|---|
| Party | Candidate | Votes | % | ±% | ||||
| New Democratic | John Rodriguez | 17,772 | 43.37 | −6.41 | ||||
| Liberal | Judy Erola | 15,799 | 38.55 | +0.65 | ||||
| Progressive Conservative | Harwood Nesbitt | 7,308 | 17.83 | +5.51 | ||||
| Marxist–Leninist | David Starbuck | 103 | 0.25 | |||||
| Total valid votes | 40,982 | 100.00 | ||||||
| Total rejected ballots | 115 | |||||||
| Turnout | 41,097 | 77.08 | −0.28 | |||||
| Electors on the lists | 53,320 | |||||||
| Note: Percentage change numbers are not factored for redistribution. | ||||||||
| 1974 Canadian federal election | ||||||||
|---|---|---|---|---|---|---|---|---|
| Party | Candidate | Votes | % | ±% | ||||
| New Democratic | John Rodriguez | 17,668 | 49.78 | +3.75 | ||||
| Liberal | Gil Mayer | 13,451 | 37.90 | −1.79 | ||||
| Progressive Conservative | Ralph Connor | 4,371 | 12.32 | −0.20 | ||||
| Total valid votes | 35,490 | 100.00 | ||||||
| Total rejected ballots | 97 | |||||||
| Turnout | 35,587 | 77.36 | −1.65 | |||||
| Electors on the lists | 46,001 | |||||||
| 1972 Canadian federal election | ||||||||
|---|---|---|---|---|---|---|---|---|
| Party | Candidate | Votes | % | ±% | ||||
| New Democratic | John Rodriguez | 14,033 | 46.03 | +8.46 | ||||
| Liberal | Gaetan Serré | 12,101 | 39.69 | −5.41 | ||||
| Progressive Conservative | Bernie White | 3,817 | 12.52 | −4.81 | ||||
| Social Credit | Donat Breault | 534 | 1.75 | |||||
| Total valid votes | 30,485 | 100.00 | ||||||
| Total rejected ballots | 4,718 | |||||||
| Turnout | 35,203 | 79.01 | ||||||
| Electors on the lists | 44,556 | |||||||
| Note: The number of rejected ballots is not a misprint. Gaetan Serré initially called for these ballots to be reviewed, but withdrew his request on November 14, 1972 after viewing a sample. Source: "Review cancelled", Globe and Mail, 14 November 1972, 8. Source for results: Official Voting Results, Office of the Chief Electoral Officer (Canada), 1972. | ||||||||
| 1968 Canadian federal election | ||||||||
|---|---|---|---|---|---|---|---|---|
| Party | Candidate | Votes | % | ±% | ||||
| Liberal | Gaetan Serré | 11,551 | 45.10 | +5.64 | ||||
| New Democratic | Norman Fawcett | 9,621 | 37.57 | -3.75 | ||||
| Progressive Conservative | Cecil Fielding | 4,439 | 17.33 | +19.23 | ||||
| Total valid votes | 25,611 | 100.00 | ||||||
| 1965 Canadian federal election | ||||||||
|---|---|---|---|---|---|---|---|---|
| Party | Candidate | Votes | % | ±% | ||||
| New Democratic | Norman Fawcett | 10,863 | 41.32 | +22.84 | ||||
| Liberal | Osias Godin | 10,374 | 39.46 | -5.72 | ||||
| Progressive Conservative | Roger Landry | 5,055 | 19.23 | -5.25 | ||||
| Total valid votes | 26,292 | 100.00 | ||||||
| 1963 Canadian federal election | ||||||||
|---|---|---|---|---|---|---|---|---|
| Party | Candidate | Votes | % | ±% | ||||
| Liberal | Osias Godin | 13,414 | 45.18 | -11.74 | ||||
| Progressive Conservative | John MacLean | 7,268 | 24.48 | -4.54 | ||||
| New Democratic | Carl Maitland Griffith | 5,486 | 18.48 | +7.80 | ||||
| Social Credit | Oscar Degarie | 3,524 | 11.87 | +8.48 | ||||
| Total valid votes | 29,692 | 100.00 | ||||||
| 1962 Canadian federal election | ||||||||
|---|---|---|---|---|---|---|---|---|
| Party | Candidate | Votes | % | ±% | ||||
| Liberal | Osias Godin | 16,440 | 56.92 | +9.82 | ||||
| Progressive Conservative | Don Gillis | 8,381 | 29.02 | -4.94 | ||||
| New Democratic | Philippe Deaken | 3,085 | 10.68 | -8.26 | ||||
| Social Credit | Oscar Degarie | 978 | 3.39 | |||||
| Total valid votes | 28,884 | 100.00 | ||||||
Note: NDP vote is compared to CCF vote in 1958 election.
| 1958 Canadian federal election | ||||||||
|---|---|---|---|---|---|---|---|---|
| Party | Candidate | Votes | % | ±% | ||||
| Liberal | Osias Godin | 11,866 | 47.10 | +4.50 | ||||
| Progressive Conservative | Anthony Falzetta | 8,556 | 33.96 | -2.22 | ||||
| Co-operative Commonwealth | Harold Prescott | 4,772 | 18.94 | -2.29 | ||||
| Total valid votes | 25,194 | 100.00 | ||||||
| 1957 Canadian federal election | ||||||||
|---|---|---|---|---|---|---|---|---|
| Party | Candidate | Votes | % | ±% | ||||
| Liberal | Léo Gauthier | 8,819 | 42.60 | -15.97 | ||||
| Progressive Conservative | Anthony Falzetta | 7,490 | 36.18 | +15.30 | ||||
| Co-operative Commonwealth | Harold A. Prescott | 4,395 | 21.23 | +5.23 | ||||
| Total valid votes | 20,704 | 100.00 | ||||||
| 1953 Canadian federal election | ||||||||
|---|---|---|---|---|---|---|---|---|
| Party | Candidate | Votes | % | |||||
| Liberal | Léo Gauthier | 8,821 | 58.56 | |||||
| Progressive Conservative | Alistair MacLean | 3,144 | 20.87 | |||||
| Co-operative Commonwealth | Gilles Lefebvre | 2,410 | 16.00 | |||||
| Labor–Progressive | Harold Arthur Proctor | 687 | 4.56 | |||||
| Total valid votes | 15,062 | 100.00 | ||||||
References
- "(Code 35056) Census Profile". 2011 census. Statistics Canada. 2012. Retrieved 2011-03-03.
- Campaign expense data from Elections Canada
- Riding history from the Library of Parliament
- 2011 results from Elections Canada
Notes
- Statistics Canada: 2012
- Statistics Canada: 2012
- "List of confirmed candidates". Elections Canada. Retrieved October 4, 2019.
- "Election Night Results". Elections Canada. Retrieved October 31, 2019.
- Elections Canada – Confirmed candidates for Nickel Belt, 30 September 2015
- Elections Canada – Preliminary Election Expenses Limits for Candidates
- Pundits' Guide to Canadian Elections
.png.webp)