Sudbury (electoral district)
Sudbury is a federal electoral district in Ontario, Canada, that has been represented in the House of Commons of Canada since 1949. The district is one of two serving the city of Greater Sudbury, Ontario.
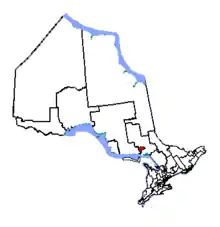 Sudbury in relation to other northern Ontario electoral districts (2003 boundaries) | |||
| Federal electoral district | |||
| Legislature | House of Commons | ||
| MP |
Liberal | ||
| District created | 1947 | ||
| First contested | 1949 | ||
| Last contested | 2019 | ||
| District webpage | profile, map | ||
| Demographics | |||
| Population (2011)[1] | 92,048 | ||
| Electors (2015) | 71,844 | ||
| Area (km²)[2] | 854.57 | ||
| Pop. density (per km²) | 107.7 | ||
| Census division(s) | Greater Sudbury | ||
| Census subdivision(s) | Greater Sudbury | ||
Geography
Sudbury electoral district consists of the part of the City of Greater Sudbury bounded on the west and south by the Greater Sudbury city limits, and on the north and east by a line drawn from the western city limit of Greater Sudbury east along the northern limit of the former Town of Walden, north, east and south along the limits of the former City of Sudbury, west along Highway 69 and Regent Street, south along Long Lake Road, west along the northern boundary of the Township of Broder, southwest along Kelly Lake, and south along the eastern limit of the former Town of Walden to the southern city limit of Greater Sudbury.
History
Sudbury electoral district was created in 1947 from part of the Nipissing riding. It consisted initially of the city of Sudbury and a part of the territorial district of Sudbury.
In 1952, the boundaries were narrowed significantly to include only the city of Sudbury, the geographic township of McKim and the town of Copper Cliff. The rest of the original Sudbury riding was incorporated into the new riding of Nickel Belt.
In 1976, Sudbury's growth in population led the riding to shrink further. It now included only the northern half of the city; the city's southern half was incorporated into Nickel Belt.
In 1996, it was redefined as the part of the City of Sudbury north of a line drawn from east to west along Highway 69, south along Long Lake Road, and west along the north boundary of the geographic Township of Broder.
In 2003, a decline in population led to this riding expanding geographically to include the former town of Walden, now part of the city of Greater Sudbury. The remainder of the city continues to be part of the Nickel Belt riding.
This riding was left unchanged after the 2012 electoral redistribution.
Riding associations
Riding associations are the local branches of political parties:
| Party | Association Name | CEO | HQ Address | HQ City | |
| Conservative | Sudbury Conservative Association | Steve S. Moutsatsos | 233 Brady Street East | Sudbury | |
| Green | Sudbury Federal Green Party Association | Simon McMillan | 2080 South Bay Road | Sudbury | |
| Liberal | Sudbury Federal Liberal Association | W. Gary Duhaime | 2176 Robin Street | Sudbury | |
| New Democratic | Sudbury Federal NDP Riding Association | Richard Eberhardt | 182 George Avenue | Sudbury | |
Members of Parliament
This riding has elected the following Members of Parliament:
| Parliament | Years | Member | Party | |
|---|---|---|---|---|
| Sudbury Riding created from Nipissing |
||||
| 21st | 1949–1953 | Léo Gauthier | Liberal | |
| 22nd | 1953–1957 | Rodger Mitchell | ||
| 23rd | 1957–1958 | |||
| 24th | 1958–1962 | |||
| 25th | 1962–1963 | |||
| 26th | 1963–1965 | |||
| 27th | 1965–1967 | |||
| 1967–1968 | Bud Germa | New Democratic | ||
| 28th | 1968–1972 | James Jerome | Liberal | |
| 29th | 1972–1974 | |||
| 30th | 1974–1979 | |||
| 31st | 1979–1980 | |||
| 32nd | 1980–1984 | Doug Frith | ||
| 33rd | 1984–1988 | |||
| 34th | 1988–1993 | Diane Marleau | ||
| 35th | 1993–1997 | |||
| 36th | 1997–2000 | |||
| 37th | 2000–2004 | |||
| 38th | 2004–2006 | |||
| 39th | 2006–2008 | |||
| 40th | 2008–2011 | Glenn Thibeault | New Democratic | |
| 41st | 2011–2014 | |||
| 42nd | 2015–2019 | Paul Lefebvre | Liberal | |
| 43rd | 2019–present | |||
Election results
| 2019 Canadian federal election | ||||||||
|---|---|---|---|---|---|---|---|---|
| Party | Candidate | Votes | % | ±% | Expenditures | |||
| Liberal | Paul Lefebvre | 19,643 | 40.9 | -6.51 | $66,620.57 | |||
| New Democratic | Beth Mairs | 13,885 | 28.9 | +1.11 | $25,924.07 | |||
| Conservative | Pierre St-Amant | 9,864 | 20.6 | -0.5 | $20,356.06 | |||
| Green | Bill Crumplin | 3,225 | 6.7 | +3.66 | $13,223.85 | |||
| People's | Sean Paterson | 873 | 1.8 | – | none listed | |||
| Animal Protection | Chanel Lalonde | 282 | 0.6 | – | none listed | |||
| Independent | Charlene Sylvestre | 135 | 0.3 | – | none listed | |||
| Independent | J. David Popescu | 70 | 0.1 | -0.07 | none listed | |||
| Total valid votes/Expense limit | 47,977 | 100.0 | ||||||
| Total rejected ballots | 317 | |||||||
| Turnout | 48,294 | 65.2 | ||||||
| Eligible voters | 74,030 | |||||||
| Liberal hold | Swing | -3.81 | ||||||
| Source: Elections Canada[3][4] | ||||||||
| 2015 Canadian federal election | ||||||||
|---|---|---|---|---|---|---|---|---|
| Party | Candidate | Votes | % | ±% | Expenditures | |||
| Liberal | Paul Lefebvre | 23,534 | 47.41 | +29.43 | $112,165.16 | |||
| New Democratic | Paul Loewenberg | 13,793 | 27.79 | -22.13 | $95,385.84 | |||
| Conservative | Fred Slade | 10,473 | 21.10 | -7.25 | $192,788.16 | |||
| Green | David Robinson | 1,509 | 3.04 | +0.05 | $4,970.15 | |||
| Independent | Jean-Raymond Audet | 134 | 0.27 | – | – | |||
| Communist | Elizabeth Rowley | 102 | 0.20 | – | – | |||
| Independent | J. David Popescu | 84 | 0.17 | -0.09 | – | |||
| Total valid votes/Expense limit | 49,629 | 100.0 | $204,934.28 | |||||
| Total rejected ballots | 209 | – | – | |||||
| Turnout | 49,838 | 69.61 | – | |||||
| Eligible voters | 71,594 | |||||||
| Liberal gain from New Democratic | Swing | +34.77 | ||||||
| Source: Elections Canada[5][6] | ||||||||
| 2011 Canadian federal election | ||||||||
|---|---|---|---|---|---|---|---|---|
| Party | Candidate | Votes | % | ±% | Expenditures | |||
| New Democratic | Glenn Thibeault | 22,684 | 49.92 | +14.77 | – | |||
| Conservative | Fred Slade | 12,881 | 28.35 | +2.56 | – | |||
| Liberal | Carol Hartman | 8,172 | 17.98 | -12.22 | – | |||
| Green | Frederick Twilley | 1,359 | 2.99 | -4.76 | – | |||
| First Peoples National | Will Morin | 229 | 0.50 | -0.42 | – | |||
| Independent | David Popescu | 116 | 0.26 | +0.07 | – | |||
| Total valid votes/Expense limit | 45,441 | 100.00 | ||||||
| Total rejected ballots | 180 | 0.39 | -0.05 | |||||
| Turnout | 45,621 | 63.89 | +5.38 | |||||
| Eligible voters | 71,409 | – | – | |||||
| 2008 Canadian federal election | ||||||||
|---|---|---|---|---|---|---|---|---|
| Party | Candidate | Votes | % | ±% | Expenditures | |||
| New Democratic | Glenn Thibeault | 15,094 | 35.15 | +3.20 | $71,329 | |||
| Liberal | Diane Marleau | 12,969 | 30.20 | −11.37 | $50,177 | |||
| Conservative | Gerry Labelle | 11,073 | 25.79 | +4.11 | $85,730 | |||
| Green | Gordon Harris | 3,330 | 7.75 | +5.02 | $8,704 | |||
| First Peoples National | Will Morin | 397 | 0.92 | $0 | ||||
| Independent | David Popescu | 80 | 0.19 | +0.08 | $148 | |||
| Total valid votes/Expense limit | 42,943 | 100.00 | $82,461 | |||||
| Total rejected ballots | 192 | 0.45 | −0.03 | |||||
| Turnout | 43,135 | 58.51 | −7.48 | |||||
| Electors on the lists | 73,724 | |||||||
| Note: italicized expenditure totals refer to data that has not yet been finalized by Elections Canada. | ||||||||
| 2006 Canadian federal election | ||||||||
|---|---|---|---|---|---|---|---|---|
| Party | Candidate | Votes | % | ±% | Expenditures | |||
| Liberal | Diane Marleau | 19,809 | 41.57 | −2.62 | $78,232 | |||
| New Democratic | Gerry McIntaggart | 15,225 | 31.95 | +2.09 | $38,386 | |||
| Conservative | Kevin Serviss | 10,332 | 21.68 | +0.63 | $73,294 | |||
| Green | Joey Methé | 1,301 | 2.73 | −1.94 | $420 | |||
| Progressive Canadian | Stephen L. Butcher | 782 | 1.64 | – | $365 | |||
| Marxist–Leninist | Dave Starbuck | 77 | 0.16 | −0.07 | ||||
| Communist | Sam Hammond | 70 | 0.15 | $280 | ||||
| Independent | David Popescu | 54 | 0.11 | – | $365 | |||
| Total valid votes | 47,650 | 100.00 | ||||||
| Total rejected ballots | 228 | 0.48 | −0.07 | |||||
| Turnout | 47,878 | 65.99 | +5.91 | |||||
| Electors on the lists | 72,552 | |||||||
| Sources: Official Results, Elections Canada and Financial Returns, Elections Canada. | ||||||||
| 2004 Canadian federal election | ||||||||
|---|---|---|---|---|---|---|---|---|
| Party | Candidate | Votes | % | ±% | Expenditures | |||
| Liberal | Diane Marleau | 18,914 | 44.19 | −12.80 | $56,246 | |||
| New Democratic | Gerry McIntaggart | 12,781 | 29.86 | +16.42 | $19,265 | |||
| Conservative | Stephen L. Butcher | 9,008 | 21.05 | −6.44 | $60,810 | |||
| Green | Luke Norton | 1,999 | 4.67 | $1,348 | ||||
| Marxist–Leninist | Dave Starbuck | 100 | 0.23 | $660 | ||||
| Total valid votes | 42,802 | 100.00 | ||||||
| Total rejected ballots | 235 | 0.55 | −0.06 | |||||
| Turnout | 43,037 | 60.08 | +5.77 | |||||
| Electors on the lists | 71,627 | |||||||
| Percentage change figures are factored for redistribution. Conservative Party percentages are contrasted with the combined Canadian Alliance and Progressive Conservative percentages from 2000. | ||||||||
| Sources: Official Results, Elections Canada and Financial Returns, Elections Canada. | ||||||||
| 2000 Canadian federal election | ||||||||
|---|---|---|---|---|---|---|---|---|
| Party | Candidate | Votes | % | ±% | Expenditures | |||
| Liberal | Diane Marleau | 20,290 | 58.52 | +3.10 | $49,746 | |||
| Alliance | Mike Smith | 6,554 | 18.90 | +5.94 | $24,801 | |||
| New Democratic | Paul Chislett | 4,368 | 12.60 | −8.52 | $10,732 | |||
| Progressive Conservative | Alex McGregor | 2,642 | 7.62 | −1.01 | $3,827 | |||
| Green | Thomas Gerry | 503 | 1.45 | $327 | ||||
| Canadian Action | Kathy Wells-McNeil | 215 | 0.62 | −0.63 | $2,006 | |||
| Communist | Daryl Janet Shandro | 98 | 0.28 | $591 | ||||
| Total valid votes | 34,670 | 100.00 | ||||||
| Total rejected ballots | 210 | 0.60 | −0.41 | |||||
| Turnout | 34,880 | 54.31 | −8.20 | |||||
| Electors on the lists | 64,220 | |||||||
| Sources: Official Results, Elections Canada and Financial Returns, Elections Canada. | ||||||||
| 1997 Canadian federal election | ||||||||
|---|---|---|---|---|---|---|---|---|
| Party | Candidate | Votes | % | ±% | Expenditures | |||
| Liberal | Diane Marleau | 22,223 | 55.42 | −9.56 | $38,251 | |||
| New Democratic | John Filo | 8,471 | 21.12 | −0.93 | $43,509 | |||
| Reform | Jim Rollo | 5,198 | 12.96 | +11.66 | $10,657 | |||
| Progressive Conservative | Bill Lee | 3,459 | 8.63 | +0.28 | $6,493 | |||
| Canadian Action | Kathy McNeil | 502 | 1.25 | $1,258 | ||||
| Natural Law | Roy Hankonen | 247 | 0.62 | $0.00 | ||||
| Total valid votes | 40,100 | 100.00 | ||||||
| Total rejected ballots | 412 | 1.02 | +0.72 | |||||
| Turnout | 40,512 | 62.51 | −2.82 | |||||
| Electors on the lists | 64,806 | |||||||
| Percentage change figures are factored for redistribution. | ||||||||
| Sources: Official Results, Elections Canada and Financial Returns, Elections Canada. | ||||||||
| 1993 Canadian federal election | ||||||||
|---|---|---|---|---|---|---|---|---|
| Party | Candidate | Votes | % | ±% | Expenditures | |||
| Liberal | Diane Marleau | 27,951 | 66.08 | +24.05 | $37,453 | |||
| Reform | Mike Smith | 5,788 | 13.68 | $8,233 | ||||
| Progressive Conservative | Maurice Lamoureux | 3,679 | 8.70 | −13.29 | $35,719 | |||
| New Democratic Party | Rosemarie Blenkinsop | 3,675 | 8.69 | −19.08 | $36,968 | |||
| National | Paul Chislett | 512 | 1.21 | $1,555 | ||||
| Non-affiliated (CoR) | Billie Christiansen | 276 | 0.65 | −7.32 | $2,852 | |||
| Natural Law | David Shaw | 202 | 0.48 | $141 | ||||
| Independent | Ed Pokonzie | 129 | 0.30 | $230 | ||||
| Abolitionist | Richard Lionel Gouin | 86 | 0.20 | $0 | ||||
| Total valid votes | 42,298 | 100.00 | ||||||
| Total rejected ballots | 379 | 0.89 | +0.34 | |||||
| Turnout | 42,677 | 65.41 | −8.15 | |||||
| Electors on the lists | 65,243 | |||||||
| Source: Thirty-fifth General Election, 1993: Official Voting Results, Published by the Chief Electoral Officer of Canada. Financial figures taken from official contributions and expenses provided by Elections Canada. | ||||||||
| 1988 Canadian federal election | ||||||||
|---|---|---|---|---|---|---|---|---|
| Party | Candidate | Votes | % | ±% | Expenditures | |||
| Liberal | Diane Marleau | 17,879 | 42.03 | +0.9 | $37,582 | |||
| New Democratic | Bill Major | 11,811 | 27.77 | +2.0 | $36,732 | |||
| Progressive Conservative | Bob Fera | 9,356 | 21.99 | −10.1 | $43,024 | |||
| Confederation of Regions | S. Brent Ridley | 3,391 | 7.97 | $8,808 | ||||
| Communist | Mike Phillips | 102 | 0.24 | $2,044 | ||||
| Total valid votes | 42,539 | 100.00 | ||||||
| Total rejected ballots | 234 | 0.55 | ||||||
| Turnout | 42,773 | 73.56 | ||||||
| Electors on the lists | 58,144 | |||||||
| Note: The +/- totals are factored for redistribution. | ||||||||
| 1984 Canadian federal election | ||||||||
|---|---|---|---|---|---|---|---|---|
| Party | Candidate | Votes | % | ±% | ||||
| Liberal | Doug Frith | 18,012 | 41.30 | -14.40 | ||||
| Progressive Conservative | John A. Dediana | 14,100 | 32.33 | +20.50 | ||||
| New Democratic | Harriet Conroy | 11,185 | 25.65 | -5.51 | ||||
| Rhinoceros | Phil Moon Popovich | 241 | 0.55 | -0.18 | ||||
| Communist | Bruce Magnuson | 75 | 0.17 | +0.02 | ||||
| Total valid votes | 43,613 | 100.00 | ||||||
| 1980 Canadian federal election | ||||||||
|---|---|---|---|---|---|---|---|---|
| Party | Candidate | Votes | % | ±% | ||||
| Liberal | Doug Frith | 21,954 | 55.70 | -6.17 | ||||
| New Democratic | Mort Paterson | 12,280 | 31.15 | -3.06 | ||||
| Progressive Conservative | Murray Watts | 4,661 | 11.82 | -1.75 | ||||
| Rhinoceros | Raymond Lalonde | 288 | 0.73 | |||||
| Marxist–Leninist | Don Fleming | 93 | 0.24 | +0.11 | ||||
| Independent | David De Launay | 83 | 0.21 | |||||
| Communist | Steve Amsel | 58 | 0.15 | -0.05 | ||||
| Total valid votes | 39,417 | 100.00 | ||||||
| 1979 Canadian federal election | ||||||||
|---|---|---|---|---|---|---|---|---|
| Party | Candidate | Votes | % | ±% | ||||
| Liberal | James Jerome | 20,634 | 49.53 | -3.08 | ||||
| New Democratic | Mort Paterson | 14,252 | 34.21 | +4.50 | ||||
| Progressive Conservative | Peter Hope | 5,656 | 13.58 | -3.63 | ||||
| Independent | Jerome Davis | 599 | 1.44 | |||||
| Libertarian | George Christakos | 383 | 0.92 | |||||
| Communist | Steve Amsel | 82 | 0.20 | -0.28 | ||||
| Marxist–Leninist | Don Fleming | 53 | 0.13 | |||||
| Total valid votes | 41,659 | 100.00 | ||||||
| 1974 Canadian federal election | ||||||||
|---|---|---|---|---|---|---|---|---|
| Party | Candidate | Votes | % | ±% | ||||
| Liberal | James Jerome | 23,374 | 52.61 | -2.45 | ||||
| New Democratic | Don Scott | 13,200 | 29.71 | -1.71 | ||||
| Progressive Conservative | John Goodearle | 7,646 | 17.21 | +3.69 | ||||
| Communist | Ed McDonald | 210 | 0.47 | |||||
| Total valid votes | 44,430 | 100.00 | ||||||
| 1972 Canadian federal election | ||||||||
|---|---|---|---|---|---|---|---|---|
| Party | Candidate | Votes | % | ±% | ||||
| Liberal | James Jerome | 24,091 | 55.06 | +2.78 | ||||
| New Democratic | Garry Clarke | 13,748 | 31.42 | -1.16 | ||||
| Progressive Conservative | Adam Borovich | 5,913 | 13.51 | -1.62 | ||||
| Total valid votes | 43,752 | 100.00 | ||||||
| 1968 Canadian federal election | ||||||||
|---|---|---|---|---|---|---|---|---|
| Party | Candidate | Votes | % | ±% | ||||
| Liberal | James Jerome | 19,672 | 52.28 | +7.70 | ||||
| New Democratic | Bud Germa | 12,260 | 32.58 | -12.55 | ||||
| Progressive Conservative | Robert Desmarais | 5,696 | 15.14 | +6.48 | ||||
| Total valid votes | 37,628 | 100.00 | ||||||
| Canadian federal by-election, 29 May 1967 | ||||||||
|---|---|---|---|---|---|---|---|---|
| Party | Candidate | Votes | % | ±% | ||||
| On Mr. Mitchell's death, 4 January 1967 | ||||||||
| New Democratic | Bud Germa | 12,982 | 45.13 | +8.90 | ||||
| Liberal | James Jerome | 12,823 | 44.58 | -0.07 | ||||
| Progressive Conservative | Colin Caswell | 2,491 | 8.66 | -10.47 | ||||
| Independent | G.W. Bill Passi | 244 | 0.85 | |||||
| Social Credit | Donald A. Land | 225 | 0.78 | |||||
| Total valid votes | 28,765 | 100.00 | ||||||
| 1965 Canadian federal election | ||||||||
|---|---|---|---|---|---|---|---|---|
| Party | Candidate | Votes | % | ±% | ||||
| Liberal | Rodger Mitchell | 13,247 | 44.65 | -4.17 | ||||
| New Democratic | Bud Germa | 10,749 | 36.23 | +19.31 | ||||
| Progressive Conservative | Bruce Kerr | 5,675 | 19.13 | -7.45 | ||||
| Total valid votes | 29,671 | 100.00 | ||||||
| 1963 Canadian federal election | ||||||||
|---|---|---|---|---|---|---|---|---|
| Party | Candidate | Votes | % | ±% | ||||
| Liberal | Rodger Mitchell | 15,794 | 48.82 | -8.95 | ||||
| Progressive Conservative | Tom Dixon | 8,597 | 26.57 | +1.28 | ||||
| New Democratic | John Masih | 5,472 | 16.91 | +2.76 | ||||
| Social Credit | Murray R. Maher | 2,180 | 6.74 | +3.96 | ||||
| Communist | Peter Boychuck | 311 | 0.96 | |||||
| Total valid votes | 32,354 | 100.00 | ||||||
| 1962 Canadian federal election | ||||||||
|---|---|---|---|---|---|---|---|---|
| Party | Candidate | Votes | % | ±% | ||||
| Liberal | Rodger Mitchell | 17,628 | 57.77 | +6.63 | ||||
| Progressive Conservative | Hugh Doig | 7,719 | 25.29 | -9.66 | ||||
| New Democratic | John Masih | 4,320 | 14.16 | +0.24 | ||||
| Social Credit | Elmer Dell Bolick | 849 | 2.78 | |||||
| Total valid votes | 30,516 | 100.00 | ||||||
Note: NDP vote is compared to CCF vote in 1958 election.
| 1958 Canadian federal election | ||||||||
|---|---|---|---|---|---|---|---|---|
| Party | Candidate | Votes | % | ±% | ||||
| Liberal | Rodger Mitchell | 16,216 | 51.13 | +5.14 | ||||
| Progressive Conservative | R.M. Mitchell | 11,084 | 34.95 | -5.31 | ||||
| Co-operative Commonwealth | Bill Ellis | 4,413 | 13.92 | +0.16 | ||||
| Total valid votes | 31,713 | 100.00 | ||||||
| 1957 Canadian federal election | ||||||||
|---|---|---|---|---|---|---|---|---|
| Party | Candidate | Votes | % | ±% | ||||
| Liberal | Rodger Mitchell | 11,927 | 45.99 | -11.24 | ||||
| Progressive Conservative | R.M. Mitchell | 10,440 | 40.26 | +13.98 | ||||
| Co-operative Commonwealth | Ray H. Jacobs | 3,566 | 13.75 | -2.74 | ||||
| Total valid votes | 25,933 | 100.00 | ||||||
| 1953 Canadian federal election | ||||||||
|---|---|---|---|---|---|---|---|---|
| Party | Candidate | Votes | % | ±% | ||||
| Liberal | Rodger Mitchell | 12,193 | 57.23 | +13.21 | ||||
| Progressive Conservative | Laurier Lamoureux | 5,598 | 26.28 | +3.73 | ||||
| Co-operative Commonwealth | Willard H. Evoy | 3,514 | 16.49 | +0.40 | ||||
| Total valid votes | 21,305 | 100.00 | ||||||
| 1949 Canadian federal election | ||||||||
|---|---|---|---|---|---|---|---|---|
| Party | Candidate | Votes | % | |||||
| Liberal | Léo Gauthier | 15,636 | 44.02 | |||||
| Progressive Conservative | Patrick Joseph McAndrew | 8,009 | 22.55 | |||||
| Farmer Labour | Robert Carlin | 6,161 | 17.34 | |||||
| Co-operative Commonwealth | Willard H. Evoy | 5,717 | 16.09 | |||||
| Total valid votes | 35,523 | 100.00 | ||||||
References
- "(Code 35088) Census Profile". 2011 census. Statistics Canada. 2012. Retrieved 3 March 2011.
Notes
- Statistics Canada: 2011
- Statistics Canada: 2011
- "List of confirmed candidates". Elections Canada. Retrieved 4 October 2019.
- "Election Night Results". Elections Canada. Retrieved 31 October 2019.
- Elections Canada – Confirmed candidates for Sudbury, 30 September 2015
- Elections Canada – Preliminary Election Expenses Limits for Candidates
External links
- Riding history from the Library of Parliament
- 2011 results from Elections Canada
- Campaign expense data from Elections Canada
.png.webp)