Sault Ste. Marie (electoral district)
Sault Ste. Marie is a federal electoral district in Ontario, Canada, that has been represented in the House of Commons of Canada since 1968.
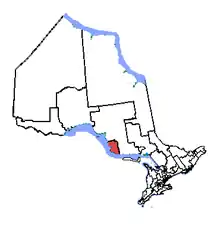 Sault Ste. Marie in relation to other northern Ontario electoral districts (2003 boundaries) | |||
| Federal electoral district | |||
| Legislature | House of Commons | ||
| MP |
Liberal | ||
| District created | 1966 | ||
| First contested | 1968 | ||
| Last contested | 2019 | ||
| District webpage | profile, map | ||
| Demographics | |||
| Population (2011)[1] | 82,052 | ||
| Electors (2015) | 63,555 | ||
| Area (km²)[2] | 5,921 | ||
| Pop. density (per km²) | 13.9 | ||
| Census division(s) | Algoma | ||
| Census subdivision(s) | Garden River 14, Goulais Bay 15A, Obadjiwan 15E, Prince, Sault Ste. Marie, Unorganized North Algoma, Whitefish Island | ||
This riding is centred on the city of Sault Ste. Marie. It includes the adjacent communities of Rankin Location 15D, Garden River 14 and Prince, and covers a portion of Unorganized North Algoma District north to the Montreal River (including the communities of Goulais Bay 15A and Obadjiwan 15E).
Electoral district
The riding was created in 1966 from parts of Algoma West riding. For most of its history, the riding included only the city of Sault Ste. Marie and some immediately surrounding communities.
It consisted initially of the City of Sault Ste. Marie and the Township of Prince. In 1976, it was redefined to consist of the part of the City of Sault Ste. Marie east of Allen's Side Road and south of the Second Line.
In 1987, it was redefined to consist of the part of the City of Sault Ste. Marie lying south of Third Line and the part of Rankin Location 15D lying within the city limits.
In 1996, it was redefined to consist of the City of Sault Ste. Marie.
In 2003, the geographic boundaries of this riding were expanded and defined as:
- "Consisting of that part of the Territorial District of Algoma lying westerly and southerly of a line described as follows: commencing at the intersection of the international boundary between Canada and the United States with the southeast corner of the Township of Plummer Additional; thence northerly and westerly along the easterly and northerly limits of said township to the southwest corner of the geographic Township of Galbraith; thence northerly along the westerly boundary of the geographic townships of Galbraith, Morin, Kane, Hurlburt, Jollineau, Menard, Pine, Hoffman and Butcher to the southerly limit of the Territorial District of Sudbury; thence westerly and northerly along the southerly and westerly limits of said territorial district to the Montreal River; thence generally westerly along said river to the northerly boundary of the geographic Township of Home; thence westerly along the northerly boundary of the geographic townships of Home and Peever to the northern shore of Lake Superior; thence S 45°00' W to the international boundary between Canada and the United States of America."
Current boundaries
In the 2012 federal electoral redistribution, this riding was redefined, losing St. Joseph Island, Macdonald, Meredith and Aberdeen Additional, Laird, Tarbutt, Johnson, Plummer Additional, Bruce Mines and a portion of Unorganized North Algoma to Algoma—Manitoulin—Kapuskasing. It is now defined as:
- "Consisting of that part of the Territorial District of Algoma described as follows: commencing at the intersection of the international boundary between Canada and the United States of America with the southeasterly corner of the Territorial District of Thunder Bay; thence N45°00'E in a straight line to the intersection of the northern shoreline of Lake Superior with the northerly boundary of the geographic Township of Peever; thence easterly along the northerly boundary of the geographic townships of Peever and Home to the Montreal River; thence generally easterly along said river to the easterly limit of the Territorial District of Algoma; thence southerly and easterly along the limit of said territorial district to the easterly boundary of the geographic Township of Bracci; thence southerly along said boundary and the easterly boundary of the geographic townships of Gaudry, Nahwegezhic, Lamming, Hughes, Curtis, Gillmor and McMahon to the northerly boundary of the geographic Township of Aberdeen; thence westerly along said boundary to the northerly limit of the Township of MacDonald, Meredith and Aberdeen Additional; thence generally westerly along said limit to the international boundary between Canada and the United States of America; thence generally westerly and northwesterly along said boundary to the point of commencement."[3]
Members of Parliament
This riding has elected the following Members of Parliament:
| Parliament | Years | Member | Party | |
|---|---|---|---|---|
| Sault Ste. Marie Riding created from Algoma West |
||||
| 28th | 1968–1972 | Terrence Murphy | Liberal | |
| 29th | 1972–1974 | Cyril Symes | New Democratic | |
| 30th | 1974–1979 | |||
| 31st | 1979–1980 | |||
| 32nd | 1980–1984 | Ron Irwin | Liberal | |
| 33rd | 1984–1988 | James Kelleher | Progressive Conservative | |
| 34th | 1988–1993 | Steve Butland | New Democratic | |
| 35th | 1993–1997 | Ron Irwin | Liberal | |
| 36th | 1997–2000 | Carmen Provenzano | ||
| 37th | 2000–2004 | |||
| 38th | 2004–2006 | Tony Martin | New Democratic | |
| 39th | 2006–2008 | |||
| 40th | 2008–2011 | |||
| 41st | 2011–2015 | Bryan Hayes | Conservative | |
| 42nd | 2015–2019 | Terry Sheehan | Liberal | |
| 43rd | 2019–present | |||
Election results
Sault Ste. Marie, 2013 Representation Order
| 2019 Canadian federal election | ||||||||
|---|---|---|---|---|---|---|---|---|
| Party | Candidate | Votes | % | ±% | Expenditures | |||
| Liberal | Terry Sheehan | 16,284 | 39.1 | $77,577.01 | ||||
| Conservative | Sonny Spina | 13,407 | 32.2 | $63,685.77 | ||||
| New Democratic | Sara McCleary | 9,459 | 22.7 | $23,511.40 | ||||
| Green | Geo McLean | 1,809 | 4.3 | $1,428.49 | ||||
| People's | Amy Zuccato | 741 | 1.8 | new | none listed | |||
| Total valid votes/Expense limit | 41,700 | 100.0 | ||||||
| Total rejected ballots | 337 | |||||||
| Turnout | 42,037 | 63.5 | ||||||
| Eligible voters | 66,235 | |||||||
| Liberal hold | Swing | |||||||
| Source: Elections Canada[4][5] | ||||||||
| 2015 Canadian federal election | ||||||||
|---|---|---|---|---|---|---|---|---|
| Party | Candidate | Votes | % | ±% | Expenditures | |||
| Liberal | Terry Sheehan | 19,582 | 44.75 | $59,074.57 | ||||
| Conservative | Bryan Hayes | 13,615 | 31.12 | $114,243.06 | ||||
| New Democratic | Skip Morrison | 9,543 | 21.81 | $63,747.71 | ||||
| Green | Kara Flannigan | 934 | 2.13 | $127.42 | ||||
| Marxist–Leninist | Mike Taffarel | 83 | 0.19 | none listed | ||||
| Total valid votes/Expense limit | 43,757 | 100.0 | $198,539.65 | |||||
| Total rejected ballots | 200 | 0.45 | ||||||
| Turnout | 43,957 | 69.16 | ||||||
| Eligible voters | 63,555 | |||||||
| Liberal gain from Conservative | Swing | |||||||
| Source: Elections Canada[6][7] | ||||||||
| 2011 federal election redistributed results[8] | |||
|---|---|---|---|
| Party | Votes | % | |
| Conservative | 16,316 | 40.40 | |
| New Democratic | 15,123 | 37.44 | |
| Liberal | 7,967 | 19.73 | |
| Green | 845 | 2.09 | |
| Others | 138 | 0.34 | |
Sault Ste. Marie, 2003 Representation Order
| 2011 Canadian federal election | ||||||||
|---|---|---|---|---|---|---|---|---|
| Party | Candidate | Votes | % | ±% | Expenditures | |||
| Conservative | Bryan Hayes | 18,328 | 41.14 | $80,142.96 | ||||
| New Democratic | Tony Martin | 16,467 | 37.23 | $81,906.09 | ||||
| Liberal | Christian Provenzano | 8,343 | 18.86 | $63,159.73 | ||||
| Green | Luke MacMichael | 945 | 2.14 | $3,129.72 | ||||
| Christian Heritage | Randy Riauka | 111 | 0.25 | new | $105.54 | |||
| Marxist–Leninist | Mike Taffarel | 38 | 0.09 | none listed | ||||
| Total valid votes/Expense limit | 44,232 | 100.0 | $86,404.40 | |||||
| Total rejected ballots | 228 | 0.51 | ||||||
| Turnout | 44,460 | 64.19 | ||||||
| Eligible voters | 69,259 | |||||||
| Conservative gain from New Democratic | Swing | |||||||
| Sources:[9][10] | ||||||||
| 2008 Canadian federal election | ||||||||
|---|---|---|---|---|---|---|---|---|
| Party | Candidate | Votes | % | ±% | Expenditures | |||
| New Democratic | Tony Martin | 16,572 | 40.43 | +1.55 | $83,799.84 | |||
| Conservative | Cameron Ross | 15,461 | 37.72 | +13.72 | $79,518.05 | |||
| Liberal | Paul Bichler | 6,870 | 16.76 | -17.46 | $35,533.07 | |||
| Green | Luke Macmichael | 1,774 | 4.33 | +2.28 | $2,586.65 | |||
| First Peoples National | Cory McLeod | 235 | 0.57 | +0.08 | $433.95 | |||
| Marxist–Leninist | Mike Taffarel | 81 | 0.20 | +0.13 | none listed | |||
| Total valid votes/Expense limit | 40,993 | 100.0 | $83,824 | |||||
| Total rejected ballots | 165 | 0.40 | -1.25 | |||||
| Turnout | 41,158 | 59.42 | -8.33 | |||||
| Eligible voters | 69,272 | |||||||
| New Democratic hold | Swing | -6.08 | ||||||
| 2006 Canadian federal election | ||||||||
|---|---|---|---|---|---|---|---|---|
| Party | Candidate | Votes | % | ±% | Expenditures | |||
| New Democratic | Tony Martin | 17,979 | 38.88 | +0.59 | $69,741.00 | |||
| Liberal | Christian Provenzano | 15,825 | 34.22 | -2.33 | $66,957.47 | |||
| Conservative | Kenneth Walker | 11,099 | 24.00 | +0.88 | $62,248.21 | |||
| Green | Mark Viitala | 1,056 | 2.28 | +0.39 | $1,450.96 | |||
| First Peoples National | Guy Dumas | 225 | 0.49 | – | $419.75 | |||
| Marxist–Leninist | Mike Taffarel | 59 | 0.13 | -0.03 | $184.15 | |||
| Total valid votes/Expense limit | 46,243 | 100.0 | $77,689 | |||||
| Total rejected ballots | 192 | 1.65 | +0.59 | |||||
| Turnout | 46,435 | 67.75 | ||||||
| Eligible voters | 68,537 | |||||||
| New Democratic hold | Swing | +1.46 | ||||||
| 2004 Canadian federal election | ||||||||
|---|---|---|---|---|---|---|---|---|
| Party | Candidate | Votes | % | ±% | Expenditures | |||
| New Democratic | Tony Martin | 16,512 | 38.29 | +14.30 | $66,870.00 | |||
| Liberal | Carmen Provenzano | 15,760 | 36.55 | -11.64 | $46,534.02 | |||
| Conservative | Cameron Ross | 9,969 | 23.12 | -2.28 | $47,437.02 | |||
| Green | Julie Emmerson | 814 | 1.89 | – | $379.80 | |||
| Marxist–Leninist | Mike Taffarel | 67 | 0.16 | – | $357.98 | |||
| Total valid votes/Expense limit | 43,122 | 100.0 | $75,828 | |||||
| Total rejected ballots | 250 | 0.58 | ||||||
| Turnout | 43,372 | 63.36 | +0.73 | |||||
| Eligible voters | 68,454 | |||||||
| New Democratic notional gain from Liberal | Swing | +12.97 | ||||||
| Changes from 2000 are based on redistributed results. Change for the Conservative Party is based on the combined totals of the Canadian Alliance and the Progressive Conservative Party. | ||||||||
| 2000 federal election redistributed results | |||
|---|---|---|---|
| Party | Vote | % | |
| Liberal | 20,510 | 48.19 | |
| New Democratic | 10,211 | 23.99 | |
| Alliance | 9,287 | 21.82 | |
| Progressive Conservative | 1,522 | 3.58 | |
| Others | 1,030 | 2.42 | |
Sault Ste. Marie, previous elections
| 2000 Canadian federal election | ||||||||
|---|---|---|---|---|---|---|---|---|
| Party | Candidate | Votes | % | ±% | ||||
| Liberal | Carmen Provenzano | 18,867 | 50.79 | +6.30 | ||||
| New Democratic | Bud Wildman | 9,202 | 24.77 | -2.35 | ||||
| Alliance | David Ronald Rose | 7,006 | 18.86 | -1.01 | ||||
| Progressive Conservative | Doug Lawson | 1,168 | 3.14 | -4.80 | ||||
| Green | Kathie Brosemer | 776 | 2.09 | |||||
| Canadian Action | Martin Bruce Odber | 128 | 0.34 | |||||
| Total | 37,147 | 100.00 | ||||||
* Changes for the Canadian Alliance are from the Reform votes in 1997.
| 1997 Canadian federal election | ||||||||
|---|---|---|---|---|---|---|---|---|
| Party | Candidate | Votes | % | ±% | ||||
| Liberal | Carmen Provenzano | 16,871 | 44.49 | -8.42 | ||||
| New Democratic | Phyllis Dietrich | 10,283 | 27.12 | +4.95 | ||||
| Reform | David Rose | 7,536 | 19.87 | +3.64 | ||||
| Progressive Conservative | Doug Lawson | 3,010 | 7.94 | +0.15 | ||||
| Natural Law | Colleen Hibbs | 219 | 0.58 | +0.20 | ||||
| Total | 37,919 | 100.00 | ||||||
| 1993 Canadian federal election | ||||||||
|---|---|---|---|---|---|---|---|---|
| Party | Candidate | Votes | % | ±% | ||||
| Liberal | Ron Irwin | 21,407 | 52.91 | +20.91 | ||||
| New Democratic | Steve Butland | 8,970 | 22.17 | -13.11 | ||||
| Reform | Paul Mathewson | 6,566 | 16.23 | +16.23 | ||||
| Progressive Conservative | Gerry Nori | 3,152 | 7.79 | -24.93 | ||||
| National | Henry A. Roess | 209 | 0.52 | |||||
| Natural Law | Chris Evans | 155 | 0.38 | |||||
| Total | 40,459 | 100.00 | ||||||
| 1988 Canadian federal election | ||||||||
|---|---|---|---|---|---|---|---|---|
| Party | Candidate | Votes | % | ±% | ||||
| New Democratic | Steve Butland | 14,595 | 35.28 | +3.76 | ||||
| Progressive Conservative | Jim Kelleher | 13,533 | 32.72 | -5.88 | ||||
| Liberal | Joe Sniezek | 13,237 | 32.00 | +2.70 | ||||
| Total | 41,365 | 100.00 | ||||||
| 1984 Canadian federal election | ||||||||
|---|---|---|---|---|---|---|---|---|
| Party | Candidate | Votes | % | ±% | ||||
| Progressive Conservative | Jim Kelleher | 13,135 | 38.60 | +25.68 | ||||
| New Democratic | Karl Morin-Strom | 10,726 | 31.52 | -7.42 | ||||
| Liberal | Ron Irwin | 9,972 | 29.30 | -18.66 | ||||
| Commonwealth of Canada | Charles L. Rooney | 198 | 0.58 | |||||
| Total | 34,031 | 100.00 | ||||||
| 1980 Canadian federal election | ||||||||
|---|---|---|---|---|---|---|---|---|
| Party | Candidate | Votes | % | ±% | ||||
| Liberal | Ron Irwin | 15,449 | 47.96 | +12.29 | ||||
| New Democratic | Cyril Symes | 12,542 | 38.94 | +1.68 | ||||
| Progressive Conservative | Penny Hanson | 4,161 | 12.92 | -13.79 | ||||
| Marxist–Leninist | Mike Taffarel | 59 | 0.18 | +0.06 | ||||
| Total | 32,211 | 100.00 | ||||||
| 1979 Canadian federal election | ||||||||
|---|---|---|---|---|---|---|---|---|
| Party | Candidate | Votes | % | ±% | ||||
| New Democratic | Cyril Symes | 12,089 | 37.26 | -13.24 | ||||
| Liberal | Terry Murphy | 11,574 | 35.67 | -5.41 | ||||
| Progressive Conservative | Gord Cunningham | 8,668 | 26.71 | +18.49 | ||||
| Communist | Richard Orlandini | 79 | 0.24 | +0.04 | ||||
| Marxist–Leninist | Mike Taffarel | 38 | 0.12 | |||||
| Total | 32,448 | 100.00 | ||||||
| 1974 Canadian federal election | ||||||||
|---|---|---|---|---|---|---|---|---|
| Party | Candidate | Votes | % | ±% | ||||
| New Democratic | Cyril Symes | 19,044 | 50.50 | +13.79 | ||||
| Liberal | Alex Sinclair | 15,490 | 41.08 | +5.12 | ||||
| Progressive Conservative | Bob de Fazio | 3,098 | 8.22 | -19.10 | ||||
| Communist | Gerrit van Houten | 76 | 0.20 | |||||
| Total | 37,708 | 100.00 | ||||||
| 1972 Canadian federal election | ||||||||
|---|---|---|---|---|---|---|---|---|
| Party | Candidate | Votes | % | ±% | ||||
| New Democratic | Cyril Symes | 12,903 | 36.71 | +13.51 | ||||
| Liberal | C. Terrence Murphy | 12,639 | 35.96 | -3.87 | ||||
| Progressive Conservative | L.B. Lou Lukenda | 9,603 | 27.32 | -9.34 | ||||
| Total | 35,145 | 100.00 | ||||||
| 1968 Canadian federal election | ||||||||
|---|---|---|---|---|---|---|---|---|
| Party | Candidate | Votes | % | |||||
| Liberal | C. Terrence Murphy | 12,527 | 39.83 | |||||
| Progressive Conservative | Russ Ramsay | 11,529 | 36.66 | |||||
| New Democratic | Anne Valentine | 7,297 | 23.20 | |||||
| Independent | George Skov | 102 | 0.32 | |||||
| Total | 31,455 | 100.00 | ||||||
References
- "(Code 35079) Census Profile". 2011 census. Statistics Canada. 2012. Retrieved 2011-03-03.
- Sault Ste. Marie riding from Elections Canada
- 1966-1987 Riding history from the Library of Parliament
- 1987-2008 Riding history from the Library of Parliament
- 2011 results from Elections Canada
- Campaign expense data from Elections Canada
- StatsCan District Profile
Notes
- Statistics Canada: 2011
- Statistics Canada: 2011
- Elections Canada
- "List of confirmed candidates". Elections Canada. Retrieved October 4, 2019.
- "Election Night Results". Elections Canada. Retrieved October 30, 2019.
- "October 19, 2015 Election Results — Sault Ste. Marie (Validated results)". Elections Canada. 21 October 2015.
- "Financial Reports: Candidate's Electoral Campaign Return". Elections Canada. 2 May 2016.
- Pundits' Guide to Canadian Elections
- Elections Canada – Official voting results, Forty-first general election, 2011
- Elections Canada – Candidate's electoral campaign return, 41st general election
.png.webp)