1880 United States presidential election in Tennessee
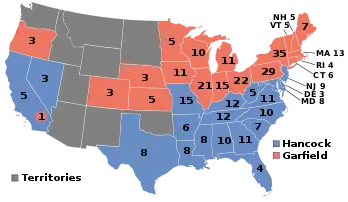
The 1880 United States presidential election in Tennessee took place on November 2, 1880, as part of the 1880 United States presidential election. Tennessee voters chose 12 representatives, or electors, to the Electoral College, who voted for president and vice president.[2]
| ||||||||||||||||||||||||||
| Turnout | 15.77% of the total population | |||||||||||||||||||||||||
|---|---|---|---|---|---|---|---|---|---|---|---|---|---|---|---|---|---|---|---|---|---|---|---|---|---|---|
| ||||||||||||||||||||||||||
| ||||||||||||||||||||||||||
| Elections in Tennessee |
|---|
 |
|
|
Background and vote
For over a century after the Civil War, Tennessee’s white citizenry was divided according to partisan loyalties established in that war. Unionist regions covering almost all of East Tennessee, Kentucky Pennyroyal-allied Macon County, and the five West Tennessee Highland Rim counties of Carroll, Henderson, McNairy, Hardin and Wayne[3] voted Republican – generally by landslide margins – as they saw the Democratic Party as the “war party” who had forced them into a war they did not wish to fight.[4] Contrariwise, the rest of Middle and West Tennessee who had supported and driven the state’s secession was equally fiercely Democratic as it associated the Republicans with Reconstruction.[5]
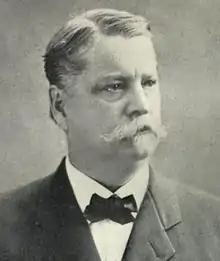
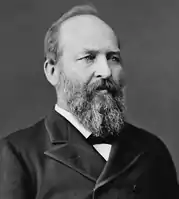
In 1868, Ulysses S. Grant easily carried the state due to disfranchisement of former confederates and the Ku Klux Klan Act.[6] However, in the year after that election, Tennessee was the first state where Reconstruction was ended, and with the aid of the resurgent Klan, white Democrats (“Conservatives”) rewrote the state’s constitution to regain some of their lost power.[7] Nevertheless, blacks and Unionist whites forged adequate support for the GOP to create a competitive political system during that decade,[8] although the Democratic Party won all statewide elections. However, at the beginning of the 1880s, a divide in the Democratic Party on this issue of payment of state debt allowed the GOP to claim the governor’s mansion,[8] but this did not seriously alter presidential voting and Tennessee was won by General Winfield Scott Hancock (D–Pennsylvania), running with former Representative William Hayden English, with 53.26 percent of the popular vote, against Representative James A. Garfield (R-Ohio), running with the 10th chairman of the New York State Republican Executive Committee Chester A. Arthur, with 44.26 percent of the vote.[2]
This would be the last time a Democratic presidential candidate carried Unionist Pennyroyal Macon County until Bill Clinton in 1992.[9]
Results
| 1880 United States presidential election in Tennessee[2] | ||||||||
|---|---|---|---|---|---|---|---|---|
| Party | Candidate | Running mate | Popular vote | Electoral vote | ||||
| Count | % | Count | % | |||||
| Democratic | Winfield Scott Hancock of Pennsylvania | William Hayden English of Indiana | 129,569 | 53.26% | 12 | 100.00% | ||
| Republican | James A. Garfield of Ohio | Chester A. Arthur of New York | 107,677 | 44.26% | 0 | 0.00% | ||
| Greenback | James B. Weaver of Iowa | Barzillai J. Chambers of Texas | 6,017 | 2.47% | 0 | 0.00% | ||
| Total | 243,263 | 100.00% | 12 | 100.00% | ||||
Results by county
| County | Winfield Scott Hancock[10] Democratic |
James Abram Garfield[10] Republican |
James Baird Weaver[11] Greenback |
Margin | Total votes cast | ||||
|---|---|---|---|---|---|---|---|---|---|
| # | % | # | % | # | % | # | % | ||
| Anderson | 574 | 35.17% | 1,058 | 64.83% | 0 | 0.00% | -484 | -29.66% | 1,632 |
| Bedford | 2,504 | 56.82% | 1,766 | 40.07% | 137 | 3.11% | 738 | 16.75% | 4,407 |
| Benton | 771 | 56.98% | 383 | 28.31% | 199 | 14.71% | 388 | 28.68% | 1,353 |
| Bledsoe | 372 | 42.91% | 484 | 55.82% | 11 | 1.27% | -112 | -12.92% | 867 |
| Blount | 882 | 35.58% | 1,597 | 64.42% | 0 | 0.00% | -715 | -28.84% | 2,479 |
| Bradley | 665 | 38.26% | 932 | 53.62% | 141 | 8.11% | -267 | -15.36% | 1,738 |
| Campbell | 314 | 23.22% | 1,038 | 76.78% | 0 | 0.00% | -724 | -53.55% | 1,352 |
| Cannon | 1,035 | 67.74% | 300 | 19.63% | 193 | 12.63% | 735 | 48.10% | 1,528 |
| Carroll | 1,820 | 44.91% | 2,208 | 54.48% | 25 | 0.62% | -388 | -9.57% | 4,053 |
| Carter | 405 | 19.77% | 1,644 | 80.23% | 0 | 0.00% | -1,239 | -60.47% | 2,049 |
| Cheatham | 794 | 67.81% | 291 | 24.85% | 86 | 7.34% | 503 | 42.95% | 1,171 |
| Claiborne | 967 | 44.38% | 1,212 | 55.62% | 0 | 0.00% | -245 | -11.24% | 2,179 |
| Clay | 567 | 63.57% | 177 | 19.84% | 148 | 16.59% | 390 | 43.72% | 892 |
| Cocke | 906 | 36.04% | 1,608 | 63.96% | 0 | 0.00% | -702 | -27.92% | 2,514 |
| Coffee | 1,766 | 84.94% | 198 | 9.52% | 115 | 5.53% | 1,568 | 75.42% | 2,079 |
| Cumberland | 287 | 42.33% | 371 | 54.72% | 20 | 2.95% | -84 | -12.39% | 678 |
| Davidson | 7,543 | 52.24% | 6,449 | 44.66% | 448 | 3.10% | 1,094 | 7.58% | 14,440 |
| DeKalb | 1,325 | 60.45% | 867 | 39.55% | 0 | 0.00% | 458 | 20.89% | 2,192 |
| Decatur | 753 | 59.90% | 413 | 32.86% | 91 | 7.24% | 340 | 27.05% | 1,257 |
| Dickson | 1,169 | 62.58% | 497 | 26.61% | 202 | 10.81% | 672 | 35.97% | 1,868 |
| Dyer | 1,060 | 67.39% | 248 | 15.77% | 265 | 16.85% | 795[lower-alpha 1] | 50.54% | 1,573 |
| Fayette | 2,247 | 42.17% | 3,082 | 57.83% | 0 | 0.00% | -835 | -15.67% | 5,329 |
| Fentress | 314 | 38.06% | 511 | 61.94% | 0 | 0.00% | -197 | -23.88% | 825 |
| Franklin | 2,187 | 85.43% | 357 | 13.95% | 16 | 0.63% | 1,830 | 71.48% | 2,560 |
| Gibson | 2,691 | 61.28% | 1,700 | 38.72% | 0 | 0.00% | 991 | 22.57% | 4,391 |
| Giles | 2,899 | 57.80% | 2,040 | 40.67% | 77 | 1.54% | 859 | 17.13% | 5,016 |
| Grainger | 870 | 41.39% | 1,197 | 56.95% | 35 | 1.67% | -327 | -15.56% | 2,102 |
| Greene | 2,060 | 45.74% | 2,303 | 51.13% | 141 | 3.13% | -243 | -5.40% | 4,504 |
| Grundy | 461 | 87.98% | 63 | 12.02% | 0 | 0.00% | 398 | 75.95% | 524 |
| Hamblen | 848 | 43.38% | 1,095 | 56.01% | 12 | 0.61% | -247 | -12.63% | 1,955 |
| Hamilton | 1,595 | 38.23% | 2,460 | 58.96% | 117 | 2.80% | -865 | -20.73% | 4,172 |
| Hancock | 493 | 34.21% | 948 | 65.79% | 0 | 0.00% | -455 | -31.58% | 1,441 |
| Hardeman | 1,566 | 49.56% | 1,409 | 44.59% | 185 | 5.85% | 157 | 4.97% | 3,160 |
| Hardin | 972 | 41.84% | 1,345 | 57.90% | 6 | 0.26% | -373 | -16.06% | 2,323 |
| Hawkins | 1,039 | 28.97% | 1,907 | 53.18% | 640 | 17.85% | -868 | -24.21% | 3,586 |
| Haywood | 1,766 | 32.38% | 3,557 | 65.22% | 131 | 2.40% | -1,791 | -32.84% | 5,454 |
| Henderson | 1,274 | 46.23% | 1,385 | 50.25% | 97 | 3.52% | -111 | -4.03% | 2,756 |
| Henry | 2,305 | 66.18% | 1,013 | 29.08% | 165 | 4.74% | 1,292 | 37.09% | 3,483 |
| Hickman | 1,157 | 71.82% | 392 | 24.33% | 62 | 3.85% | 765 | 47.49% | 1,611 |
| Houston | 522 | 80.43% | 127 | 19.57% | 0 | 0.00% | 395 | 60.86% | 649 |
| Humphreys | 1,325 | 80.69% | 245 | 14.92% | 72 | 4.38% | 1,080 | 65.77% | 1,642 |
| Jackson | 1,299 | 88.85% | 136 | 9.30% | 27 | 1.85% | 1,163 | 79.55% | 1,462 |
| James | 209 | 32.86% | 403 | 63.36% | 24 | 3.77% | -194 | -30.50% | 636 |
| Jefferson | 693 | 27.33% | 1,807 | 71.25% | 36 | 1.42% | -1,114 | -43.93% | 2,536 |
| Johnson | 203 | 15.68% | 1,092 | 84.32% | 0 | 0.00% | -889 | -68.65% | 1,295 |
| Knox | 3,119 | 41.61% | 4,361 | 58.18% | 16 | 0.21% | -1,242 | -16.57% | 7,496 |
| Lake | 337 | 84.46% | 28 | 7.02% | 34 | 8.52% | 303[lower-alpha 1] | 75.94% | 399 |
| Lauderdale | 1,147 | 52.02% | 971 | 44.04% | 87 | 3.95% | 176 | 7.98% | 2,205 |
| Lawrence | 928 | 71.94% | 362 | 28.06% | 0 | 0.00% | 566 | 43.88% | 1,290 |
| Lewis | 200 | 84.03% | 37 | 15.55% | 1 | 0.42% | 163 | 68.49% | 238 |
| Lincoln | 3,652 | 78.84% | 886 | 19.13% | 94 | 2.03% | 2,766 | 59.72% | 4,632 |
| Loudon | 533 | 34.30% | 1,021 | 65.70% | 0 | 0.00% | -488 | -31.40% | 1,554 |
| Macon | 713 | 54.59% | 559 | 42.80% | 34 | 2.60% | 154 | 11.79% | 1,306 |
| Madison | 2,834 | 54.36% | 2,223 | 42.64% | 156 | 2.99% | 611 | 11.72% | 5,213 |
| Marion | 740 | 45.51% | 886 | 54.49% | 0 | 0.00% | -146 | -8.98% | 1,626 |
| Marshall | 2,006 | 76.04% | 548 | 20.77% | 84 | 3.18% | 1,458 | 55.27% | 2,638 |
| Maury | 3,306 | 54.66% | 2,742 | 45.34% | 0 | 0.00% | 564 | 9.33% | 6,048 |
| McMinn | 1,209 | 45.25% | 1,463 | 54.75% | 0 | 0.00% | -254 | -9.51% | 2,672 |
| McNairy | 1,135 | 46.65% | 949 | 39.01% | 349 | 14.34% | 186 | 7.64% | 2,433 |
| Meigs | 607 | 60.58% | 395 | 39.42% | 0 | 0.00% | 212 | 21.16% | 1,002 |
| Monroe | 1,181 | 56.18% | 919 | 43.72% | 2 | 0.10% | 262 | 12.46% | 2,102 |
| Montgomery | 2,846 | 58.26% | 2,039 | 41.74% | 0 | 0.00% | 807 | 16.52% | 4,885 |
| Morgan | 245 | 36.08% | 434 | 63.92% | 0 | 0.00% | -189 | -27.84% | 679 |
| Obion | 1,982 | 71.22% | 583 | 20.95% | 218 | 7.83% | 1,399 | 50.27% | 2,783 |
| Overton | 1,152 | 72.59% | 430 | 27.10% | 5 | 0.32% | 722 | 45.49% | 1,587 |
| Perry | 604 | 73.04% | 223 | 26.96% | 0 | 0.00% | 381 | 46.07% | 827 |
| Polk | 653 | 64.02% | 362 | 35.49% | 5 | 0.49% | 291 | 28.53% | 1,020 |
| Putnam | 1,040 | 68.92% | 467 | 30.95% | 2 | 0.13% | 573 | 37.97% | 1,509 |
| Rhea | 668 | 61.00% | 427 | 39.00% | 0 | 0.00% | 241 | 22.01% | 1,095 |
| Roane | 805 | 33.02% | 1,628 | 66.78% | 5 | 0.21% | -823 | -33.76% | 2,438 |
| Robertson | 2,107 | 67.55% | 951 | 30.49% | 61 | 1.96% | 1,156 | 37.06% | 3,119 |
| Rutherford | 3,855 | 60.10% | 2,482 | 38.70% | 77 | 1.20% | 1,373 | 21.41% | 6,414 |
| Scott | 127 | 17.91% | 582 | 82.09% | 0 | 0.00% | -455 | -64.17% | 709 |
| Sequatchie | 224 | 64.93% | 119 | 34.49% | 2 | 0.58% | 105 | 30.43% | 345 |
| Sevier | 431 | 17.36% | 2,052 | 82.64% | 0 | 0.00% | -1,621 | -65.28% | 2,483 |
| Shelby | 6,927 | 46.24% | 7,788 | 51.99% | 264 | 1.76% | -861 | -5.75% | 14,979 |
| Smith | 1,569 | 62.16% | 705 | 27.93% | 250 | 9.90% | 864 | 34.23% | 2,524 |
| Stewart | 1,322 | 71.58% | 488 | 26.42% | 37 | 2.00% | 834 | 45.15% | 1,847 |
| Sullivan | 2,264 | 65.23% | 1,207 | 34.77% | 0 | 0.00% | 1,057 | 30.45% | 3,471 |
| Sumner | 2,893 | 72.60% | 1,092 | 27.40% | 0 | 0.00% | 1,801 | 45.19% | 3,985 |
| Tipton | 1,893 | 53.78% | 1,604 | 45.57% | 23 | 0.65% | 289 | 8.21% | 3,520 |
| Trousdale | 793 | 76.25% | 247 | 23.75% | 0 | 0.00% | 546 | 52.50% | 1,040 |
| Union | 480 | 29.63% | 1,140 | 70.37% | 0 | 0.00% | -660 | -40.74% | 1,620 |
| Van Buren | 281 | 82.40% | 60 | 17.60% | 0 | 0.00% | 221 | 64.81% | 341 |
| Warren | 1,577 | 73.52% | 482 | 22.47% | 86 | 4.01% | 1,095 | 51.05% | 2,145 |
| Washington | 1,576 | 42.83% | 2,104 | 57.17% | 0 | 0.00% | -528 | -14.35% | 3,680 |
| Wayne | 649 | 41.76% | 905 | 58.24% | 0 | 0.00% | -256 | -16.47% | 1,554 |
| Weakley | 2,526 | 63.21% | 1,470 | 36.79% | 0 | 0.00% | 1,056 | 26.43% | 3,996 |
| White | 1,308 | 84.01% | 173 | 11.11% | 76 | 4.88% | 1,135 | 72.90% | 1,557 |
| Williamson | 2,733 | 63.94% | 1,541 | 36.06% | 0 | 0.00% | 1,192 | 27.89% | 4,274 |
| Wilson | 2,918 | 68.34% | 1,227 | 28.74% | 125 | 2.93% | 1,691 | 39.60% | 4,270 |
| Totals | 129,569 | 53.26% | 107,677 | 44.26% | 6,017 | 2.47% | 21,892 | 9.00% | 243,263 |
Notes
- In this county where Weaver ran second ahead of Garfield, margin given is Hancock vote minus Weaver vote and percentage margin Hancock percentage minus Weaver percentage.
References
- "1880 Presidential Election Results Tennessee Total Population Turnout".
- "1880 Presidential Election Results Tennessee".
- Wright, John K.; ‘Voting Habits in the United States: A Note on Two Maps’; Geographical Review, vol. 22, no. 4 (October 1932), pp. 666-672
- Key (Jr.), Valdimer Orlando; Southern Politics in State and Nation (New York, 1949), pp. 282-283
- Lyons, William; Scheb (II), John M. and Stair Billy; Government and Politics in Tennessee, pp. 183-184 ISBN 1572331410
- Bergeron, Paul H.; Ash, Stephen V. and Keith, Jeanette; Tennesseans and Their History, p. 175 ISBN 1572330562
- Bergeron; Ash, and Keith; Tennesseans and Their History, pp. 176-178
- Kousser, J. Morgan; The Shaping of Southern Politics: Suffrage Restriction and the Establishment of the One-Party South, 1880-1910, p. 104 ISBN 0-300-01973-4
- Menendez, Albert J.; The Geography of Presidential Elections in the United States, 1868-2004, pp. 298-304 ISBN 0786422173
- Géoelections; Presidential election of 1880 Popular Vote (.xlsx file for €15)
- Géoelections; Presidential election of 1880 Popular Vote for James B. Weaver (.xlsx file for €15)


