2000 United States presidential election in Pennsylvania
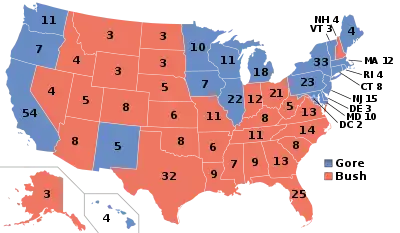
The 2000 United States presidential election in Pennsylvania took place on November 7, 2000, and was part of the 2000 United States presidential election. Voters chose 23 representatives, or electors to the Electoral College, who voted for president and vice president.
| ||||||||||||||||||||||||||
| ||||||||||||||||||||||||||
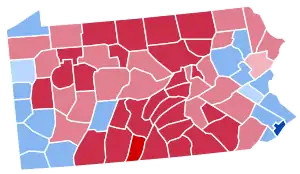 County Results
| ||||||||||||||||||||||||||
| ||||||||||||||||||||||||||

| Elections in Pennsylvania |
|---|
 |
Pennsylvania was won by Vice President Al Gore by a 4.17% margin of victory. However, voter enthusiasm for both candidates was generally low throughout the campaign. Gore failed to capture Clinton's appeal in strongly Democratic regions such as Pittsburgh and Scranton, and thus carried these areas by a smaller number than his predecessor. However, opposition to George W. Bush was particularly strong in the suburban counties of Philadelphia; although these areas at the time were typically Republican leaning, they featured a strong culturally liberal bent, and thus Bush was unable to appeal to voters. Bush support was particularly strong in rural, central Pennsylvania, where the Texas Governor appealed to Evangelical voters and where Gore's connection to gun control policies was strongly rejected. Marginal wins in both of the state's metropolitan areas helped the Vice President to capture the state.[1] This was the first election since 1968 that the candidate who won Pennsylvania did not win the general election, and only the fourth time that has happened since 1916. As of the 2020 presidential election, this is the last election in which Greene County, Mercer County, and Lawrence County voted for the Democratic candidate.
Bush became the first Republican ever to win the White House without carrying Delaware County, and the first to win the White House without carrying Montgomery County since Rutherford Hayes in 1876.
Primaries
Democratic Primary
| Candidates | Votes | Percent |
| Al Gore Jr. | 525,306 | 74.60% |
| Bill Bradley | 146,797 | 20.85% |
| Lyndon LaRouche | 32,047 | 4.55% |
| Totals | 704,150 | Turnout: 19.38% |
Republican Primary
| Candidates | Votes | Percent |
| George W. Bush | 472,008 | 73.44% |
| John S. McCain III | 145,719 | 22.67% |
| Others | 24,967 | 3.88% |
| Totals | 642,694 | Turnout: 20.33% |
Electors
The electors of each state and the District of Columbia met on December 18, 2000[2] to cast their votes for president and vice president. The Electoral College itself never meets as one body. Instead the electors from each state and the District of Columbia met in their respective capitols.
The following were the members of the Electoral College from the state. All were pledged to and voted for Al Gore and Joe Lieberman:[3]
- Kathy Black
- Richard W. Bloomingdale
- Robert P. Casey Jr.
- Nelson Diaz
- William M. George
- Ken Jarin
- James J. Johnston
- Edward Keller
- Robert Mellow
- Thomas J. Murphy, Jr.
- Elsa Favila
- Robert O'Connor
- Lazar M. Palnick
- Stephen R. Reed
- T. J. Rooney
- Joyce Savocchio
- John F. Street
- Patsy J. Tallarico
- Christine M. Tartaglione
- Margaret M. Tartaglione
- Marian Tasco
- Sala Udin
- Anna Verna
Results
| 2000 United States presidential election in Pennsylvania[4] | |||||
|---|---|---|---|---|---|
| Party | Candidate | Votes | Percentage | Electoral votes | |
| Democratic | Al Gore | 2,485,967 | 50.60% | 23 | |
| Republican | George W. Bush | 2,281,127 | 46.43% | 0 | |
| Green | Ralph Nader | 103,392 | 2.10% | 0 | |
| Reform | Pat Buchanan | 16,023 | 0.33% | 0 | |
| Constitution | Howard Phillips | 14,428 | 0.29% | 0 | |
| Libertarian | Harry Browne | 11,248 | 0.23% | 0 | |
| Write-ins | - | 934 | 0.02% | 0 | |
| Totals | 4,913,119 | 100.00% | 23 | ||
| Voter turnout (Voting age/Registered) | 53%/63% | ||||
By county
| County[5] | Albert Arnold Gore Jr. Democratic |
George Walker Bush Republican |
Ralph Nader Green |
Patrick Joseph Buchanan Reform |
Howard Jay Phillips Constitution |
Harry Edson Browne Libertarian |
Margin | Total votes cast | |||||||
|---|---|---|---|---|---|---|---|---|---|---|---|---|---|---|---|
| # | % | # | % | # | % | # | % | # | % | # | % | # | % | ||
| Adams | 11,682 | 34.94% | 20,848 | 62.36% | 696 | 2.08% | 108 | 0.32% | 27 | 0.08% | 72 | 0.22% | -9,166 | -27.42% | 33,433 |
| Allegheny | 329,963 | 56.65% | 235,361 | 40.41% | 10,575 | 1.82% | 2,112 | 0.36% | 3,522 | 0.60% | 945 | 0.16% | 94,602 | 16.24% | 582,478 |
| Armstrong | 11,127 | 40.58% | 15,508 | 56.55% | 485 | 1.77% | 242 | 0.88% | 31 | 0.11% | 30 | 0.11% | -4,381 | -15.98% | 27,423 |
| Beaver | 38,925 | 52.89% | 32,491 | 44.15% | 1,450 | 1.97% | 470 | 0.64% | 104 | 0.14% | 153 | 0.21% | 6,434 | 8.74% | 73,593 |
| Bedford | 5,474 | 28.17% | 13,598 | 69.97% | 265 | 1.36% | 71 | 0.37% | 8 | 0.04% | 19 | 0.10% | -8,124 | -41.80% | 19,435 |
| Berks | 59,150 | 43.76% | 71,273 | 52.73% | 3,494 | 2.59% | 439 | 0.32% | 125 | 0.09% | 682 | 0.50% | -12,123 | -8.97% | 135,163 |
| Blair | 15,774 | 34.94% | 28,376 | 62.86% | 693 | 1.54% | 147 | 0.33% | 76 | 0.17% | 74 | 0.16% | -12,602 | -27.92% | 45,140 |
| Bradford | 7,911 | 33.91% | 14,660 | 62.84% | 600 | 2.57% | 89 | 0.38% | 22 | 0.09% | 48 | 0.21% | -6,749 | -28.93% | 23,330 |
| Bucks | 132,914 | 50.46% | 121,927 | 46.29% | 6,294 | 2.39% | 601 | 0.23% | 669 | 0.25% | 1,017 | 0.39% | 10,987 | 4.17% | 263,422 |
| Butler | 25,037 | 35.35% | 44,009 | 62.14% | 1,287 | 1.82% | 316 | 0.45% | 50 | 0.07% | 125 | 0.18% | -18,972 | -26.79% | 70,824 |
| Cambria | 30,308 | 50.27% | 28,001 | 46.45% | 1,369 | 2.27% | 350 | 0.58% | 170 | 0.28% | 88 | 0.15% | 2,307 | 3.83% | 60,286 |
| Cameron | 779 | 34.68% | 1,383 | 61.58% | 50 | 2.23% | 26 | 1.16% | 5 | 0.22% | 3 | 0.13% | -604 | -26.89% | 2,246 |
| Carbon | 10,668 | 50.14% | 9,717 | 45.67% | 574 | 2.70% | 90 | 0.42% | 187 | 0.88% | 41 | 0.19% | 951 | 4.47% | 21,277 |
| Centre | 21,409 | 43.22% | 26,172 | 52.83% | 1,623 | 3.28% | 147 | 0.30% | 39 | 0.08% | 148 | 0.30% | -4,763 | -9.61% | 49,538 |
| Chester | 82,047 | 43.74% | 100,080 | 53.36% | 4,302 | 2.29% | 314 | 0.17% | 103 | 0.05% | 716 | 0.38% | -18,033 | -9.61% | 187,562 |
| Clarion | 5,605 | 35.38% | 9,796 | 61.83% | 293 | 1.85% | 102 | 0.64% | 16 | 0.10% | 31 | 0.20% | -4,191 | -26.45% | 15,843 |
| Clearfield | 11,718 | 38.28% | 18,019 | 58.87% | 570 | 1.86% | 233 | 0.76% | 26 | 0.08% | 43 | 0.14% | -6,301 | -20.59% | 30,609 |
| Clinton | 5,521 | 46.03% | 6,064 | 50.56% | 307 | 2.56% | 43 | 0.36% | 46 | 0.38% | 13 | 0.11% | -543 | -4.53% | 11,994 |
| Columbia | 8,975 | 40.99% | 12,095 | 55.24% | 663 | 3.03% | 91 | 0.42% | 21 | 0.10% | 49 | 0.22% | -3,120 | -14.25% | 21,894 |
| Crawford | 13,250 | 39.76% | 18,858 | 56.59% | 854 | 2.56% | 130 | 0.39% | 155 | 0.47% | 74 | 0.22% | -5,608 | -16.83% | 33,321 |
| Cumberland | 31,053 | 35.26% | 54,802 | 62.23% | 1,749 | 1.99% | 189 | 0.21% | 47 | 0.05% | 222 | 0.25% | -23,749 | -26.97% | 88,062 |
| Dauphin | 44,390 | 44.10% | 53,631 | 53.28% | 2,059 | 2.05% | 255 | 0.25% | 102 | 0.10% | 221 | 0.22% | -9,241 | -9.18% | 100,658 |
| Delaware | 134,861 | 54.36% | 105,836 | 42.66% | 5,348 | 2.16% | 587 | 0.24% | 702 | 0.28% | 743 | 0.30% | 29,025 | 11.70% | 248,077 |
| Elk | 5,754 | 42.38% | 7,347 | 54.11% | 352 | 2.59% | 90 | 0.66% | 18 | 0.13% | 17 | 0.13% | -1,593 | -11.73% | 13,578 |
| Erie | 59,399 | 52.88% | 49,027 | 43.64% | 2,980 | 2.65% | 238 | 0.21% | 449 | 0.40% | 242 | 0.22% | 10,372 | 9.23% | 112,335 |
| Fayette | 28,152 | 56.84% | 20,013 | 40.40% | 798 | 1.61% | 286 | 0.58% | 225 | 0.45% | 58 | 0.12% | 8,139 | 16.43% | 49,532 |
| Forest | 843 | 36.93% | 1,371 | 60.05% | 57 | 2.50% | 9 | 0.39% | 1 | 0.04% | 2 | 0.09% | -528 | -23.13% | 2,283 |
| Franklin | 14,922 | 30.47% | 33,042 | 67.48% | 761 | 1.55% | 132 | 0.27% | 43 | 0.09% | 69 | 0.14% | -18,120 | -37.00% | 48,969 |
| Fulton | 1,425 | 26.96% | 3,753 | 71.01% | 77 | 1.46% | 20 | 0.38% | 1 | 0.02% | 9 | 0.17% | -2,328 | -44.05% | 5,285 |
| Greene | 7,230 | 53.03% | 5,890 | 43.20% | 337 | 2.47% | 120 | 0.88% | 18 | 0.13% | 39 | 0.29% | 1,340 | 9.83% | 13,634 |
| Huntingdon | 5,073 | 31.79% | 10,408 | 65.23% | 340 | 2.13% | 103 | 0.65% | 12 | 0.08% | 21 | 0.13% | -5,335 | -33.43% | 15,957 |
| Indiana | 13,667 | 43.52% | 16,799 | 53.50% | 711 | 2.26% | 161 | 0.51% | 17 | 0.05% | 46 | 0.15% | -3,132 | -9.97% | 31,401 |
| Jefferson | 5,566 | 31.67% | 11,473 | 65.28% | 339 | 1.93% | 120 | 0.68% | 29 | 0.17% | 47 | 0.27% | -5,907 | -33.61% | 17,574 |
| Juniata | 2,656 | 30.64% | 5,795 | 66.86% | 158 | 1.82% | 28 | 0.32% | 9 | 0.10% | 21 | 0.24% | -3,139 | -36.22% | 8,667 |
| Lackawanna | 57,471 | 59.63% | 35,096 | 36.41% | 2,134 | 2.21% | 264 | 0.27% | 1,341 | 1.39% | 75 | 0.08% | 22,375 | 23.22% | 96,381 |
| Lancaster | 54,968 | 31.35% | 115,900 | 66.11% | 3,341 | 1.91% | 389 | 0.22% | 379 | 0.22% | 340 | 0.19% | -60,932 | -34.76% | 175,317 |
| Lawrence | 20,593 | 51.95% | 18,060 | 45.56% | 653 | 1.65% | 257 | 0.65% | 27 | 0.07% | 50 | 0.13% | 2,533 | 6.39% | 39,640 |
| Lebanon | 16,093 | 35.08% | 28,534 | 62.19% | 873 | 1.90% | 135 | 0.29% | 143 | 0.31% | 102 | 0.22% | -12,441 | -27.12% | 45,880 |
| Lehigh | 56,667 | 48.73% | 55,492 | 47.72% | 3,278 | 2.82% | 307 | 0.26% | 214 | 0.18% | 322 | 0.28% | 1,175 | 1.01% | 116,280 |
| Luzerne | 62,199 | 52.01% | 52,328 | 43.76% | 3,456 | 2.89% | 474 | 0.40% | 981 | 0.82% | 148 | 0.12% | 9,871 | 8.25% | 119,586 |
| Lycoming | 14,663 | 33.96% | 27,137 | 62.84% | 965 | 2.23% | 139 | 0.32% | 217 | 0.50% | 62 | 0.14% | -12,474 | -28.89% | 43,183 |
| Mckean | 5,510 | 34.86% | 9,661 | 61.13% | 403 | 2.55% | 64 | 0.40% | 129 | 0.82% | 37 | 0.23% | -4,151 | -26.27% | 15,804 |
| Mercer | 23,817 | 48.88% | 23,132 | 47.47% | 1,073 | 2.20% | 285 | 0.58% | 348 | 0.71% | 70 | 0.14% | 685 | 1.41% | 48,725 |
| Mifflin | 4,835 | 33.08% | 9,400 | 64.32% | 264 | 1.81% | 41 | 0.28% | 49 | 0.34% | 25 | 0.17% | -4,565 | -31.24% | 14,614 |
| Monroe | 21,939 | 46.80% | 23,265 | 49.63% | 1,319 | 2.81% | 123 | 0.26% | 116 | 0.25% | 116 | 0.25% | -1,326 | -2.83% | 46,878 |
| Montgomery | 177,990 | 53.54% | 145,623 | 43.81% | 6,816 | 2.05% | 562 | 0.17% | 200 | 0.06% | 1,231 | 0.37% | 32,367 | 9.74% | 332,422 |
| Montour | 2,356 | 36.29% | 3,960 | 61.00% | 132 | 2.03% | 26 | 0.40% | 8 | 0.12% | 10 | 0.15% | -1,604 | -24.71% | 6,492 |
| Northampton | 53,097 | 50.72% | 47,396 | 45.27% | 3,012 | 2.88% | 324 | 0.31% | 592 | 0.57% | 269 | 0.26% | 5,701 | 5.45% | 104,690 |
| Northumberland | 13,670 | 41.11% | 18,142 | 54.56% | 956 | 2.88% | 329 | 0.99% | 109 | 0.33% | 45 | 0.14% | -4,472 | -13.45% | 33,251 |
| Perry | 4,459 | 27.75% | 11,184 | 69.59% | 309 | 1.92% | 65 | 0.40% | 15 | 0.09% | 39 | 0.24% | -6,725 | -41.85% | 16,071 |
| Philadelphia | 449,182 | 80.04% | 100,959 | 17.99% | 8,206 | 1.46% | 822 | 0.15% | 1,032 | 0.18% | 979 | 0.17% | 348,223 | 62.05% | 561,180 |
| Pike | 7,330 | 42.21% | 9,339 | 53.78% | 498 | 2.87% | 57 | 0.33% | 99 | 0.57% | 41 | 0.24% | -2,009 | -11.57% | 17,364 |
| Potter | 2,037 | 28.73% | 4,858 | 68.52% | 146 | 2.06% | 24 | 0.34% | 7 | 0.10% | 18 | 0.25% | -2,821 | -39.79% | 7,090 |
| Schuylkill | 26,215 | 44.97% | 29,841 | 51.19% | 1,713 | 2.94% | 399 | 0.68% | 40 | 0.07% | 92 | 0.16% | -3,626 | -6.22% | 58,300 |
| Snyder | 3,536 | 27.54% | 8,963 | 69.80% | 271 | 2.11% | 46 | 0.36% | 10 | 0.08% | 15 | 0.12% | -5,427 | -42.26% | 12,841 |
| Somerset | 12,028 | 36.47% | 20,218 | 61.29% | 487 | 1.48% | 181 | 0.55% | 24 | 0.07% | 47 | 0.14% | -8,190 | -24.83% | 32,985 |
| Sullivan | 1,066 | 34.33% | 1,928 | 62.09% | 91 | 2.93% | 10 | 0.32% | 4 | 0.13% | 6 | 0.19% | -862 | -27.76% | 3,105 |
| Susquehanna | 6,481 | 37.53% | 10,226 | 59.21% | 459 | 2.66% | 61 | 0.35% | 12 | 0.07% | 32 | 0.19% | -3,745 | -21.68% | 17,271 |
| Tioga | 4,617 | 31.26% | 9,635 | 65.22% | 404 | 2.73% | 52 | 0.35% | 24 | 0.16% | 40 | 0.27% | -5,018 | -33.97% | 14,772 |
| Union | 4,209 | 31.95% | 8,523 | 64.69% | 373 | 2.83% | 33 | 0.25% | 17 | 0.13% | 20 | 0.15% | -4,314 | -32.74% | 13,175 |
| Venango | 8,196 | 39.94% | 11,642 | 56.73% | 467 | 2.28% | 121 | 0.59% | 55 | 0.27% | 42 | 0.20% | -3,446 | -16.79% | 20,523 |
| Warren | 7,537 | 42.97% | 9,290 | 52.96% | 466 | 2.66% | 87 | 0.50% | 129 | 0.74% | 32 | 0.18% | -1,753 | -9.99% | 17,541 |
| Washington | 44,961 | 53.25% | 37,339 | 44.22% | 1,442 | 1.71% | 528 | 0.63% | 60 | 0.07% | 111 | 0.13% | 7,622 | 9.03% | 84,441 |
| Wayne | 6,904 | 36.50% | 11,201 | 59.22% | 625 | 3.30% | 88 | 0.47% | 63 | 0.33% | 33 | 0.17% | -4,297 | -22.72% | 18,914 |
| Westmoreland | 71,792 | 45.81% | 80,858 | 51.60% | 2,601 | 1.66% | 908 | 0.58% | 323 | 0.21% | 227 | 0.14% | -9,066 | -5.79% | 156,709 |
| Wyoming | 4,363 | 37.31% | 6,922 | 59.20% | 344 | 2.94% | 32 | 0.27% | 6 | 0.05% | 26 | 0.22% | -2,559 | -21.88% | 11,693 |
| York | 51,958 | 36.02% | 87,652 | 60.77% | 3,305 | 2.29% | 331 | 0.23% | 580 | 0.40% | 418 | 0.29% | -35,694 | -24.75% | 144,244 |
| Totals | 2,485,967 | 50.61% | 2,281,127 | 46.44% | 103,392 | 2.10% | 16,023 | 0.33% | 14,428 | 0.29% | 11,248 | 0.23% | 204,840 | 4.17% | 4,912,185 |
By congressional district
Gore won 11 of 21 congressional districts. Gore won 3 that elected Republican representatives while Bush won 2 that elected Democrats.[6]
| District | Bush | Gore | Representative |
|---|---|---|---|
| 1st | 13% | 85% | Bob Brady |
| 2nd | 11% | 88% | Chaka Fattah |
| 3rd | 31% | 66% | Robert Borski |
| 4th | 51% | 47% | Ron Klink |
| Melissa Hart | |||
| 5th | 59% | 38% | John E. Peterson |
| 6th | 53% | 44% | Tim Holden |
| 7th | 47% | 50% | Curt Weldon |
| 8th | 47% | 50% | James C. Greenwood |
| 9th | 65% | 32% | Bud Shuster |
| 10th | 50% | 47% | Don Sherwood |
| 11th | 47% | 49% | Paul Kanjorski |
| 12th | 52% | 45% | John Murtha |
| 13th | 43% | 54% | Joe Hoeffel |
| 14th | 35% | 62% | William J. Coyne |
| 15th | 47% | 49% | Pat Toomey |
| 16th | 58% | 39% | Joe Pitts |
| 17th | 60% | 37% | George Gekas |
| 18th | 41% | 57% | Mike Doyle |
| 19th | 61% | 36% | William F. Goodling |
| Todd Platts | |||
| 20th | 46% | 51% | Frank Mascara |
| 21st | 49% | 48% | Phil English |
References
- https://www.pbs.org/newshour/bb/politics/july-dec00/pennsylvania_10-9.html
- http://uselectionatlas.org/RESULTS/state.php?year=2000&fips=42&f=0&off=0&elect=0
- "Archived copy". Archived from the original on 2012-02-12. Retrieved 2010-06-30.CS1 maint: archived copy as title (link)
- http://uselectionatlas.org/RESULTS/index.html
- "Pennsylvania Elections – County Breakdown Results". electionreturns.pa.gov. November 7, 2000. Retrieved December 28, 2019.
- https://raw.githubusercontent.com/openelections/openelections-data-pa/master/2000/20001107__pa__general__precinct.csv