2000 United States presidential election in Oregon
The 2000 United States presidential election in Oregon was held on Tuesday, November, 7, 2000 as part of the concurrent United States presidential election. Voters chose seven electors, or representatives to the Electoral College, who voted for President and Vice-President.
| |||||||||||||||||||||||||||||||||
| |||||||||||||||||||||||||||||||||
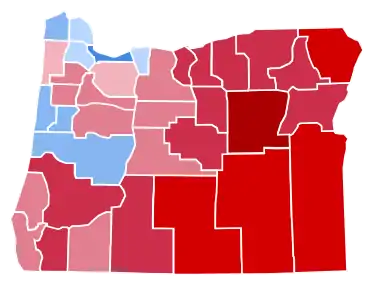
 County Results
| |||||||||||||||||||||||||||||||||
| |||||||||||||||||||||||||||||||||
| Elections in Oregon |
|---|
 |
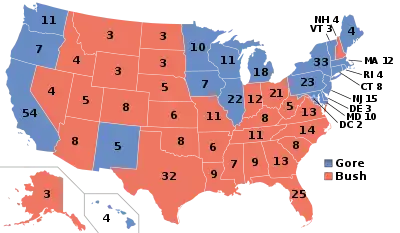
Oregon has been a blue state over recent years, as it has voted for the Democratic Party in every presidential election since 1988 and Democrats have won every statewide election held after 2002. However, in 2000, Gore won by a small margin, partly because of a strong showing by Ralph Nader. Over the next two election cycles, the state would trend Democratic. Almost eighty percent of registered voters came out to vote on election day, the highest in the country. This marks the last time in which the margin of victory in Oregon was within a fraction of a percent, as Democrats would win the state by higher margins since. This is also the last time as of 2020 that the Democrats failed to win a majority in Oregon, while the state would also vote more Republican than the nation as a whole.
Bush became the first Republican ever to win the White House without carrying Washington County.
Results
Official state results from the Oregon Secretary of State are as follows:[1]
| 2000 United States presidential election in Oregon | |||||
|---|---|---|---|---|---|
| Party | Candidate | Votes | Percentage | Electoral votes | |
| Democratic | Al Gore | 720,342 | 46.96% | 7 | |
| Republican | George W. Bush | 713,577 | 46.52% | 0 | |
| Pacific Green | Ralph Nader | 77,357 | 5.04% | 0 | |
| Libertarian | Harry Browne | 7,447 | 0.49% | 0 | |
| Reform | Pat Buchanan | 7,063 | 0.46% | 0 | |
| Write-ins | Write-ins | 3,419 | 0.22% | 0 | |
| Natural Law | John Hagelin | 2,574 | 0.17% | 0 | |
| Constitution | Howard Phillips | 2,189 | 0.14% | 0 | |
| Totals | 1,533,968 | 100.00% | 7 | ||
| Voter turnout (Voting age population) | 64.7% | ||||
Results by county
Official county results from the Oregon Secretary of State are as follows:[1]
| County | Albert Arnold Gore Jr. Democratic |
George Walker Bush Republican |
Ralph Nader Pacific Green |
Various candidates Other parties |
Margin | Total votes cast | |||||
|---|---|---|---|---|---|---|---|---|---|---|---|
| # | % | # | % | # | % | # | % | # | % | ||
| Baker | 2,195 | 26.58% | 5,618 | 68.03% | 289 | 3.50% | 156 | 1.89% | -3,423 | -41.45% | 8,258 |
| Benton | 19,444 | 50.87% | 15,825 | 41.40% | 2,463 | 6.44% | 494 | 1.29% | 3,619 | 9.47% | 38,226 |
| Clackamas | 76,421 | 47.10% | 77,539 | 47.79% | 6,357 | 3.92% | 1,945 | 1.20% | -1,118 | -0.69% | 162,262 |
| Clatsop | 8,296 | 50.36% | 6,950 | 42.19% | 939 | 5.70% | 289 | 1.75% | 1,346 | 8.17% | 16,474 |
| Columbia | 10,331 | 48.74% | 9,369 | 44.20% | 970 | 4.58% | 525 | 2.48% | 962 | 4.54% | 21,195 |
| Coos | 11,610 | 39.52% | 15,626 | 53.19% | 1,410 | 4.80% | 733 | 2.49% | -4,016 | -13.67% | 29,379 |
| Crook | 2,474 | 29.89% | 5,363 | 64.79% | 258 | 3.12% | 182 | 2.20% | -2,889 | -34.90% | 8,277 |
| Curry | 4,090 | 35.53% | 6,551 | 56.90% | 603 | 5.24% | 269 | 2.34% | -2,461 | -21.38% | 11,513 |
| Deschutes | 22,061 | 38.11% | 32,132 | 55.51% | 2,799 | 4.84% | 893 | 1.54% | -10,071 | -17.40% | 57,885 |
| Douglas | 14,193 | 30.06% | 30,294 | 64.16% | 1,768 | 3.74% | 965 | 2.04% | -16,101 | -34.10% | 47,220 |
| Gilliam | 359 | 32.94% | 679 | 62.29% | 37 | 3.39% | 15 | 1.38% | -320 | -29.36% | 1,090 |
| Grant | 589 | 15.31% | 3,078 | 80.03% | 98 | 2.55% | 81 | 2.11% | -2,489 | -64.72% | 3,846 |
| Harney | 766 | 20.51% | 2,799 | 74.96% | 84 | 2.25% | 85 | 2.28% | -2,033 | -54.45% | 3,734 |
| Hood River | 4,072 | 47.63% | 3,721 | 43.53% | 645 | 7.54% | 111 | 1.30% | 351 | 4.11% | 8,549 |
| Jackson | 33,153 | 39.10% | 46,052 | 54.31% | 4,207 | 4.96% | 1,384 | 1.63% | -12,899 | -15.21% | 84,796 |
| Jefferson | 2,681 | 38.87% | 3,838 | 55.65% | 247 | 3.58% | 131 | 1.90% | -1,157 | -16.78% | 6,897 |
| Josephine | 11,864 | 32.30% | 22,186 | 60.40% | 1,783 | 4.85% | 900 | 2.45% | -10,322 | -28.10% | 36,733 |
| Klamath | 7,541 | 27.08% | 18,855 | 67.72% | 867 | 3.11% | 581 | 2.09% | -11,314 | -40.63% | 27,844 |
| Lake | 707 | 18.96% | 2,830 | 75.89% | 108 | 2.90% | 84 | 2.25% | -2,123 | -56.93% | 3,729 |
| Lane | 78,583 | 51.64% | 61,578 | 40.46% | 10,245 | 6.73% | 1,782 | 1.17% | 17,005 | 11.17% | 152,188 |
| Lincoln | 10,861 | 51.43% | 8,446 | 39.99% | 1,435 | 6.80% | 376 | 1.78% | 2,415 | 11.44% | 21,118 |
| Linn | 16,682 | 37.58% | 25,359 | 57.13% | 1,617 | 3.64% | 730 | 1.64% | -8,677 | -19.55% | 44,388 |
| Malheur | 2,336 | 22.45% | 7,624 | 73.27% | 248 | 2.38% | 198 | 1.90% | -5,288 | -50.82% | 10,406 |
| Marion | 49,430 | 43.62% | 57,443 | 50.69% | 4,679 | 4.13% | 1,776 | 1.57% | -8,013 | -7.07% | 113,328 |
| Morrow | 1,197 | 33.17% | 2,224 | 61.62% | 87 | 2.41% | 101 | 2.80% | -1,027 | -28.46% | 3,609 |
| Multnomah | 188,441 | 63.52% | 83,677 | 28.20% | 21,048 | 7.09% | 3,519 | 1.19% | 104,764 | 35.31% | 296,685 |
| Polk | 11,921 | 41.90% | 14,988 | 52.68% | 1,201 | 4.22% | 339 | 1.19% | -3,067 | -10.78% | 28,449 |
| Sherman | 326 | 30.70% | 679 | 63.94% | 36 | 3.39% | 21 | 1.98% | -353 | -33.24% | 1,062 |
| Tillamook | 5,762 | 46.56% | 5,775 | 46.66% | 613 | 4.95% | 226 | 1.83% | -13 | -0.11% | 12,376 |
| Umatilla | 7,809 | 33.86% | 14,140 | 61.32% | 655 | 2.84% | 456 | 1.98% | -6,331 | -27.45% | 23,060 |
| Union | 3,577 | 29.62% | 7,836 | 64.89% | 436 | 3.61% | 227 | 1.88% | -4,259 | -35.27% | 12,076 |
| Wallowa | 836 | 19.47% | 3,279 | 76.36% | 114 | 2.65% | 65 | 1.51% | -2,443 | -56.89% | 4,294 |
| Wasco | 4,616 | 43.29% | 5,356 | 50.23% | 513 | 4.81% | 179 | 1.68% | -740 | -6.94% | 10,664 |
| Washington | 90,662 | 48.75% | 86,091 | 46.29% | 6,985 | 3.76% | 2,236 | 1.20% | 4,571 | 2.46% | 185,974 |
| Wheeler | 202 | 24.02% | 584 | 69.44% | 27 | 3.21% | 28 | 3.33% | -382 | -45.42% | 841 |
| Yamhill | 14,254 | 40.11% | 19,193 | 54.01% | 1,486 | 4.18% | 606 | 1.71% | -4,939 | -13.90% | 35,539 |
| Total | 720,342 | 46.96% | 713,577 | 46.52% | 77,357 | 5.04% | 22,688 | 1.48% | 6,765 | 0.44% | 1,533,964 |
Results by congressional district
Bush won three of Oregon’s five congressional districts.[2]
| District | Gore | Bush | Representative |
|---|---|---|---|
| 1st | 51% | 44% | David Wu |
| 2nd | 35% | 60% | Greg Walden |
| 3rd | 61% | 31% | Earl Blumenauer |
| 4th | 44% | 49% | Peter DeFazio |
| 5th | 46% | 48% | Darlene Hooley |
References
- Elections Division (November 2000). "November 7, 2000 General Election - United States President". Oregon Secretary of State. Retrieved June 11, 2012.
- https://uselectionatlas.org/RESULTS/data.php?year=2000&fips=41&f=0&off=0&elect=0&datatype=cd&def=1


