2000 United States presidential election in Oklahoma
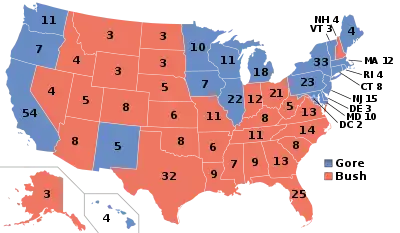
The 2000 United States presidential election in Oklahoma took place on November 7, 2000, and was part of the 2000 United States presidential election. Voters chose 8 representatives, or electors to the Electoral College, who voted for president and vice president.
| ||||||||||||||||||||||||||
| ||||||||||||||||||||||||||
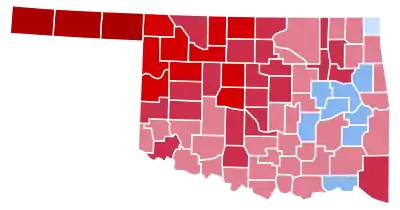 County Results
| ||||||||||||||||||||||||||
| ||||||||||||||||||||||||||
| Elections in Oklahoma |
|---|
 |
|
|
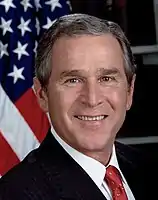
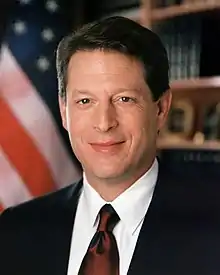
Oklahoma was won by the Republican Party candidate, Texas Governor George W. Bush with a 21.88% margin of victory. Despite Vice President Al Gore's loss in the state, he is the most recent Democrat to win any of its counties in a presidential election, namely Ottawa, Cherokee, Muskogee, Okmulgee, McIntosh, Hughes, Haskell, Latimer, and Choctaw. This was the last election until 2016 that any third-party candidates were granted ballot access in Oklahoma and also the most recent election in which the Democratic nominee won at least one county.
Gore carried Ottawa County by just 22 votes out of 11,411 cast in the county.
Electors
The electors of each state and the District of Columbia met on December 18, 2000[1] to cast their votes for president and vice president. The Electoral College itself never meets as one body. Instead the electors from each state and the District of Columbia met in their respective capitols.
The following were the members of the Electoral College from the state. All were pledged to and voted for George W. Bush and Dick Cheney:[2]
- Steve Byas
- James Cruson
- Paul Hollrah
- Kristal Markowitz
- Bob McDowell
- Donald O'Nesky
- Tom Prince
- George W. Wiland
The slates of electors for the defeated candidates are as follows:
Reform: Robert Kiwanis Bell, Jr., Isabel Faith Lyman, Patrick S. J. Carmack, Ivette P. Farmer, Earl David Shaffer, William Bruce Charles, Gregory D. Brown, Mary Patricia Ziglinski
Democrat: George Nigh, Carma Lee Brock, Edmund Synar, Beulah Vernon, Jay Parmley, Rhonda Walters, Mary Jac Rauh, Obera Bergdall
Libertarian: Charles Burris, Agnes Regier, Christine M. Kane, Mary Laurent, Anne Fruits, Jack Litherland, David Lewis, Lynn Atherton[3]
Results
| 2000 United States presidential election in Oklahoma[4] | |||||
|---|---|---|---|---|---|
| Party | Candidate | Votes | Percentage | Electoral votes | |
| Republican | George W. Bush | 744,337 | 60.31% | 8 | |
| Democratic | Al Gore | 474,276 | 38.43% | 0 | |
| Reform | Pat Buchanan | 9,014 | 0.73% | 0 | |
| Libertarian | Harry Browne | 6,602 | 0.53% | 0 | |
By county
| County | Gore% | Gore# | Bush% | Bush# | Others% | Others# | Total |
|---|---|---|---|---|---|---|---|
| Adair | 39.50% | 2,361 | 58.61% | 3,503 | 1.89% | 113 | 5,977 |
| Alfalfa | 23.25% | 583 | 75.23% | 1,886 | 1.52% | 38 | 2,507 |
| Atoka | 44.08% | 1,906 | 54.93% | 2,375 | .99% | 43 | 4,324 |
| Beaver | 13.80% | 339 | 85.18% | 2,092 | 1.02% | 25 | 2,456 |
| Beckham | 36.86% | 2,408 | 62.26% | 4,067 | .87% | 57 | 6,532 |
| Blaine | 34.25% | 1,402 | 64.31% | 2,633 | 1.44% | 59 | 4,094 |
| Bryan | 47.28% | 5,554 | 51.80% | 6,084 | .92% | 108 | 11,746 |
| Caddo | 46.38% | 4,272 | 52.50% | 4,835 | 1.12% | 103 | 9,210 |
| Canadian | 26.68% | 8,367 | 72.32% | 22,679 | 1.% | 314 | 31,360 |
| Carter | 40.46% | 6,659 | 58.74% | 9,667 | .8% | 132 | 16,458 |
| Cherokee | 50.15% | 7,256 | 47.82% | 6,918 | 2.03% | 294 | 14,468 |
| Choctaw | 52.66% | 2,799 | 46.30% | 2,461 | 1.03% | 55 | 5,315 |
| Cimarron | 15.30% | 227 | 82.88% | 1,230 | 1.82% | 27 | 1,484 |
| Cleveland | 36.49% | 27,792 | 62.22% | 47,393 | 1.29% | 986 | 76,171 |
| Coal | 48.60% | 1,148 | 50.64% | 1,196 | .76% | 18 | 2,362 |
| Comanche | 40.81% | 11,971 | 58.31% | 17,103 | .88% | 259 | 29,333 |
| Cotton | 43.03% | 1,068 | 55.92% | 1,388 | 1.05% | 26 | 2,482 |
| Craig | 46.83% | 2,568 | 51.33% | 2,815 | 1.84% | 101 | 5,484 |
| Creek | 41.08% | 9,753 | 57.20% | 13,580 | 1.72% | 408 | 23,741 |
| Custer | 31.97% | 3,115 | 66.99% | 6,527 | 1.04% | 101 | 9,743 |
| Delaware | 41.29% | 5,514 | 57.05% | 7,618 | 1.66% | 221 | 13,353 |
| Dewey | 26.98% | 599 | 72.39% | 1,607 | .63% | 14 | 2,220 |
| Ellis | 23.25% | 468 | 75.16% | 1,513 | 1.59% | 32 | 2,013 |
| Garfield | 30.18% | 6,543 | 68.73% | 14,902 | 1.1% | 238 | 21,683 |
| Garvin | 42.56% | 4,189 | 56.24% | 5,536 | 1.2% | 118 | 9,843 |
| Grady | 37.09% | 6,037 | 61.69% | 10,040 | 1.22% | 199 | 16,276 |
| Grant | 28.33% | 709 | 70.40% | 1,762 | 1.28% | 32 | 2,503 |
| Greer | 38.99% | 839 | 59.80% | 1,287 | 1.21% | 26 | 2,152 |
| Harmon | 42.07% | 507 | 57.43% | 692 | .5% | 6 | 1,205 |
| Harper | 22.22% | 374 | 77.01% | 1,296 | .77% | 13 | 1,683 |
| Haskell | 54.24% | 2,510 | 44.06% | 2,039 | 1.71% | 79 | 4,628 |
| Hughes | 50.91% | 2,334 | 47.90% | 2,196 | 1.2% | 55 | 4,585 |
| Jackson | 30.82% | 2,515 | 68.53% | 5,591 | .65% | 53 | 8,159 |
| Jefferson | 48.01% | 1,245 | 50.91% | 1,320 | 1.08% | 28 | 2,593 |
| Johnston | 46.03% | 1,809 | 52.72% | 2,072 | 1.25% | 49 | 3,930 |
| Kay | 33.71% | 6,122 | 64.79% | 11,768 | 1.5% | 272 | 18,162 |
| Kingfisher | 21.53% | 1,304 | 77.49% | 4,693 | .97% | 59 | 6,056 |
| Kiowa | 41.17% | 1,544 | 57.95% | 2,173 | .88% | 33 | 3,750 |
| Latimer | 50.83% | 1,865 | 47.40% | 1,739 | 1.77% | 65 | 3,669 |
| Le Flore | 43.62% | 6,536 | 54.82% | 8,215 | 1.56% | 234 | 14,985 |
| Lincoln | 35.38% | 4,140 | 63.13% | 7,387 | 1.49% | 174 | 11,701 |
| Logan | 35.04% | 4,510 | 63.61% | 8,187 | 1.34% | 173 | 12,870 |
| Love | 45.37% | 1,530 | 53.59% | 1,807 | 1.04% | 35 | 3,372 |
| McClain | 34.91% | 3,679 | 64.05% | 6,750 | 1.04% | 110 | 10,539 |
| McCurtain | 35.79% | 3,752 | 62.97% | 6,601 | 1.23% | 129 | 10,482 |
| McIntosh | 54.05% | 4,206 | 44.26% | 3,444 | 1.68% | 131 | 7,781 |
| Major | 18.94% | 635 | 79.71% | 2,672 | 1.34% | 45 | 3,352 |
| Marshall | 45.10% | 2,210 | 53.90% | 2,641 | 1.% | 49 | 4,900 |
| Mayes | 47.27% | 6,618 | 50.94% | 7,132 | 1.79% | 251 | 14,001 |
| Murray | 45.98% | 2,263 | 53.01% | 2,609 | 1.02% | 50 | 4,922 |
| Muskogee | 50.70% | 12,520 | 47.87% | 11,820 | 1.43% | 353 | 24,693 |
| Noble | 30.15% | 1,416 | 68.77% | 3,230 | 1.09% | 51 | 4,697 |
| Nowata | 44.25% | 1,703 | 53.75% | 2,069 | 2.% | 77 | 3,849 |
| Okfuskee | 47.89% | 1,814 | 50.42% | 1,910 | 1.69% | 64 | 3,788 |
| Oklahoma | 36.57% | 81,590 | 62.34% | 139,078 | 1.09% | 2,443 | 223,111 |
| Okmulgee | 54.53% | 7,186 | 43.99% | 5,797 | 1.48% | 195 | 13,178 |
| Osage | 47.39% | 7,540 | 51.15% | 8,138 | 1.45% | 231 | 15,909 |
| Ottawa | 49.49% | 5,647 | 49.29% | 5,625 | 1.22% | 139 | 11,411 |
| Pawnee | 41.10% | 2,435 | 57.15% | 3,386 | 1.76% | 104 | 5,925 |
| Payne | 37.36% | 9,319 | 61.15% | 15,256 | 1.49% | 372 | 24,947 |
| Pittsburg | 46.63% | 7,627 | 52.05% | 8,514 | 1.32% | 216 | 16,357 |
| Pontotoc | 41.97% | 5,387 | 56.86% | 7,299 | 1.17% | 150 | 12,836 |
| Pottawatomie | 39.27% | 8,763 | 59.31% | 13,235 | 1.42% | 318 | 22,316 |
| Pushmataha | 45.29% | 1,969 | 53.61% | 2,331 | 1.1% | 48 | 4,348 |
| Roger Mills | 26.14% | 441 | 73.15% | 1,234 | .71% | 12 | 1,687 |
| Rogers | 37.35% | 10,813 | 61.18% | 17,713 | 1.47% | 425 | 28,951 |
| Seminole | 48.09% | 3,783 | 50.99% | 4,011 | .92% | 72 | 7,866 |
| Sequoyah | 44.27% | 5,425 | 53.97% | 6,614 | 1.75% | 215 | 12,254 |
| Stephens | 36.98% | 6,467 | 62.10% | 10,860 | .92% | 161 | 17,488 |
| Texas | 17.81% | 1,084 | 81.54% | 4,964 | .66% | 40 | 6,088 |
| Tillman | 41.80% | 1,400 | 57.33% | 1,920 | .87% | 29 | 3,349 |
| Tulsa | 37.34% | 81,656 | 61.34% | 134,152 | 1.32% | 2,883 | 218,691 |
| Wagoner | 38.31% | 8,244 | 60.33% | 12,981 | 1.36% | 292 | 21,517 |
| Washington | 32.03% | 6,644 | 66.47% | 13,788 | 1.5% | 312 | 20,744 |
| Washita | 35.00% | 1,564 | 63.79% | 2,850 | 1.21% | 54 | 4,468 |
| Woods | 34.83% | 1,235 | 64.13% | 2,274 | 1.04% | 37 | 3,546 |
| Woodward | 27.46% | 1,950 | 71.37% | 5,067 | 1.17% | 83 | 7,100 |
By congressional district
Bush won all 6 congressional districts.[5]
| District | Bush | Gore | Representative |
|---|---|---|---|
| 1st | 62% | 37% | Steve Largent |
| 2nd | 53% | 46% | Tom Coburn |
| Brad Carson | |||
| 3rd | 56% | 43% | Wes Watkins |
| 4th | 61% | 38% | J. C. Watts |
| 5th | 68% | 31% | Ernest Istook |
| 6th | 61% | 38% | Frank Lucas |
References
- http://uselectionatlas.org/RESULTS/state.php?year=2000&fips=42&f=0&off=0&elect=0
- "Archived copy". Archived from the original on 2012-02-12. Retrieved 2011-05-10.CS1 maint: archived copy as title (link)
- https://uselectionatlas.org/RESULTS/electors.php?year=2000&fips=40&f=0&off=0&elect=0
- http://uselectionatlas.org/RESULTS/index.html
- https://uselectionatlas.org/RESULTS/data.php?year=2000&fips=40&f=0&off=0&elect=0&datatype=cd&def=1