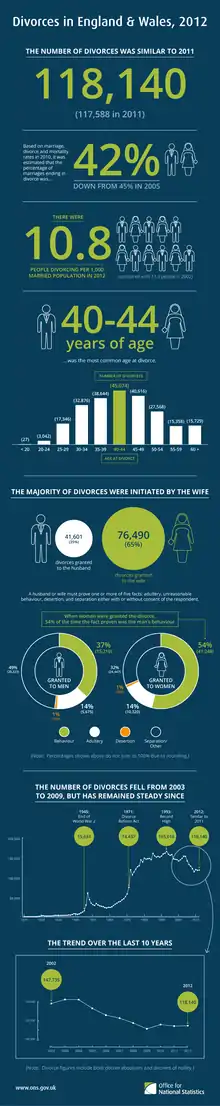
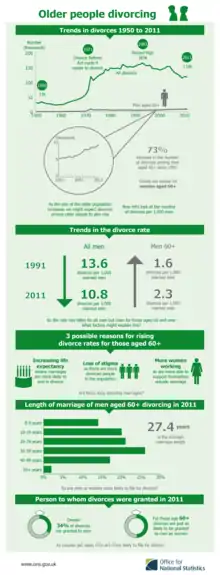
Divorce demography
Divorce demography is the study of the demographic factors that causes divorce.
Divorce statistics by country/region (per 1,000 population / year)
| Country/region | Continent | Crude rate | Ratio | Data Source Year | ||
|---|---|---|---|---|---|---|
| Marriage | Divorce | Actual | Percent | |||
| Europe | 8.1 | 1.7 | 4.76 | 20.99 | (2018)[1] | |
| Africa | 10.1 | 1.6 | 6.31 | 15.84 | (2013)[2] | |
| Europe | 6.0 | 1.0 | 6 | 16.67 | (2011)[3][4] | |
| Oceania | 4.6 | 2.0 | 2.3 | 43.48 | (2017)[5] | |
| Europe | 5.3 | 1.8 | 2.94 | 33.96 | (2018)[1] | |
| Asia | 9.7 | 1.5 | 6.47 | 15.46 | (2011)[3][4] | |
| North America | 6.1 | 1.0 | 6.1 | 16.39 | (2007)[3][4] | |
| Europe | 9.2 | 4.1 | 2.24 | 44.57 | (2011)[3][4] | |
| Europe | 3.9 | 2.1 | 1.86 | 53.85 | (2016)[1] | |
| 10.6 | 2.7 | 3.93 | 25.47 | (2009)[3][4] | ||
| Europe | 4.8 | 0.6 | 8 | 12.5 | (2012)[1] | |
| South America | 6.6 | 1.4 | 4.71 | 21.21 | (2009)[6] | |
| Europe | 4.1 | 1.5 | 2.73 | 36.59 | (2018)[1] | |
| North America | 4.4 | 2.1 | 2.1 | 47.73 | (2008)[3][4] | |
| South America | 3.3 | 0.7 | 4.71 | 21.21 | (2009)[3][4] | |
| Asia | 7.2 | 3.2 | 2.25 | 44.44 | (2018) | |
| South America | 2.3 | 0.7 | 3.29 | 30.43 | (2007)[7] | |
| North America | 5.3 | 2.5 | 2.12 | 47.17 | (2010)[3][4] | |
| Europe | 4.9 | 1.5 | 3.27 | 30.61 | (2018)[1] | |
| North America | 5.2 | 2.9 | 1.79 | 55.77 | (2010)[3][4] | |
| Asia | 6.8 | 2.2 | 3.09 | 32.35 | (2017)[1] | |
| Europe | 5.1 | 2.3 | 2.22 | 45.1 | (2018)[1] | |
| Europe | 5.6 | 2.6 | 2.15 | 46.43 | (2018)[1] | |
| North America | 4.4 | 1.8 | 2.44 | 40.91 | (2010)[3][4] | |
| South America | 5.6 | 1.1 | 5.09 | 19.64 | (2006)[7] | |
| Africa | 11.0 | 1.9 | 5.79 | 17.27 | (2010)[3][4] | |
| North America | 3.5 | 0.8 | 4.38 | 22.86 | (2006)[7] | |
| Europe | 5.0 | 2.4 | 2.08 | 48 | (2018)[1] | |
| 4.4 | 2 | 2.2 | 45.45 | (2017)[1] | ||
| Europe | 4.3 | 2.4 | 1.79 | 55.81 | (2018)[1] | |
| Europe | 3.7 | 1.9 | 1.95 | 51.35 | (2016)[1] | |
| Asia | 6.9 | 1.3 | 5.31 | 18.84 | (2011)[3][4] | |
| Europe | 4.9 | 1.9 | 2.58 | 38.78 | (2017)[1] | |
| 6.7 | 3.2 | 2.09 | 47.76 | (2010)[3][4] | ||
| North America | 5.0 | 1.1 | 4.55 | 22 | (2001)[7] | |
| Europe | 4.7 | 1.8 | 2.61 | 38.3 | (2017)[1] | |
| North America | 3.8 | 1.2 | 3.17 | 31.58 | (2008)[3][4] | |
| Europe | 5.2 | 1.7 | 3.06 | 32.69 | (2018)[1] | |
| Europe | 4.9 | 1.8 | 2.72 | 36.73 | (2010)[1] | |
| Asia | 11.2 | 1.6 | 7 | 14.29 | (2017)[8] | |
| Europe | 4.6 | 0.7 | 6.57 | 15.22 | (2017)[1] | |
| Asia | 6.5 | 1.8 | 3.61 | 27.69 | (2009) | |
| Europe | 3.2 | 1.5 | 2.13 | 46.88 | (2018)[1] | |
| North America | 7.5 | 1.5 | 5 | 20 | (2011)[3][4] | |
| Asia | 4.8 | 1.7 | 2.82 | 35.42 | (2019)[9] | |
| Asia | 10.2 | 2.6 | 3.92 | 25.49 | (2010)[3][4] | |
| Asia | 8.6 | 2.3 | 3.74 | 26.74 | (2008)[3][4] | |
| Asia | 5.2 | 2.2 | 2.36 | 42.31 | (2010)[3][4] | |
| Asia | 9.7 | 1.6 | 6.06 | 16.49 | (2010)[3][4] | |
| Europe | 6.8 | 3.1 | 2.19 | 45.59 | (2018)[1] | |
| Asia | 9.5 | 1.6 | 5.94 | 16.84 | (2007)[3][4] | |
| Africa | 10.8 | 2.5 | 4.32 | 23.15 | (2008)[10] | |
| Europe | 5.0 | 2.4 | 2.08 | 48 | (2010)[1] | |
| Europe | 7.0 | 3.1 | 2.26 | 44.29 | (2018)[1] | |
| Europe | 3.1 | 2.0 | 1.55 | 64.52 | (2018)[1] | |
| Europe | 5.8 | 0.7 | 8.29 | 12.07 | (2018)[1] | |
| Africa | 8.2 | 1.4 | 5.86 | 17.07 | (2010)[3][4] | |
| North America | 5.2 | 0.9 | 5.78 | 17.31 | (2009)[3][4] | |
| Europe | 7.3 | 3.1 | 2.35 | 42.47 | (2011)[3][4] | |
| Asia | 3.4 | 1.1 | 3.09 | 32.35 | (2010)[3][4] | |
| Europe | 5.3 | 1.4 | 3.79 | 26.42 | (2018)[1] | |
| Europe | 3.7 | 1.8 | 2.06 | 48.65 | (2018)[1] | |
| Oceania | 4.8 | 2.0 | 2.4 | 41.67 | (2008)[3][4] | |
| North America | 4.5 | 0.8 | 5.63 | 17.78 | (2005)[7] | |
| Europe | 6.5 | 0.8 | 8.13 | 12.31 | (2018)[1] | |
| Europe | 4.3 | 1.9 | 2.26 | 44.19 | (2018)[1] | |
| North America | 3.7 | 1.0 | 3.7 | 27.03 | (2010)[3][4] | |
| Europe | 5.1 | 1.7 | 3 | 33.33 | (2018)[1] | |
| Europe | 3.4 | 2.0 | 1.7 | 58.82 | (2018)[1] | |
| Asia | 3.3 | 1.1 | 3 | 33.33 | (2011)[3][4] | |
| Europe | 7.4 | 1.6 | 4.63 | 21.62 | (2018)[1] | |
| Europe | 9.2 | 4.8 | 1.92 | 52.17 | (2011)[3][4] | |
| North America | 2.8 | 0.7 | 4 | 25 | (2004)[7] | |
| North America | 5.8 | 0.8 | 7.25 | 13.79 | (2007)[3][4] | |
| Europe | 6.1 | 2.5 | 2.44 | 40.98 | (2011)[3][4] | |
| Asia | 5.2 | 1.1 | 4.73 | 21.15 | (2005)[7] | |
| Europe | 5.2 | 1.4 | 3.71 | 26.92 | (2018)[1] | |
| Africa | 17.4 | 1.9 | 9.16 | 10.92 | (2011)[3][4] | |
| Asia | 6.8 | 1.9 | 3.58 | 27.94 | (2015)[11] | |
| Europe | 5.7 | 1.8 | 3.17 | 31.58 | (2018)[1] | |
| Europe | 3.5 | 1.1 | 3.18 | 31.43 | (2018)[1] | |
| Africa | 3.5 | 0.6 | 5.83 | 17.14 | (2009)[6] | |
| Asia | 4.7 | 2.2 | 2.14 | 46.81 | (2019)[12] | |
| Europe | 3.5 | 2.0 | 1.75 | 57.14 | (2018)[1] | |
| Asia | ? | 0.15 | ?[13] | |||
| South America | 4.2 | 1.3 | 3.23 | 30.95 | (2007)[3][4] | |
| Europe | 5.0 | 2.5 | 2 | 50 | (2018)[1] | |
| Europe | 4.8 | 2.0 | 2.4 | 41.67 | (2016)[1] | |
| Asia | 10.6 | 1.3 | 8.15 | 12.26 | (2006)[7] | |
| Asia | 5.7 | 2.3 | 2.48 | 40.35 | (2018)[14] | |
| Asia | 13.5 | 1.4 | 9.64 | 10.37 | (2009)[3][4] | |
| Asia | 5.5 | 1.4 | 3.93 | 25.45 | (2005)[7] | |
| Oceania | 7.1 | 1.2 | 5.92 | 16.9 | (2003)[7] | |
| North America | 6.3 | 2.2 | 2.86 | 34.92 | (2005)[7][15] | |
| Africa | (2016)[16] | |||||
| Europe | 6.8 | 1.7 | 4 | 25 | (2018)[1] | |
| Europe | 6.7 | 2.8 | 2.39 | 41.79 | (2010)[3][4] | |
| Asia | 2.8 | 0.7 | 4 | 25 | (2005)[17] | |
| Europe | 4.4 | 1.8 | 2.44 | 40.91 | (2015)[1] | |
| North America | 6.5 | 2.9 | 2.24 | 44.62 | (2017)[18] | |
| South America | 3.2 | ? | (2010)[3] | |||
| Asia | 7.8 | 1.1 | 7.09 | 14.1 | (2006)[19][20] | |
| South America | 3.3 | 1.2 | 2.75 | 36.36 | (2006)[3] | |
| Asia | 5.7 | 0.4 | 14.25 | 7.02 | (2015)[3][4] | |
Sources
Information about divorces can generally be obtained from the census data published by governmental statistics offices.
Metrics / statistics
Crude divorce rate
This is divorces per 1,000 population per year.[21] For example, if a city has 10,000 people living in it, and 30 couples divorce in one year, then the crude divorce rate for that year is 3 divorces per 1,000 residents.

The crude divorce rate can give a general overview of marriage in an area, but it does not take people who cannot marry into account. For example, it would include young children, who are clearly not of marriageable age in its sample. In a place with large numbers of children or single adults, the crude divorce rate can seem low. In a place with few children and single adults, the crude divorce rate can seem high.
Refined divorce rate
This measures the number of divorces per 1,000 women married to men, so that all unmarried persons are left out of the calculation.[21] For example, if that same city of 10,000 people has 3,000 married women, and 30 couples divorce in one year, then the refined divorce rate is 10 divorces per 1,000 married women.

Divorce-to-marriage ratio
This compares the number of divorces in a given year to the number of marriages in that same year (the ratio of the crude divorce rate to the crude marriage rate).[21] For example, if there are 500 divorces and 1,000 marriages in a given year in a given area, the ratio would be one divorce for every two marriages, e.g. a ratio of 0.50 (50%).

However, this measurement compares two unlike populations – those who can marry and those who can divorce. Say there exists a community with 100,000 married couples, and very few people capable of marriage, for reasons such as age. If 1,000 people obtain divorces and 1,000 people get married in the same year, the ratio is one divorce for every marriage, which may lead people to think that the community's relationships are extremely unstable, despite the number of married people not changing. This is also true in reverse: a community with very many people of marriageable age may have 10,000 marriages and 1,000 divorces, leading people to believe that it has very stable relationships.
Furthermore, these two rates are not directly comparable since the marriage rate only examines the current year, while the divorce rate examines the outcomes of marriages for many previous years. This does not equate to the proportion of marriages in a given single-year cohort that will ultimately end in divorce. In any given year, underlying rates may change, and this can affect the ratio. For example, during an economic downturn, some couples might postpone a divorce because they can't afford to live separately. These individual choices could seem to temporarily improve the divorce-to-marriage ratio.
References
- "Marriage and divorce statistics". Eurostat 2017.
- "Office National des statistiques - Démographie Algérienne 2014" (PDF). Office National des Statistiques (ONS) 2013.
- "Marriages and crude marriage rates" (PDF). United Nations Statistical Division (UNSTAT) 2011. Retrieved 10 January 2013.
- "Divorces and crude divorce rates" (PDF). United Nations Statistical Division (UNSTAT) 2011. Retrieved 10 January 2013.
- Australian Bureau of Statistic: Marriages and Divorces
- BRICS Joint Statistical Publication 2012, Chapter 3: Population (PDF). 2012. p. 18. Archived from the original (PDF) on 2013-02-28. Retrieved 2013-01-20.
- "World Marriage Data 2008". United Nations, Department of Economic and Social Affairs, Population Division (2009). Retrieved 19 January 2013.
- BBC Persian "رکورد طلاق در ایران شکست؛ ثبت ۱۷۵ هزار جدایی در سال ۱۳۹۶", BBC, London, 9 April 2018. Retrieved on 28 November 2018.
- https://www.nippon.com/ja/japan-data/h00759/
- UNESCWA Population Statistics
- SINGAPORE SOCIAL STATISTICS IN BRIEF 2015 (PDF). Ministry of Social and Family Development. Archived from the original (PDF) on 2015-12-08. Retrieved 4 December 2015.
- http://kostat.go.kr/portal/eng/pressReleases/8/11/index.board
- "UNICEF:Sri Lanka Statistics".
- United Nations Statistical Division (UNSTAT) 2010
- UNESCWA Population Statistics
- "Marriage and Divorce". National Center for Health Statistics. Centers for Disease Control and Prevention. 28 May 2019. Retrieved 14 November 2019.
- "Gender: average marriage rate 2000-2006". UNDP CO in Uzbekistan, 2013. Archived from the original on 2013-10-17.
- "Gender: average divorce rate 2000-2006". UNDP CO in Uzbekistan, 2013. Archived from the original on 2013-10-17.
- England, J. Lynn; Kunz, Phillip R. (February 1975), "The Application of Age-Specific Rates to Divorce", Journal of Marriage and the Family, Journal of Marriage and Family, Vol. 37, No. 1, 37 (1): 40–46, doi:10.2307/351029, JSTOR 351029
