International Innovation Index
The International Innovation Index is a global index measuring the level of innovation of a country, produced jointly by The Boston Consulting Group (BCG), the National Association of Manufacturers (NAM), and The Manufacturing Institute (MI), the NAM's nonpartisan research affiliate. NAM describes it as the "largest and most comprehensive global index of its kind".[1]
The International Innovation Index is part of a large research study that looked at both the business outcomes of innovation and government's ability to encourage and support innovation through public policy. The study comprised a survey of more than 1,000 senior executives from NAM member companies across all industries; in-depth interviews with 30 of the executives; and a comparison of the "innovation friendliness" of 110 countries and all 50 U.S. states. The findings are published in the report, "The Innovation Imperative in Manufacturing: How the United States Can Restore Its Edge."[2]
The report discusses not only country performance but also what companies are doing and should be doing to spur innovation. It looks at new policy indicators for innovation, including tax incentives and policies for immigration, education and intellectual property.
Large country ranking
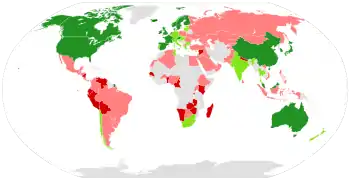
The index was published in March 2009.[3] To rank the countries, the study measured both innovation inputs and outputs. Innovation inputs included government and fiscal policy, education policy and the innovation environment. Outputs included patents, technology transfer, and other R&D results; business performance, such as labor productivity and total shareholder returns; and the impact of innovation on business migration and economic growth. The following is a list of the twenty largest countries (as measured by GDP) by the International Innovation Index:
| Rank | Country | Overall | Innovation inputs | Innovation performance |
|---|---|---|---|---|
| 1 | 2.26 | 1.75 | 2.55 | |
| 2 | 1.80 | 1.28 | 2.16 | |
| 3 | 1.79 | 1.16 | 2.25 | |
| 4 | 1.64 | 1.25 | 1.88 | |
| 5 | 1.55 | 1.40 | 1.55 | |
| 6 | 1.42 | 1.39 | 1.32 | |
| 7 | 1.42 | 1.33 | 1.37 | |
| 8 | 1.12 | 1.05 | 1.09 | |
| 9 | 1.12 | 1.17 | 0.96 | |
| 10 | 1.02 | 0.89 | 1.05 | |
| 11 | 0.93 | 0.83 | 0.95 | |
| 12 | 0.86 | 0.85 | 0.79 | |
| 13 | 0.73 | 0.07 | 1.32 | |
| 14 | 0.21 | 0.16 | 0.24 | |
| 15 | 0.06 | 0.14 | -0.02 | |
| 16 | -0.09 | -0.02 | -0.16 | |
| 17 | -0.16 | 0.11 | -0.42 | |
| 18 | -0.21 | 0.15 | -0.55 | |
| 19 | -0.57 | -0.63 | -0.46 | |
| 20 | -0.59 | -0.62 | -0.51 |
Large and small country ranking
| Rank | Country | Overall | Innovation inputs | Innovation performance |
|---|---|---|---|---|
| 1 | 2.33 | 2.74 | 1.92 | |
| 2 | 2.26 | 1.75 | 2.55 | |
| 3 | 2.23 | 1.51 | 2.74 | |
| 4 | 1.50 | 2.14 | 2.00 | |
| 5 | 1.88 | 1.59 | 1.99 | |
| 7 | 1.87 | 1.76 | 1.81 | |
| 8 | 1.80 | 1.28 | 2.16 | |
| 9 | 1.79 | 1.16 | 2.25 | |
| 10 | 1.64 | 1.25 | 1.88 | |
| 11 | 1.60 | 1.55 | 1.50 | |
| 12 | 1.55 | 1.40 | 1.55 | |
| 13 | 1.54 | 0.94 | 2.00 | |
| 14 | 1.42 | 1.39 | 1.32 | |
| 15 | 1.42 | 1.33 | 1.37 | |
| 16 | 1.31 | 1.26 | 1.35 | |
| 17 | 1.15 | 1.38 | 0.81 | |
| 18 | 1.14 | 1.48 | 0.70 | |
| 19 | 1.12 | 1.05 | 1.09 | |
| 20 | 1.12 | 1.17 | 0.96 | |
| 21 | 1.12 | 1.01 | 1.12 | |
| 22 | 1.02 | 0.89 | 1.05 | |
| 23 | 0.94 | 1.50 | 0.29 | |
| 24 | 0.93 | 0.83 | 0.95 | |
| 25 | 0.86 | 0.85 | 0.79 | |
| 26 | 0.77 | 0.79 | 0.69 | |
| 27 | 0.73 | 0.07 | 1.32 | |
| 28 | 0.63 | 0.64 | 0.56 | |
| 29 | 0.60 | 0.92 | 0.22 | |
| 30 | 0.52 | 0.86 | 0.13 | |
| 31 | 0.51 | 0.80 | 0.18 | |
| 32 | 0.41 | 0.88 | -0.10 | |
| 33 | 0.37 | 0.47 | 0.24 | |
| 34 | 0.33 | 0.15 | 0.47 | |
| 35 | 0.27 | 0.78 | -0.26 | |
| 36 | 0.21 | 0.72 | -0.31 | |
| 37 | 0.21 | 0.36 | 0.04 | |
| 38 | 0.21 | 0.16 | 0.24 | |
| 39 | 0.20 | -0.21 | 0.59 | |
| 40 | 0.16 | 0.71 | -0.40 | |
| 41 | 0.14 | 0.57 | -0.30 | |
| 42 | 0.12 | 0.01 | 0.23 | |
| 43 | 0.12 | 0.38 | -0.14 | |
| 44 | 0.12 | -0.12 | 0.35 | |
| 45 | 0.06 | 0.48 | -0.36 | |
| 46 | 0.06 | 0.14 | -0.02 | |
| 47 | 0.06 | 0.46 | -0.35 | |
| 48 | -0.03 | 0.21 | -0.26 | |
| 49 | -0.09 | -0.02 | -0.16 | |
| 50 | -0.12 | 0.57 | -0.79 | |
| 51 | -0.12 | -0.42 | 0.20 | |
| 52 | -0.12 | 0.22 | -0.44 | |
| 53 | -0.13 | 0.23 | -0.48 | |
| 54 | -0.15 | -0.76 | 0.48 | |
| 55 | -0.15 | 0.27 | -0.56 | |
| 56 | -0.15 | -0.04 | -0.26 | |
| 57 | -0.16 | 0.11 | -0.42 | |
| 58 | -0.21 | 0.15 | -0.55 | |
| 59 | -0.22 | -1.01 | 0.59 | |
| 60 | -0.23 | -0.51 | 0.07 | |
| 61 | -0.29 | 0.22 | -0.77 | |
| 62 | -0.39 | -0.57 | -0.18 | |
| 63 | -0.43 | -0.48 | -0.34 | |
| 64 | -0.45 | -0.13 | -0.73 | |
| 65 | -0.47 | -0.46 | -0.43 | |
| 66 | -0.47 | -0.50 | -0.40 | |
| 67 | -0.49 | -0.58 | -0.34 | |
| 68 | -0.54 | -0.48 | -0.54 | |
| 69 | -0.56 | -0.61 | -0.46 | |
| 70 | -0.57 | -0.55 | -0.54 | |
| 71 | -0.57 | -0.63 | -0.46 | |
| 72 | -0.59 | -0.62 | -0.51 | |
| 73 | -0.65 | -1.09 | -0.16 | |
| 74 | -0.66 | -0.95 | -0.30 | |
| 75 | -0.66 | -0.75 | -0.52 | |
| 76 | -0.68 | -0.13 | -1.17 | |
| 77 | -0.72 | -0.48 | -0.88 | |
| 78 | -0.75 | -1.16 | -0.27 | |
| 79 | -0.75 | -0.72 | -0.72 | |
| 80 | -0.77 | -0.59 | -0.88 | |
| 81 | -0.78 | -0.54 | -0.95 | |
| 82 | -0.79 | -0.64 | -0.85 | |
| 83 | -0.80 | -0.24 | -1.28 | |
| 84 | -0.82 | -1.04 | -0.51 | |
| 85 | -0.83 | -0.87 | -0.70 | |
| 86 | -0.89 | -0.63 | -1.07 | |
| 87 | -0.90 | -0.71 | -1.01 | |
| 88 | -0.95 | -0.91 | -0.90 | |
| 89 | -0.95 | -0.76 | -1.06 | |
| 90 | -0.96 | -1.05 | -0.78 | |
| 91 | -0.97 | -1.25 | -0.59 | |
| 92 | -0.97 | -0.96 | -0.90 | |
| 93 | -0.99 | -1.04 | -0.86 | |
| 94 | -0.99 | -0.94 | -0.96 | |
| 95 | -1.01 | -0.91 | -1.02 | |
| 96 | -1.02 | -1.08 | -0.87 | |
| 97 | -1.03 | -0.99 | -0.98 | |
| 98 | -1.05 | -1.23 | -0.77 | |
| 99 | -1.06 | -1.11 | -0.91 | |
| 100 | -1.06 | -1.18 | -0.85 | |
| 101 | -1.07 | -1.12 | -0.92 | |
| 102 | -1.11 | -1.21 | -0.91 | |
| 103 | -1.16 | -1.15 | -1.06 | |
| 104 | -1.18 | -1.22 | -1.02 | |
| 105 | -1.28 | -1.40 | -1.03 | |
| 106 | -1.28 | -1.55 | -0.89 | |
| 107 | -1.32 | -1.77 | -0.74 | |
| 108 | -1.37 | -1.50 | -1.10 | |
| 109 | -1.54 | -1.82 | -1.22 | |
| 110 | -1.63 | -1.63 | -1.48 |
See also
- Global Innovation Index
- Bloomberg Innovation Quotient
- Creative destruction
- Creative problem solving
- Theories of technology
- Diffusion (anthropology)
- Ecoinnovation
- Emerging technologies
- List of emerging technologies
- Hype cycle
- Individual capital
- Induced innovation
- Information revolution
- Innovation economics
- Knowledge economy
- Open innovation
- Timeline of historic inventions
- Toolkits for User Innovation
- User innovation
- Value network
References
- "America Ranks #8 In New Global Innovation Index". Archived from the original on 2018-11-22. Retrieved 2020-01-24.
- U.S. Ranks #8 In Global Innovation Index, Industryweek.com, Mar 9, 2009
- The Innovation Imperative in Manufacturing: How the United States Can Restore Its Edge