List of countries by age at first marriage
This is a list of countries by age at first marriage. This list is current from contemporary surveys and does not treat the topic in history. Currency of information varies by country. Because the age distribution of people at first marriage is skewed with a longer tail towards older ages,[1] the majority of people marry before the average age of first marriage. The median age is a more precise representation of when the majority of people marry; for most reporting sources, however, only the average age at marriage is reported.
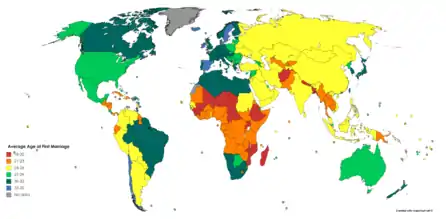
Map by color of age at first marriage
Africa
| Country | Men | Women | Average | Age Gap | Age Ratio | Year | Source |
|---|---|---|---|---|---|---|---|
| 33.5 | 27.8 | 30.7 | 5.7 | 1.21 | 2006 | [2] | |
| 24.7 | 21.4 | 23.1 | 3.3 | 1.15 | 2001 | [3] | |
| 23.8 | 18.7 | 21.3 | 5.1 | 1.27 | 2006 | [3] | |
| 30.9 | 26.4 | 28.7 | 4.5 | 1.17 | 2001 | [4] | |
| 24.3 | 17.9 | 21.1 | 6.4 | 1.36 | 2010 | [3] | |
| 23.6 | 20.3 | 22 | 3.3 | 1.16 | 2010 | [3] | |
| 26.2 | 21.5 | 23.9 | 4.7 | 1.22 | 2010 | [3] | |
| 25.8 | 19.0 | 22.4 | 6.8 | 1.36 | 2011 | [3] | |
| 23.3 | 17.4 | 20.4 | 5.9 | 1.34 | 1994-1995 | [3] | |
| 22.4 | 16.0 | 19.2 | 6.4 | 1.4 | 2004 | [3] | |
| 25.6 | 20.4 | 23 | 5.2 | 1.25 | 1996 | [3] | |
| 25.1 | 21.0 | 23.1 | 4.1 | 1.2 | 2009 | [3] | |
| 26.7 | 19.5 | 23.1 | 7.2 | 1.37 | 2005 | [3] | |
| 24.2 | 19.0 | 21.6 | 5.2 | 1.27 | 2007 | [3] | |
| 30.8 | 26.9 | 28.9 | 3.9 | 1.14 | 2002 | [4] | |
| 33.6 | 27.9 | 30.8 | 5.7 | 1.2 | 1996 | [5] | |
| 26.1 | 20.5 | 23.3 | 5.6 | 1.27 | 2011 | [4] | |
| 24.7 | 17.4 | 21.1 | 7.3 | 1.42 | 1995 | [3] | |
| 30.5 | 26.5 | 28.5 | 4 | 1.15 | 2007 | [4] | |
| 23.9 | 17.4 | 20.7 | 6.5 | 1.37 | 2011 | [3] | |
| 24.7 | 20.4 | 22.6 | 4.3 | 1.21 | 2000 | [3] | |
| 29.7 | 21.5 | 25.6 | 8.2 | 1.38 | 2013 | [4] | |
| 25.7 | 21.7 | 23.7 | 4 | 1.18 | 2008 | [3] | |
| 24.6 | 16.5 | 20.6 | 8.1 | 1.49 | 2005 | [3] | |
| 28.1 | 20.9 | 24.5 | 7.2 | 1.34 | 2000 | [4] | |
| 24.8 | 20.2 | 22.5 | 4.6 | 1.23 | 2008-2009 | [3] | |
| 25.5 | 20.9 | 23.2 | 4.6 | 1.22 | 2009 | [3] | |
| 23.4 | 18.9 | 21.2 | 4.5 | 1.24 | 2007 | [3] | |
| 32.0 | 29.2 | 30.6 | 2.8 | 1.1 | 1995 | [5] | |
| 22.3 | 18.4 | 20.4 | 3.9 | 1.21 | 2008 | [3] | |
| 22.3 | 17.9 | 20.1 | 4.4 | 1.25 | 2010 | [3] | |
| 24.1 | 16.7 | 20.4 | 7.4 | 1.44 | 2006 | [3] | |
| 27.1 | 19.0 | 23.1 | 8.1 | 1.43 | 2000-2001 | [3] | |
| 29.8 | 25.4 | 27.6 | 4.4 | 1.17 | 2000 | [3] | |
| 34.3 | 29.8 | 32.1 | 4.5 | 1.15 | 1994 | [5] | |
| 21.7 | 17.5 | 19.6 | 4.2 | 1.24 | 2009 | [3] | |
| 31.7 | 29.2 | 30.5 | 2.5 | 1.09 | 2006-2007 | [3] | |
| 23.1 | 15.7 | 19.4 | 7.4 | 1.47 | 2006 | [3] | |
| 26.9 | 19.3 | 23.1 | 7.6 | 1.39 | 2008 | [3] | |
| 24.8 | 20.6 | 22.7 | 4.2 | 1.2 | 2010 | [3] | |
| 23.8 | 18.8 | 21.3 | 5 | 1.27 | 2008-2009 | [3] | |
| 28.9 | 19.9 | 24.4 | 9 | 1.45 | 2010-2011 | [3] | |
| 27.3 | 25.2 | 26.3 | 2.1 | 1.08 | 2002 | [4] | |
| 24.4 | 17.1 | 20.8 | 7.3 | 1.43 | 2008 | [3] | |
| 26.5 | 20.6 | 23.6 | 5.9 | 1.29 | 1982 | [4] | |
| 32.0 | 29.0 | 30.5 | 3 | 1.1 | 2008 | [3] | |
| 27.1 | 20.7 | 23.9 | 6.4 | 1.31 | 2008 | ||
| 29.1 | 22.7 | 25.9 | 6.4 | 1.28 | 1993 | [5] | |
| 23.8 | 18.9 | 21.4 | 4.9 | 1.26 | 2010 | [3] | |
| 27.6 | 22.3 | 25 | 5.3 | 1.24 | 2014 | [4] | |
| 32.6 | 28.7 | 30.7 | 3.9 | 1.14 | 2004 | [4] | |
| 22.4 | 18.2 | 20.3 | 4.2 | 1.23 | 2011 | [3] | |
| 23.7 | 18.7 | 21.2 | 5 | 1.27 | 2007 | [3] | |
| 24.6 | 19.9 | 22.3 | 4.7 | 1.24 | 2010-2011 | [3] |
Americas
| Country | Men | Women | Average | Age Gap | Age Ratio | Year | Source |
|---|---|---|---|---|---|---|---|
| 29.3 | 25.7 | 27.5 | 3.6 | 1.14 | 2001 | [4] | |
| 26.6 | 24.6 | 25.6 | 2 | 1.08 | 2010 | [4] | |
| 30.6 | 27.9 | 29.3 | 2.7 | 1.1 | 2010 | [4] | |
| 34.3 | 31.8 | 33.1 | 2.5 | 1.08 | 1990 | [4] | |
| 30.1 | 28.6 | 29.4 | 1.5 | 1.05 | 2010 | [4] | |
| 26.6 | 24.1 | 25.4 | 2.5 | 1.1 | 2012 | [4] | |
| 33.0 | 30 | 31.5 | 3 | 1.1 | 2014 | [6] | |
| 31.0 | 29.6 | 30.3 | 1.4 | 1.05 | 2008 | [7] | |
| 35.3 | 32.6 | 34 | 2.7 | 1.08 | 2013 | [8] | |
| 26.8 | 22.3 | 24.6 | 4.5 | 1.2 | 2010 | [4] | |
| 28.8 | 25.7 | 27.3 | 3.1 | 1.12 | 2014 | [4] | |
| 25.4 | 21.3 | 23.4 | 4.1 | 1.19 | 2012 | [4] | |
| 36.5 | 32.5 | 34.5 | 4 | 1.12 | 2001 | [4] | |
| 24.8 | 21.0 | 22.9 | 3.8 | 1.18 | 2013 | [4] | |
| 25.0 | 21.8 | 23.4 | 3.2 | 1.15 | 2010 | [4] | |
| 25.5 | 22.5 | 24 | 3 | 1.13 | 2007 | [4] | |
| 34.4 | 31.0 | 32.7 | 3.4 | 1.11 | 1991 | [4] | |
| 23.6 | 21.3 | 22.5 | 2.3 | 1.11 | 1994 | [4] | |
| 25.4 | 21.5 | 23.5 | 3.9 | 1.18 | 2009 | [4] | |
| 28.3 | 23.7 | 26 | 4.6 | 1.19 | 2012 | [4] | |
| 24.1 | 21.2 | 22.7 | 2.9 | 1.14 | 2012 | [4] | |
| 34.8 | 33.2 | 34 | 1.6 | 1.05 | 2001 | [4] | |
| 29.0 | 26.0 | 27.5 | 3 | 1.12 | 2011 | [9] | |
| 24.4 | 20.6 | 22.5 | 3.8 | 1.18 | 2005 | [4] | |
| 25.3 | 21.6 | 23.5 | 3.7 | 1.17 | 2010 | [4] | |
| 26.8 | 22.7 | 24.8 | 4.1 | 1.18 | 2002 | [4] | |
| 27.5 | 23.5 | 25.5 | 4 | 1.17 | 2012 | [4] | |
| 32.1 | 31.3 | 31.7 | 0.8 | 1.03 | 1980 | [4] | |
| 35.1 | 33.7 | 34.4 | 1.4 | 1.04 | 1991 | [4] | |
| 27.8 | 21.2 | 24.5 | 6.6 | 1.31 | 2002 | [4] | |
| 32.8 | 29.3 | 31.1 | 3.5 | 1.12 | 2012 | [4] | |
| 31.8 | 29.2 | 30.5 | 2.6 | 1.09 | 2011 | [4] | |
| 29.8 | 28.0 | 28.9 | 1.8 | 1.06 | 2019 | [10] | |
| 26.5 | 24.0 | 25.3 | 2.5 | 1.1 | 2011 | [4] | |
| 26.0 | 22.7 | 24.4 | 3.3 | 1.15 | 2001 | [4] |
Asia
| Country | Men | Women | Average | Age Gap | Age Ratio | Year | Source |
|---|---|---|---|---|---|---|---|
| 23.5 | 15.0 | 19.3 | 8.5 | 1.57 | 2008 | [4] | |
| 30.0 | 26.3 | 28.2 | 3.7 | 1.14 | 2001 | [4] | |
| 23.8 | 16.0 | 19.9 | 7.8 | 1.49 | 2011 | [3] | |
| 25.4 | 22.8 | 24.1 | 2.6 | 1.11 | 2007 | [4] | |
| 27.3 | 25.1 | 26.2 | 2.2 | 1.09 | 1991 | [4] | |
| 23.4 | 21.0 | 22.2 | 2.4 | 1.11 | 2010 | [3] | |
| 27.1 | 24.9 | 26 | 2.2 | 1.09 | 2017 | [11] | |
| 31.2 | 28.9 | 30.1 | 2.3 | 1.08 | 2011 | [12] | |
| 26.0 | 22.2 | 24.1 | 3.8 | 1.17 | 2011 | [13] | |
| 25.7 | 22.3 | 24 | 3.4 | 1.15 | 2010 | [14] | |
| 27.4 | 23.8 | 25.6 | 3.6 | 1.15 | 2015 | [15] | |
| 28.2 | 25.3 | 26.8 | 2.9 | 1.11 | 2004 | [4] | |
| 27.6 | 25 | 26.3 | 2.6 | 1.1 | 2016 | [16] | |
| 30.9 | 29.3 | 30.1 | 1.6 | 1.05 | 2013 | [17] | |
| 28.7 | 23.8 | 26.3 | 4.9 | 1.21 | 2010 | [18] | |
| 26.9 | 24.3 | 25.6 | 2.6 | 1.11 | 2010 | [3] | |
| 28.9 | 27.5 | 28.2 | 1.4 | 1.05 | 2005 | [4] | |
| 25.5 | 21.8 | 23.7 | 3.7 | 1.17 | 2012 | [4] | |
| 23.3 | 20.5 | 21.9 | 2.8 | 1.14 | 2012 | [4] | |
| 32.8 | 28.8 | 30.8 | 4 | 1.14 | 2006 | [19] | |
| 28 | 25.7 | 26.9 | 2.3 | 1.09 | 2010 | [20] | |
| 24.1 | 21.6 | 22.9 | 2.5 | 1.12 | 2009 | [3] | |
| 29 | 26 | 27.5 | 3 | 1.12 | 2019 | [21] | |
| 24.0 | 20.5 | 22.3 | 3.5 | 1.17 | 2007 | [3] | |
| 22.1 | 17.9 | 20 | 4.2 | 1.23 | 2011 | [3] | |
| 29.0 | 25.5 | 27.3 | 3.5 | 1.14 | 2008 | [4] | |
| 28.1 | 24.8 | 26.5 | 3.3 | 1.13 | 2003 | [4] | |
| 26 | 20.3 | 23.2 | 5.7 | 1.28 | 2006-2007 | [3] | |
| 25.4 | 20.1 | 22.8 | 5.3 | 1.26 | 2010 | [3] | |
| 28.0 | 25.3 | 26.7 | 2.7 | 1.11 | 2011 | [22] | |
| 27.3 | 25.4 | 26.4 | 1.9 | 1.07 | 2010 | [4] | |
| 28 | 24.9 | 26.5 | 3.1 | 1.12 | 2007 | [4] | |
| 30.1 | 27.9 | 29 | 2.2 | 1.08 | 2014 | [23] | |
| 27.6 | 23.8 | 25.7 | 3.8 | 1.16 | 2001 | [4] | |
| 33.2 | 30.4 | 31.8 | 2.8 | 1.09 | 2018 | [24] | |
| 29.3 | 25.4 | 27.4 | 3.9 | 1.15 | 2001 | [4] | |
| 32.0 | 29.7 | 30.9 | 2.3 | 1.08 | 2014 | [25] | |
| 26.3 | 22.5 | 24.4 | 3.8 | 1.17 | 2010 | [3] | |
| 24.4 | 21.0 | 22.7 | 3.4 | 1.16 | 2010 | [3] | |
| 25.0 | 20.6 | 22.8 | 4.4 | 1.21 | 2009-2010 | [3] | |
| 24.6 | 23.3 | 24 | 1.3 | 1.06 | 2006 | [3] | |
| 26.8 | 25.3 | 26.1 | 1.5 | 1.06 | 2005 | [4] | |
| 25.2 | 22.4 | 23.8 | 2.8 | 1.13 | 2006 | [26] | |
| 26.2 | 22.8 | 24.5 | 3.4 | 1.15 | 2009 | [27] | |
| 26.1 | 23.0 | 24.6 | 3.1 | 1.13 | 2013 | [4] |
Europe
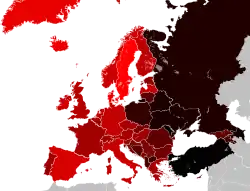
Average age at first marriage. Darker is younger
| Country | Men | Women | Average | Age Gap | Age Ratio | Year | Source |
|---|---|---|---|---|---|---|---|
| 29.5 | 24 | 26.8 | 5.5 | 1.23 | 2014 | [26] | |
| 32.6 | 30.3 | 31.5 | 2.3 | 1.08 | 2015 | [26] | |
| 27.6 | 23.7 | 25.7 | 3.9 | 1.16 | 2014 | [26] | |
| 29.4 | 26.3 | 27.9 | 3.1 | 1.12 | 2014 | [26] | |
| 27.4 | 25.3 | 26.4 | 2.1 | 1.08 | 2014 | [26] | |
| 32.3 | 30 | 31.2 | 2.3 | 1.08 | 2015 | [26] | |
| 29.6 | 26.4 | 28 | 3.2 | 1.12 | 2014 | [26] | |
| 30.3 | 26.9 | 28.6 | 3.4 | 1.13 | 2014 | [28] | |
| 30.6 | 28.1 | 29.4 | 2.5 | 1.09 | 2014 | [28] | |
| 32.4 | 29.8 | 31.1 | 2.6 | 1.09 | 2015 | [26] | |
| 30.8 | 29.0 | 29.9 | 1.8 | 1.06 | 2014 | [26] | |
| 34.5 | 32 | 33.3 | 2.5 | 1.08 | 2015 | [26] | |
| 31.6 | 29.0 | 30.3 | 2.6 | 1.09 | 2014 | [28] | |
| 33.4 | 31.2 | 32.3 | 2.2 | 1.07 | 2015 | [26] | |
| 33.0 | 30.8 | 31.9 | 2.2 | 1.07 | 2011 | [29] | |
| 29.9 | 26.6 | 28.3 | 3.3 | 1.12 | 2014 | [26] | |
| 33.4 | 30.9 | 32.2 | 2.5 | 1.08 | 2014 | [28] | |
| 33.0 | 29.9 | 31.5 | 3.1 | 1.1 | 2014 | [28] | |
| 32.1 | 29.3 | 30.7 | 2.8 | 1.1 | 2014 | [28] | |
| 34.6 | 32.7 | 33.7 | 1.9 | 1.06 | 2011 | [26] | |
| 36.8 | 34.8 | 35.8 | 2 | 1.06 | 2019 | [30] | |
| 34.2 | 31.3 | 32.8 | 2.9 | 1.09 | 2014 | [28] | |
| 30.6 | 28.2 | 29.4 | 2.4 | 1.09 | 2014 | [28] | |
| 29.7 | 27.3 | 28.5 | 2.4 | 1.09 | 2014 | [28] | |
| 32.6 | 29.8 | 31.2 | 2.8 | 1.09 | 2011 | [4] | |
| 33.3 | 31.1 | 32.2 | 2.2 | 1.07 | 2015 | [26] | |
| 28.8 | 26 | 27.4 | 2.8 | 1.11 | 2014 | [26] | |
| 31.6 | 29.2 | 30.4 | 2.4 | 1.08 | 2011 | [28] | |
| 28.3 | 25.8 | 27.1 | 2.5 | 1.1 | 2018 | [31] | |
| 33.4 | 30.4 | 31.9 | 3 | 1.1 | 2008 | [4] | |
| 32.7 | 28.6 | 30.7 | 4.1 | 1.14 | 2014 | [28] | |
| 33.5 | 30.9 | 32.2 | 2.6 | 1.08 | 2015 | [26] | |
| 33.8 | 31.9 | 32.9 | 1.9 | 1.06 | 2015 | [26] | |
| 30 | 27 | 28.5 | 3 | 1.11 | 2014 | [28] | |
| 32.5 | 31 | 31.8 | 1.5 | 1.05 | 2015 | [26] | |
| 30.2 | 26.7 | 28.5 | 3.5 | 1.13 | 2014 | [28] | |
| 27.4 | 24.9 | 26.2 | 2.5 | 1.1 | 2011 | [32] | |
| 33.5 | 30.7 | 32.1 | 2.8 | 1.09 | 2014 | [4] | |
| 31.0 | 28.1 | 29.6 | 2.9 | 1.1 | 2014 | [28] | |
| 30.8 | 28.1 | 29.5 | 2.7 | 1.1 | 2014 | [28] | |
| 32.2 | 29 | 30.6 | 3.2 | 1.11 | 2014 | [28] | |
| 34.5 | 32.3 | 33.4 | 2.2 | 1.07 | 2014 | [28] | |
| 36 | 33.5 | 34.8 | 2.5 | 1.07 | 2015 | [26] | |
| 32.5 | 30.1 | 31.3 | 2.4 | 1.08 | 2014 | [28] | |
| 27.8 | 24.8 | 26.3 | 3 | 1.12 | 2018 | [28] | |
| 27.0 | 25.0 | 26 | 2 | 1.08 | 2013 | [26] | |
| 33.4 | 31.5 | 32.5 | 1.9 | 1.06 | 2016 | [33] |
Oceania
Note: the reported age for these countries is the median, not the mean (average). All countries in italics have their data in the mean and not the median.
| Country | Men | Women | Median | Age Gap | Age Ratio | Year | Source |
|---|---|---|---|---|---|---|---|
| 31.8 | 29.8 | 30.8 | 2 | 1.07 | 2015 | [34] | |
| 27.7 | 27.7 | 0 | 1 | 2007 | [4] | ||
| 23.6 | 20.1 | 21.9 | 3.5 | 1.17 | 2009 | [35] | |
| 25.7 | 24.2 | 25 | 1.5 | 1.06 | 2011 | [36] | |
| 27.5 | 25.5 | 26.5 | 2 | 1.08 | 2010 | [37] | |
| 21.2 | 22.8 | 22.0 | -1.6 | 0.93 | 2007 | [38] | |
| 32.3 | 30.5 | 31.4 | 1.8 | 1.06 | 2017 | [39] | |
| 28.9 | 26.6 | 27.8 | 2.3 | 1.09 | 2005 | [4] | |
| 25.0 | 21.4 | 23.2 | 3.6 | 1.17 | 2006 | [4] | |
| 28.7 | 24.1 | 26.4 | 4.6 | 1.19 | 2009 | [4] | |
| 25.6 | 20.3 | 23.0 | 5.3 | 1.26 | 2007 | [40] | |
| 25.0 | 23.6 | 24.3 | 1.4 | 1.06 | 2012 | [41] | |
| 27.2 | 22.1 | 24.7 | 5.1 | 1.23 | 2007 | [42] | |
| 24.4 | 20.8 | 22.6 | 3.6 | 1.17 | 2013 | [43] | |
See also
Notes
- Those surveyed were aged 25-29
- Median ages are rounded
- West Bank only
- Those surveyed were aged 25+
- Those surveyed were aged 20-49
- Those surveyed were aged 25-49
References
- Australian Bureau of Statistics Family "Formation: Age at first marriage". 21 May 2011.
- Ministère de la Santé, de la Population et de la Réforme hospitalière and Office national des statistiques (December 2008). Suivi de la situation des enfants et des femmes. Enquête nationale à indicateurs multiples. Rapport principal (Report). p. 104.CS1 maint: uses authors parameter (link)
- United Nations, Department of Economic and Social Affairs, Population Division (2013). World Fertility Report 2012 (PDF) (Report). United Nations publication. p. Table A.1. Retrieved 20 September 2016.CS1 maint: multiple names: authors list (link)
- "Gender Statistics". Retrieved 23 July 2020.
- Jones, Gavin W. (2005). Islam, the State and Population. C. Hurst & Co. Publishers. p. 60. ISBN 1850656673.
- "Instituto Brasileiro de Geografia e Estatística". IBGE.
- "Marital Status: Overview, 2011 (Canada)". 30 November 2015. Retrieved 8 February 2018.
- http://www.latercera.com/noticia/tendencias/2016/02/659-666529-9-edad-para-casarse-llega-a-cifra-record-ellos-lo-estan-haciendo-a-los-35-anos-y.shtml
- Matrimonios y divorcios (In Spanish).
- "Historical Marital Status Tables".
- http://henan.163.com/16/0105/09/BCIB5UT6022702JV.html
- "Population Estimates". www.censtatd.gov.hk. Census and Statistics Department. Retrieved 16 June 2013.
- MedIndia
- Age at First Marriage, Female - All Countries Quandl, Retrieved 3 July 2013
- Mardomsalari Archived 29 June 2016 at the Wayback Machine
- "Young Israelis in no hurry to get married, new data shows". 18 August 2016. Retrieved 26 August 2019.
- Statistics Bureau, Ministry of Internal Affairs and Communications, Japan. "Statistical Handbook of Japan 2014" (PDF). pp. 18, Table 2.8 "Mean Age of First Marriage". Retrieved 27 February 2015.CS1 maint: multiple names: authors list (link)
- Assaad, Ragui (17 April 2014). The Jordanian Labor Market in the New Millennium. OUP Oxford. p. 193. ISBN 978-0191006593.
- Lebanese Women: A Diminishing Marriage Market - AUB Press Release http://staff.aub.edu.lb/~webbultn/v8n2/article21.htm
- Department of Statistics, Malaysia "Archived copy". Archived from the original on 13 November 2011. Retrieved 8 November 2011.CS1 maint: archived copy as title (link). Accessed 8 November 2011.
- Date (13 June 2011). "Mongolia National Census 2010 Preliminary Results" (PDF). National Statistical Office of Mongolia. Retrieved 14 June 2011.
- (Released: 27 March 2013) "Archived copy". Archived from the original on 13 March 2016. Retrieved 7 December 2017.CS1 maint: archived copy as title (link)
- Median age at first marriage for citizens, Department of Statistics, Singapore "404 Not Found" (PDF). Archived from the original (PDF) on 19 January 2016. Retrieved 7 February 2016.. Page 21, Accessed 7 February 2016.
- Statistics Korea
- LibertyTimes Archived 14 April 2015 at the Wayback Machine
- United Nations Economic Commission for Europe "Mean age at first marriage by sex". Accessed 21 May 2011.
- "Tổng điều tra dân số và nhà ở Việt Nam năm 2009: Các kết quả chủ yếu". Tổng Cục Thống kê Việt Nam. p. 142. Retrieved 30 January 2014.
- "Marriage indicators". Eurostat. European Commission. 10 August 2016. Archived from the original on 6 October 2014. Retrieved 18 September 2016.
- "Archived copy". Archived from the original on 15 June 2013. Retrieved 12 February 2016.CS1 maint: archived copy as title (link)
- "Marriages 2019". Central Statistics Office. Central Statistics Office.
- "Vârsta medie a tinerilor la prima căsătorie a crescut. Când își pun pirostriile moldovenii", TV8, Retrieved on 11 August 2019.
- Why Russians are delaying tying the knot Accessed 25 November 2014.
- ONS (March 2019). Marriages in England and Wales: 2016 (Report). ONS.CS1 maint: uses authors parameter (link)
- "3310.0 - Marriages and Divorces, Australia, 2015". www.abs.gov.au. Australian Bureau of Statistics. 30 November 2016. Retrieved 30 November 2016.
- Kiribati Demographic and Health Survey 2009 (Report). Kiribati National Statistics Office, and the Secretariat of the Pacific Community. 2010. p. 93. ISBN 978-982-00-0451-1.
- Republic of the Marshall Islands 2011 Census report (PDF) (Report). Economic Policy, Planning and Statistics Office, Republic of the Marshall Islands, and the SPC Statistics for Development Programme. 2012. p. 37. ISBN 978-982-00-0564-8. Retrieved 3 September 2016.
- Summary Analysis of Key Indicators from the FSM 2010 Census of Population and Housing (PDF) (Report). FSM Office of Statistics, Budget, Overseas Development Assistance and Compact. 2010. p. 8. Retrieved 3 September 2016.
- Republic of Nauru Demographic and Health Survey 2007 (Report). The Nauru Bureau of Statistics, the Secretariat of the Pacific Community, and Macro International Inc. 2009. p. 77. ISBN 978-982-00-0333-0.
- "Marriages, civil unions, and divorces: Year ended December 2017 | Stats NZ".
- Solomon Islands Demographic and Health Survey 2006-2007 (PDF) (Report). Secretariat of the Pacific Community Noumea, New Caledonia. May 2009. p. 100. ISBN 978-982-00-0361-3. Archived from the original (PDF) on 23 September 2016. Retrieved 3 September 2016.
- Tonga Demographic and Health Survey 2012 (PDF) (Report). Tonga Ministry of Health, Tonga Department of Statistics, the Secretariat of the Pacific Community, and United Nations Population Fund. 2014. p. 80. ISBN 978-982-00-0661. Retrieved 3 September 2016.CS1 maint: ignored ISBN errors (link)
- Tuvalu Demographic and Health Survey 2007 (PDF) (Report). Central Statistics Division, the Secretariat of the Pacific Community, and Macro International Inc. October 2009. p. 82. ISBN 978-982-00-0382-8. Retrieved 3 September 2016.
- Vanuatu Demographic and Health Survey 2013 (PDF) (Report). Vanuatu Ministry of Health, Vanuatu National Statistics Office, the Secretariat of the Pacific Community. 2014. p. xxiii. ISBN 978-982-00-0861-8. Archived from the original (PDF) on 20 September 2016. Retrieved 3 September 2016.
External links
- United Nations World Marriage Patterns 2000 (archived from the original on December 25, 2003)
- Europe: Eurostat numbers for 2006 (archived from the original on March 20, 2009)
- Age at first marriage: interactive data visualizations
This article is issued from Wikipedia. The text is licensed under Creative Commons - Attribution - Sharealike. Additional terms may apply for the media files.