List of countries by population growth rate

This article includes a table of countries and self-governing dependent territories by annual population growth rate.

The population growth rate estimates (according to United Nations Population Prospects 2019) between 2015 and 2020.[1]
The 20 countries in the world in which the population has declined between 2010 and 2015
Historical Population Growth Rate (1950-1955) estimated by the UN.[2]

Methodology

The table below shows annual population growth rate history and projections for various areas, countries, regions and sub-regions from various sources for various time periods.

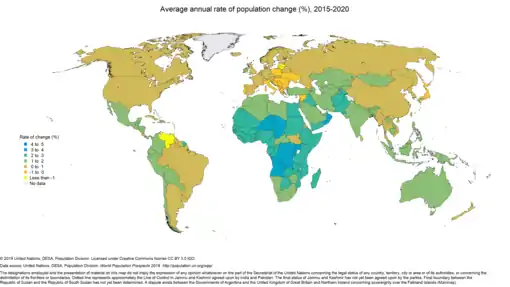
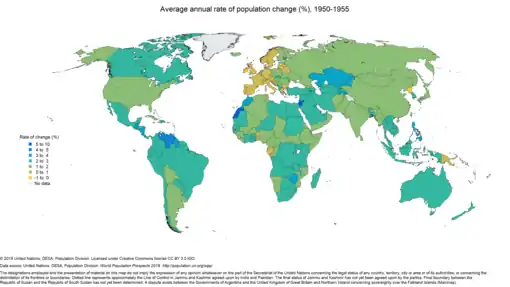
The right-most column shows a projection for the time period shown using the medium fertility variant. Preceding columns show actual history. The number shown is the average annual growth rate for the period.

Population is based on the de facto definition of population, which counts all residents regardless of legal status or citizenship—except for refugees not permanently settled in the country of asylum, who are generally considered part of the population of the country of origin. This means that population growth in this table includes net changes from immigration and emigration. For a table of natural increase, see List of countries by natural increase.


1
2
3
4
5
6
7
8
9
10
11
12
13
14
15
16
17
18
19
20
21
22
23
24
25
26
27
28
29
30
31
32
33
34
35
36
37
38
39
40
41
42
43
44
45
46
47
48
49
50
51
52
53
54
55
56
57
58
59
60
61
62
63
64
65
66
67
68
69
70
71
72
73
74
75
76
77
78
79
80
81
82
83
84
85
86
87
88
89
90
91
92
93
94
95
96
97
98
99
100
101
102
103
104
105
106
107
108
109
110
111
112
113
114
115
116
117
118
119
120
121
122
123
124
125
126
127
128
129
130
131
132
133
134
135
136
137
138
139
140
141
142
143
144
145
146
147
148
149
150
151
152
153
154
155
156
157
158
159
160
161
162
163
164
165
166
167
168
169
170
171
172
173
174
175
176
177
178
179
180
181
182
183
184
185
186
187
188
189
190
191
192
193
194
195
196
197
198
199
200
201
202
203
204
205
206
207
208
209
210
211
212
213
214
215
216
217
218
219
220
221
222
223
224
225
226
227
228
229
230
231
232
233
234
235
236
237
238
239
Country/ Region WB[3]
2009
(%)
CIA WF[4]
2012
(%)
CIA WF[5]
2014
(%)
UN[6]
2005–10
(%)
UN[6]
2010–15
(%)
UN[6]
2015–20
(%)
 Afghanistan 2.442.292.292.783.162.41
 Albania 0.260.300.30-0.92-0.120.13
 Algeria 1.891.881.881.631.981.67
 Andorra 0.630.170.171.37-1.59-0.21
 Angola 3.122.782.783.573.523.28
 Antigua and Barbuda 1.031.251.251.181.081.01
 Argentina 0.880.950.951.041.040.94
 Armenia 0.17-0.13-0.13-0.710.270.15
 Australia 1.601.091.091.781.461.30
 Austria 0.460.010.010.380.630.24
 Azerbaijan 1.350.990.991.131.260.98
 Bahamas 1.520.870.871.831.391.01
 Bahrain 1.922.492.496.672.014.26
 Bangladesh 1.191.601.601.181.161.04
 Barbados 0.500.330.330.400.330.24
 Belarus -0.10-0.19-0.19-0.310.03-0.15
 Belgium 0.850.050.050.730.630.58
 Belize 2.431.921.922.542.222.05
 Benin 2.732.812.812.842.792.73
 Bhutan 1.681.131.132.051.581.18
 Bolivia 1.651.601.601.671.561.47
 Bosnia and Herzegovina -0.14-0.11-0.11-0.32-1.03-0.22
 Botswana 0.861.261.261.641.841.79
 Brazil 0.870.800.801.030.910.75
 Brunei 1.401.651.651.251.431.25
 Bulgaria -0.60-0.83-0.83-0.74-0.62-0.67
 Burkina Faso 2.863.053.053.012.982.87
 Myanmar 0.851.031.030.680.880.90
 Burundi 3.193.283.283.333.033.15
 Cape Verde 0.781.391.391.25
 Cambodia 1.761.631.631.511.621.49
 Cameroon 2.542.602.602.732.682.56
 Canada 1.140.760.761.131.020.90
 Central African Republic 1.992.132.131.500.431.58
 Chad 3.001.921.923.323.293.01
 Chile 0.900.840.841.020.890.78
 China[7] 0.490.440.440.570.540.39
 Colombia 1.321.071.071.180.980.81
 Comoros[8] 2.441.871.872.402.402.24
 DR Congo 2.742.502.503.283.333.22
 Congo 2.611.941.942.982.602.59
 Costa Rica 1.421.241.241.351.120.96
 Ivory Coast 2.291.961.962.132.492.49
 Croatia -0.32-0.12-0.12-0.23-0.43-0.58
 Cuba -0.05-0.14-0.140.090.230.06
 Cyprus 1.111.481.481.590.850.78
 Czech Republic 0.180.170.170.540.130.06
 Denmark 0.360.220.220.490.480.38
 Djibouti 1.522.232.231.661.721.51
 Dominica 0.400.220.220.230.480.51
 Dominican Republic 1.261.251.251.381.241.07
 Ecuador 1.601.371.371.671.561.42
 Egypt 1.661.841.841.822.181.87
 El Salvador 0.660.270.270.450.470.52
 Equatorial Guinea 2.802.542.544.564.243.59
 Eritrea 3.282.302.302.021.982.28
 Estonia -0.04-0.68-0.68-0.35-0.25-0.23
 Eswatini (Swaziland) 1.541.141.141.681.841.75
 Ethiopia 2.582.892.892.672.602.43
 Fiji 0.780.700.700.910.740.72
 Finland 0.480.050.050.400.430.36
 France[9] 0.500.450.450.580.450.39
 Gabon 2.391.941.943.123.262.17
 Gambia 3.192.232.233.173.122.93
 Georgia 0.63-0.11-0.11-1.17-1.37-0.27
 Germany 0.11-0.18-0.18-0.190.200.20
 Ghana 2.172.192.192.582.362.16
 Greece -0.180.010.010.26-0.40-0.21
 Grenada 0.390.500.500.330.410.46
 Guatemala 2.531.861.862.222.101.94
 Guinea 2.562.632.632.182.272.57
 Guinea-Bissau 2.391.931.932.392.592.44
 Guyana 0.57-0.11-0.11-0.120.580.57
 Haiti 1.391.081.081.531.381.20
 Honduras 2.031.741.742.111.791.63
 Hungary -0.28-0.21-0.21-0.32-0.29-0.34
 Iceland 0.350.650.651.650.610.77
 India 1.261.251.251.461.231.10
 Indonesia 1.250.950.951.351.251.05
 Iran 1.321.221.221.141.251.04
 Iraq 2.542.232.232.603.212.78
 Ireland 0.261.201.201.870.310.78
 Israel 1.811.461.462.351.651.55
 Italy 0.320.300.300.31-0.08-0.13
 Jamaica 0.210.690.690.520.390.29
 Japan -0.20-0.13-0.130.03-0.09-0.23
 Jordan 2.193.863.864.574.862.17
 Kazakhstan 1.431.171.171.071.581.13
 Kenya 2.702.112.112.742.662.49
 Kiribati 1.541.181.182.121.821.71
 North Korea 0.530.530.530.340.420.47
 South Korea 0.450.160.160.570.520.36
 Kuwait 3.951.701.705.515.441.78
 Kyrgyzstan 1.221.041.041.321.571.44
 Laos 1.891.591.591.641.301.45
 Latvia -1.60-0.62-0.62-1.22-1.30-1.03
 Lebanon 0.969.739.371.685.990.57
 Lesotho 1.080.340.340.911.271.31
 Liberia 2.682.522.523.822.622.52
 Libya 0.843.083.081.260.211.33
 Liechtenstein 0.730.820.820.650.760.65
 Lithuania -1.48-0.29-0.29-1.36-1.27-0.55
 Luxembourg 2.491.121.122.082.191.27
 Madagascar 2.802.622.622.862.722.67
 Malawi 2.863.333.333.022.952.87
 Malaysia 1.661.471.471.831.781.35
 Maldives 1.93-0.09-0.092.682.761.85
 Mali 2.993.003.003.272.952.99
 Malta 0.400.330.330.450.550.31
 Marshall Islands 0.111.721.72-0.040.140.10
 Mauritania 2.492.262.262.852.952.69
 Mauritius 0.420.660.660.420.180.23
 Mexico 1.241.211.211.571.411.23
 Micronesia -0.03-0.42-0.42-0.490.160.63
 Moldova -0.04-1.02-1.02-0.36-0.09-0.24
 Monaco 0.850.060.061.860.650.51
 Mongolia 1.521.371.371.421.861.50
 Montenegro 0.07-0.49-0.490.260.120.04
 Morocco 1.431.021.021.201.431.26
 Mozambique 2.502.452.452.932.912.86
 Namibia 1.870.670.671.342.202.12
 Nauru 0.560.56-0.182.32-0.06
   Nepal 1.161.821.821.051.171.09
 Netherlands 0.450.420.420.360.300.29
 New Zealand[10] 0.630.830.831.101.090.93
 Nicaragua 1.461.021.021.291.171.07
 Niger 3.843.283.283.753.843.81
 Nigeria 2.792.472.472.642.672.58
 North Macedonia 0.080.210.210.100.080.08
 Norway 1.321.191.191.071.250.94
 Oman 9.132.062.063.836.454.08
 Pakistan 2.692.492.42.052.091.91
 Palau 0.720.370.370.560.791.06
 Palestine/Gaza Strip 3.012.912.91
 Panama 1.641.351.351.801.711.55
 Papua New Guinea 2.171.841.842.372.162.01
 Paraguay 1.721.191.191.381.341.25
 Peru 1.250.990.991.241.321.20
 Philippines 1.721.811.811.661.641.51
 Poland 0.02-0.11-0.11-0.02-0.03-0.17
 Portugal -0.290.120.120.16-0.44-0.39
 Qatar 7.053.583.5814.936.652.36
 Romania -0.27-0.29-0.29-0.95-0.56-0.50
 Russia 0.40-0.03-0.03-0.070.040.01
 Rwanda 2.772.632.632.612.532.36
 Saint Kitts and Nevis 1.150.780.781.131.080.91
 Saint Lucia 0.890.350.351.060.530.45
 Saint Vincent and the Grenadines 0.01-0.29-0.290.100.030.24
 Samoa 0.780.590.590.690.800.65
 San Marino 0.640.870.871.241.160.51
 São Tomé and Príncipe 2.651.891.892.322.252.18
 Saudi Arabia 1.881.491.492.752.811.90
 Senegal 2.922.482.482.762.962.77
 Serbia -0.48-0.46-0.46-0.41-0.40-0.34
 Seychelles 0.390.870.870.590.500.50
 Sierra Leone 1.912.332.332.652.282.12
 Singapore 2.451.921.922.441.741.40
 Slovakia 0.220.030.030.020.130.04
 Slovenia 0.26-0.23-0.230.480.290.07
 Solomon Islands 2.132.072.072.322.141.94
 Somalia 2.861.751.752.932.862.93
 South Africa 1.18-0.48-0.481.101.391.20
 South Sudan 4.304.124.333.322.72
 Spain 0.090.810.811.21-0.170.03
 Sri Lanka 1.040.860.860.680.500.35
 Sudan 2.081.781.782.132.342.38
 Suriname 0.901.121.121.061.010.87
 Sweden 0.710.790.790.760.780.72
  Switzerland 1.070.780.781.111.210.83
 Syria 1.97-9.73-9.732.78-2.300.20
 Taiwan 0.250.250.440.330.28
 Tajikistan 2.451.751.752.182.242.06
 Tanzania 3.042.802.803.143.123.06
 Thailand 0.310.350.350.540.430.22
 East Timor 2.882.442.441.562.242.14
 Togo 2.602.712.712.702.632.45
 Tonga 0.370.090.090.600.420.86
 Trinidad and Tobago 0.33-0.11-0.110.480.480.26
 Tunisia 0.970.920.921.041.161.09
 Turkey 1.281.121.121.261.581.37
 Turkmenistan 1.291.141.141.351.801.61
 Tuvalu 0.160.800.800.990.870.88
 Uganda 3.353.243.243.453.373.23
 Ukraine -0.25-0.64-0.64-0.48-0.50-0.49
 United Arab Emirates 3.102.712.7111.822.031.39
 United Kingdom 0.750.540.540.980.650.58
 United States 0.740.770.770.900.720.71
 Uruguay 0.350.260.260.290.340.36
 Uzbekistan 1.470.930.931.521.591.41
 Vanuatu 2.242.012.012.422.262.10
  Vatican City 0.000.000.030.030.08
 Venezuela 1.531.421.421.611.411.26
 Vietnam 1.061.001.000.961.121.00
 Western Sahara (Sahrawi) 2.892.891.871.832.54
 Yemen 2.332.722.722.742.622.33
 Zambia 3.192.882.882.783.012.97
 Zimbabwe 2.704.364.361.702.272.28
 Anguilla (UK) 2.062.061.711.19
 Aruba (Netherlands) 0.441.361.360.310.45
 Bermuda (UK) 0.370.520.52-0.36-0.62
Caribbean Netherlands 7.493.43
 Cayman Islands (UK) 1.702.142.142.651.55
Channel Islands ( UK) [11] 0.510.580.360.670.51
 Christmas Island (Australia) 1.11
 Cook Islands (NZ) -3.00-3.000.890.53
 Curaçao (Netherlands) 0.732.631.26
 Faroe Islands (Denmark) 0.010.01-0.590.33
 Falkland Islands -0.090.490.490.10-0.15
 Gibraltar (UK) 0.250.251.110.94
 Greenland (Denmark) -0.110.020.02-0.14-0.13
 Guadeloupe (France) 0.270.50
 Guam (USA) 1.210.440.440.131.27
 French Guiana 2.782.78
 Hong Kong 1.170.410.410.440.83
 Isle of Man (UK) 0.740.800.800.970.80
 Kosovo 0.86
 Macau 1.900.830.832.661.89
 Martinique (France) -0.120.09
 Mayotte (France) 3.172.79
 Montserrat (UK) 0.480.480.720.68
 New Caledonia (France) 1.601.421.421.491.32
 Niue (New Zealand) -0.03-0.03-0.79-0.14
 Norfolk Island (Australia) 0.01
 Northern Mariana Islands (USA) 0.141.131.13-3.570.44
 Pitcairn Islands (UK) 0.000.00
 French Polynesia 1.080.970.971.011.07
 Puerto Rico (USA) -0.73-0.65-0.65-0.28-0.14
 Réunion (France) 0.960.73
 Saint Helena & dependencies (UK) 0.270.27-0.48-1.04
 Saint Pierre and Miquelon (France) -1.02-1.020.050.05
 American Samoa -0.26-0.35-0.35-1.21-0.04
 Sint Maarten (Netherlands) 1.510.363.13
 Svalbard (Norway) -0.03
 Tokelau (NZ) -0.01-0.01-1.281.93
 Turks and Caicos Islands (UK) 2.192.582.583.172.05
 British Virgin Islands 2.362.363.232.02
 U.S. Virgin Islands -0.48-0.56-0.56-0.26-0.02
 Wallis and Futuna (France) 0.330.33-0.98-0.62
Asia/Other non-specified areas 0.430.16
 World1.151.17-1.231.191.09

See also

References

  1. PNG | Maps
  2. Maps | PNG
  3. "World Bank Population growth (annual %)". Retrieved 4 October 2014.
  4. "The World Factbook". Retrieved 4 October 2014.
  5. CIA The World Factbook: Population growth rate. Retrieved 11/08/2015.
  6. "United Nations Population Div, World Population Prospects 2017, File: Population Growth Rate, retrieved 5/20/18". Archived from the original on 2016-09-27.
  7. Mainland only. Excludes SARs
  8. Includes Mayotte
  9. Metropolitan France only
  10. Recent official estimates show a growth rate of 1.00 per Statistics New Zealand Archived 2008-02-14 at the Wayback Machine
  11. Consists of  Jersey and  Guernsey
This article is issued from Wikipedia. The text is licensed under Creative Commons - Attribution - Sharealike. Additional terms may apply for the media files.