List of countries by suicide rate
The following are lists of countries by suicide rate as published by the World Health Organization (WHO) and other sources.[note 1]
About one person in 5,000–15,000 dies by suicide every year, with an estimated global rate of 10.5 per 100,000 population[3] down from 11.6 in 2008.[4] In high-income modernised countries male and female rates of suicidal behaviors differ much compared to those in the rest of the world: while women are reportedly more prone to suicidal thoughts, rates of suicide are higher among men (suicide in men has been described as a “silent epidemic”).[5][6][7][8][9] The most suicidal country in the entire world is by a wide margin Greenland, after its last decades modernizing transformation from remote colony to welfare state, with a male-female ratio of 2.99.[10][11] India, of the South Asia region, is the greatest contributor to the absolute number of suicide deaths.[12] Europe is the most suicidal region in the world, while the Eastern Mediterranean is the least.[13][14]
According to a recent study, the global rates of suicide death have fallen by a third between 1990 and 2016, while the absolute number of suicide deaths increased by 6.7%, from 762,000 to 817,000 annually. Worldwide, the rates in 2016 were about 16 deaths per 100,000 men and 7 deaths per 100,000 women: women also experienced a greater decrease compared with men over the study period.[15][16]
In much of the world, suicide is stigmatized and condemned for religious or cultural reasons. In some countries, suicidal behavior is a criminal offence punishable by law. Suicide is therefore often a secretive act surrounded by taboo, and may be unrecognized, misclassified or deliberately hidden in official records of death.[5]
— World Health Organization (2002)
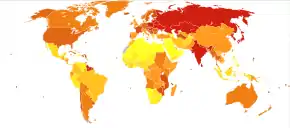
List by the World Health Organization (2016)
| Suicide |
|---|
Source: World Health Organization[note 2][note 3]
| WHO region | Crude rateu | Age-standardized rateu | Crude male rateu | Crude female rateu | Male–female ratiou |
|---|---|---|---|---|---|
Europe[note 4] | 15.4 | 12.85 | 24.7 | 6.6 | 3.74 |
Southeast Asia | 13.2 | 13.40 | 14.8 | 11.6 | 1.28 |
| 10.6 | 10.53 | 13.5 | 7.7 | 1.75 | |
Western Pacific | 10.2 | 8.45 | 10.9 | 9.4 | 1.16 |
Americas | 9.8 | 9.25 | 15.1 | 4.6 | 3.28 |
Africa | 7.4 | 11.96 | 9.9 | 4.8 | 2.06 |
Eastern Mediterranean | 3.9 | 4.30 | 5.1 | 2.7 | 1.89 |
| Income group (% of global pop) | Suicides, 2012 (in thousands) | Global % | Rate (2012) | Male:Female (2012) |
|---|---|---|---|---|
| High-income countries (18.3%) | 197 | 24.5% | 12.7 | 3.5 : 1 |
| Upper-middle-income countries (34.3%) | 192 | 23.8% | 7.5 | 1.3 : 1 |
| Lower-middle-income countries (35.4%) | 333 | 41.4% | 14.1 | 1.7 : 1 |
| Low-income countries (12.0%) | 82 | 10.2% | 13.4 | 1.7 : 1 |
| Global (100.0%) | 804 | 100.0% | 11.4 | 1.9 : 1 |
Male and female suicide rates are out of total male population and total female population, respectively (i.e. total number of male suicides divided by total male population). Age-standardized rates account for the influence that different population age distributions might have on the analysis of crude death rates, statistically addressing the prevailing trends by age-groups and populations' structures, to enhance long term cross-national comparability: based on age-groups' deviation from standardized population structures, rates are rounded up or down (age-adjustment). Basically, the presence of younger individuals in any given age structure carries more weight: if the rate is rounded up that means the median age is lower than average for that region (or country), and vice versa when rounded down.
Most countries listed below report a higher male suicide rate, as worldwide there are about 3 male suicides out of 4, or a factor of 3:1 (for example,[20] in the United States was 3.36 in 2015, and 3.53 in 2016).[lower-alpha 1]
Though age-standardization is common statistical process to categorize mortality data for comparing purposes this approach by WHO is based on estimates which take into account issues such as under-reporting, resulting in rates differing from the official national statistics prepared and endorsed by individual countries (and revisions are also performed periodically). Also, age-adjusted rates are mortality rates that would have existed if all populations under study had the same age distribution as a "standard" population. Plain, crude estimated rates are available at here and here. Countries with a population less than 100 000 are excluded.
| Both sexes rank |
Country | Continent | Both sexes | Males | Females | Male:Female ratio | ||
|---|---|---|---|---|---|---|---|---|
| Rank | Number | Rank | Number | |||||
| 1 | South America | 30.2 | 3 | 46.6 | 5 | 14.2 | 3.28 | |
| 2 | Africa | 28.9 | 25 | 22.7 | 1 | 32.6 | 0.7 | |
| 3 | Europe | 26.5 | 1 | 48.3 | 31 | 7.5 | 6.44 | |
| 4 | Europe | 25.7 | 2 | 47.5 | 37 | 6.7 | 7.09 | |
| 5 | South America | 23.2 | 6 | 36.1 | 13 | 10.9 | 3.31 | |
| 6 | Africa | 23.0 | 8 | 32.0 | 8 | 13.0 | 2.46 | |
| 7 | Asia | 22.8 | 4 | 40.1 | 28 | 7.7 | 5.21 | |
| 8 | Africa | 22.0 | 9 | 31.3 | 15 | 10.8 | 2.9 | |
| 9 | Europe | 21.4 | 5 | 39.3 | 45 | 6.2 | 6.34 | |
| 10 | Asia | 20.2 | 11 | 29.6 | 11 | 11.6 | 2.55 | |
| 11 | Africa | 20.0 | 37 | 21.2 | 2 | 18.7 | 1.13 | |
| 12 | Africa | 19.5 | 13 | 26.9 | 10 | 12.5 | 2.15 | |
| 13 | Africa | 19.1 | 12 | 29.1 | 12 | 11.1 | 2.62 | |
| 14 | Europe | 18.5 | 7 | 34.5 | 81 | 4.7 | 7.34 | |
| 15 | Africa | 17.3 | 56 | 17.5 | 3 | 17.1 | 1.02 | |
| 16 | Europe | 17.2 | 10 | 31.0 | 71 | 5.1 | 6.08 | |
| 17 | Africa | 16.7 | 17 | 25.4 | 17 | 9.6 | 2.65 | |
| 18 | Africa | 16.6 | 25 | 22.7 | 13 | 10.9 | 2.08 | |
| 19 | Asia | 16.5 | 46 | 18.5 | 4 | 14.5 | 1.28 | |
| 19 | South America | 16.5 | 14 | 26.8 | 34 | 7.1 | 3.77 | |
| 21 | Africa | 16.1 | 50 | 18.2 | 5 | 14.2 | 1.28 | |
| 22 | Africa | 15.7 | 27 | 22.6 | 17 | 9.6 | 2.35 | |
| 22 | Europe | 15.7 | 31 | 22.2 | 19 | 9.4 | 2.36 | |
| 24 | Africa | 15.5 | 63 | 17.1 | 7 | 13.8 | 1.24 | |
| 25 | Oceania | 15.2 | 15 | 25.9 | 63 | 5.4 | 4.8 | |
| 26 | Africa | 15.1 | 19 | 24.1 | 28 | 7.7 | 3.13 | |
| 27 | Africa | 15.0 | 24 | 23.1 | 28 | 7.7 | 3 | |
| 28 | Africa | 14.8 | 28 | 22.4 | 20 | 9.1 | 2.46 | |
| 29 | Europe | 14.4 | 16 | 25.6 | 89 | 4.4 | 5.82 | |
| 30 | Asia | 14.3 | 40 | 20.5 | 25 | 8.1 | 2.53 | |
| 31 | Asia | 14.2 | 22 | 23.3 | 45 | 6.2 | 3.76 | |
| 32 | Europe | 13.8 | 39 | 20.8 | 36 | 6.8 | 3.06 | |
| 32 | Africa | 13.8 | 28 | 22.4 | 53 | 6.1 | 3.67 | |
| 34 | North America | 13.7 | 38 | 21.1 | 42 | 6.4 | 3.3 | |
| 35 | Europe | 13.6 | 31 | 22.2 | 45 | 6.2 | 3.58 | |
| 36 | North America | 13.5 | 18 | 24.8 | 90 | 4.3 | 5.77 | |
| 37 | Africa | 13.4 | 87 | 13.8 | 8 | 13.0 | 1.06 | |
| 37 | Europe | 13.4 | 19 | 24.1 | 99 | 3.8 | 6.34 | |
| 37 | Europe | 13.4 | 21 | 23.9 | 115 | 3.4 | 7.03 | |
| 40 | Europe | 13.3 | 34 | 21.7 | 81 | 4.7 | 4.62 | |
| 40 | Europe | 13.3 | 28 | 22.4 | 88 | 4.5 | 4.98 | |
| 40 | Asia | 13.3 | 22 | 23.3 | 99 | 3.8 | 6.13 | |
| 43 | South America | 12.9 | 64 | 16.9 | 21 | 8.9 | 1.9 | |
| 43 | Asia | 12.9 | 36 | 21.4 | 79 | 4.8 | 4.46 | |
| 43 | North America | 12.9 | 33 | 21.9 | 90 | 4.3 | 5.09 | |
| 46 | Africa | 12.8 | 34 | 21.7 | 71 | 5.1 | 4.25 | |
| 47 | North America | 12.2 | 48 | 18.3 | 42 | 6.4 | 2.86 | |
| 48 | Europe | 12.1 | 52 | 17.9 | 40 | 6.5 | 2.75 | |
| 49 | North America | 11.9 | 43 | 19.2 | 74 | 5.0 | 3.84 | |
| 50 | Africa | 11.8 | 41 | 20.3 | 68 | 5.2 | 3.9 | |
| 51 | Europe | 11.7 | 69 | 15.8 | 32 | 7.4 | 2.14 | |
| 51 | Oceania | 11.7 | 59 | 17.4 | 56 | 6.0 | 2.9 | |
| 53 | Asia | 11.6 | 87 | 13.8 | 21 | 8.9 | 1.55 | |
| 53 | Oceania | 11.6 | 60 | 17.3 | 45 | 6.2 | 2.79 | |
| 53 | Africa | 11.6 | 51 | 18.0 | 56 | 6.0 | 3 | |
| 56 | Africa | 11.5 | 48 | 18.3 | 61 | 5.7 | 3.21 | |
| 56 | Europe | 11.5 | 44 | 18.8 | 71 | 5.1 | 3.69 | |
| 56 | Africa | 11.5 | 42 | 19.4 | 76 | 4.9 | 3.96 | |
| 59 | Europe | 11.4 | 56 | 17.5 | 61 | 5.7 | 3.07 | |
| 59 | Africa | 11.4 | 45 | 18.7 | 81 | 4.7 | 3.98 | |
| 61 | Europe | 11.3 | 69 | 15.8 | 35 | 6.9 | 2.29 | |
| 61 | Africa | 11.3 | 56 | 17.5 | 45 | 6.2 | 2.82 | |
| 61 | Oceania | 11.3 | 67 | 16.2 | 45 | 6.2 | 2.61 | |
| 64 | Africa | 11.1 | 54 | 17.6 | 63 | 5.4 | 3.26 | |
| 65 | Africa | 11.0 | 64 | 16.9 | 56 | 6.0 | 2.82 | |
| 66 | Europe | 10.9 | 60 | 17.3 | 68 | 5.2 | 3.33 | |
| 66 | Europe | 10.9 | 54 | 17.6 | 94 | 4.2 | 4.19 | |
| 68 | Asia | 10.6 | 78 | 14.8 | 26 | 8.0 | 1.85 | |
| 69 | Africa | 10.5 | 100 | 12.7 | 23 | 8.4 | 1.51 | |
| 69 | Europe | 10.5 | 62 | 17.2 | 94 | 4.2 | 4.1 | |
| 69 | North America | 10.5 | 52 | 17.9 | 118 | 3.2 | 5.59 | |
| 72 | North America | 10.4 | 72 | 15.1 | 59 | 5.8 | 2.6 | |
| 72 | Europe | 10.4 | 73 | 15.0 | 59 | 5.8 | 2.59 | |
| 74 | Europe | 10.1 | 91 | 13.6 | 40 | 6.5 | 2.09 | |
| 74 | North America | 10.1 | 66 | 16.4 | 96 | 4.1 | 4 | |
| 74 | Europe | 10.1 | 47 | 18.4 | 137 | 2.6 | 7.08 | |
| 77 | Africa | 10.0 | 98 | 12.8 | 33 | 7.3 | 1.75 | |
| 78 | Asia | 9.8 | 93 | 13.4 | 45 | 6.2 | 2.16 | |
| 79 | Africa | 9.7 | 73 | 15.0 | 76 | 4.9 | 3.06 | |
| 79 | South America | 9.7 | 68 | 16.0 | 99 | 3.8 | 4.21 | |
| 81 | Asia | 9.6 | 112 | 11.4 | 26 | 8.0 | 1.43 | |
| 81 | Europe | 9.6 | 96 | 12.9 | 42 | 6.4 | 2.02 | |
| 81 | Africa | 9.6 | 81 | 14.3 | 63 | 5.4 | 2.65 | |
| 81 | Africa | 9.6 | 73 | 15.0 | 90 | 4.3 | 3.49 | |
| 85 | Africa | 9.5 | 80 | 14.5 | 85 | 4.6 | 3.15 | |
| 86 | South America | 9.3 | 104 | 12.3 | 45 | 6.2 | 1.98 | |
| 86 | Asia | 9.3 | 96 | 12.9 | 53 | 6.1 | 2.11 | |
| 86 | Africa | 9.3 | 85 | 13.9 | 74 | 5.0 | 2.78 | |
| 89 | Europe | 9.2 | 94 | 13.2 | 68 | 5.2 | 2.54 | |
| 90 | Europe | 9.1 | 90 | 13.6 | 79 | 4.8 | 2.83 | |
| 90 | Asia | 9.1 | 78 | 14.8 | 105 | 3.7 | 4 | |
| 90 | South America | 9.1 | 73 | 15.0 | 113 | 3.5 | 4.29 | |
| 93 | Africa | 9.0 | 109 | 11.5 | 37 | 6.7 | 1.72 | |
| 94 | Africa | 8.9 | 92 | 13.5 | 81 | 4.7 | 2.87 | |
| 94 | Africa | 8.9 | 83 | 14.0 | 85 | 4.6 | 3.04 | |
| 96 | Africa | 8.7 | 69 | 15.8 | 128 | 2.9 | 5.45 | |
| 97 | Europe | 8.6 | 82 | 14.3 | 99 | 3.8 | 3.76 | |
| 98 | Africa | 8.5 | 107 | 11.9 | 67 | 5.3 | 2.25 | |
| 99 | Africa | 8.4 | 83 | 14.0 | 96 | 4.1 | 3.41 | |
| 100 | Africa | 8.3 | 109 | 11.5 | 63 | 5.4 | 2.13 | |
| 100 | Africa | 8.3 | 73 | 15.0 | 152 | 2.1 | 7.14 | |
| 102 | Asia | 8.1 | 152 | 6.3 | 16 | 9.8 | 0.64 | |
| 103 | Asia | 8.0 | 143 | 7.9 | 24 | 8.3 | 0.95 | |
| 103 | Europe | 8.0 | 85 | 13.9 | 141 | 2.4 | 5.79 | |
| 105 | Asia | 7.9 | 114 | 11.1 | 76 | 4.9 | 2.27 | |
| 105 | Europe | 7.9 | 102 | 12.6 | 108 | 3.6 | 3.5 | |
| 105 | Europe | 7.9 | 95 | 13.1 | 118 | 3.2 | 4.09 | |
| 108 | Africa | 7.8 | 89 | 13.7 | 118 | 3.2 | 4.28 | |
| 109 | Europe | 7.6 | 107 | 11.9 | 113 | 3.5 | 3.4 | |
| 110 | Africa | 7.5 | 106 | 12.1 | 108 | 3.6 | 3.36 | |
| 110 | North America | 7.5 | 98 | 12.8 | 143 | 2.3 | 5.57 | |
| 112 | Africa | 7.4 | 132 | 8.9 | 53 | 6.1 | 1.46 | |
| 112 | Asia | 7.4 | 121 | 10.3 | 85 | 4.6 | 2.24 | |
| 114 | Africa | 7.3 | 103 | 12.5 | 147 | 2.2 | 5.68 | |
| 114 | North America | 7.3 | 100 | 12.7 | 152 | 2.1 | 6.05 | |
| 116 | South America | 7.2 | 117 | 10.7 | 99 | 3.8 | 2.82 | |
| 116 | Asia | 7.2 | 115 | 11.0 | 105 | 3.7 | 2.97 | |
| 116 | Europe | 7.2 | 113 | 11.3 | 118 | 3.2 | 3.53 | |
| 119 | Oceania | 7.0 | 123 | 10.2 | 99 | 3.8 | 2.68 | |
| 119 | Asia | 7.0 | 116 | 10.8 | 115 | 3.4 | 3.18 | |
| 119 | South America | 7.0 | 109 | 11.5 | 130 | 2.8 | 4.11 | |
| 122 | Africa | 6.9 | 120 | 10.5 | 108 | 3.6 | 2.92 | |
| 123 | Asia | 6.7 | 104 | 12.3 | 160 | 1.9 | 6.47 | |
| 124 | Europe | 6.5 | 121 | 10.3 | 130 | 2.8 | 3.68 | |
| 125 | Asia | 6.4 | 130 | 9.0 | 105 | 3.7 | 2.43 | |
| 125 | Europe | 6.4 | 118 | 10.6 | 139 | 2.5 | 4.24 | |
| 125 | Asia | 6.4 | 118 | 10.6 | 152 | 2.1 | 5.05 | |
| 128 | Asia | 6.2 | 134 | 8.7 | 108 | 3.6 | 2.42 | |
| 128 | Europe | 6.2 | 126 | 9.7 | 127 | 3.0 | 3.23 | |
| 130 | Asia | 6.1 | 155 | 5.5 | 37 | 6.7 | 0.82 | |
| 130 | Africa | 6.1 | 139 | 8.3 | 96 | 4.1 | 2.02 | |
| 130 | Europe | 6.1 | 129 | 9.3 | 124 | 3.1 | 3 | |
| 130 | South America | 6.1 | 126 | 9.7 | 130 | 2.8 | 3.46 | |
| 134 | Asia | 5.9 | 130 | 9.0 | 118 | 3.2 | 2.81 | |
| 134 | Oceania | 5.9 | 137 | 8.5 | 118 | 3.2 | 2.66 | |
| 134 | North America | 5.9 | 125 | 9.9 | 158 | 2.0 | 4.95 | |
| 137 | Asia | 5.8 | 147 | 7.3 | 173 | 1.1 | 6.64 | |
| 138 | Asia | 5.7 | 143 | 7.9 | 152 | 2.1 | 3.76 | |
| 138 | Europe | 5.7 | 124 | 10.1 | 158 | 2.0 | 5.05 | |
| 140 | Europe | 5.6 | 150 | 7.0 | 90 | 4.3 | 1.63 | |
| 140 | Africa | 5.6 | 126 | 9.7 | 152 | 2.1 | 4.62 | |
| 142 | Europe | 5.5 | 138 | 8.4 | 137 | 2.6 | 3.23 | |
| 142 | Oceania | 5.5 | 133 | 8.8 | 139 | 2.5 | 3.52 | |
| 142 | Africa | 5.5 | 134 | 8.7 | 143 | 2.3 | 3.78 | |
| 145 | Oceania | 5.4 | 142 | 8.1 | 134 | 2.7 | 3 | |
| 145 | Oceania | 5.4 | 134 | 8.7 | 147 | 2.2 | 3.95 | |
| 147 | Asia | 5.2 | 140 | 8.2 | 141 | 2.4 | 3.42 | |
| 147 | North America | 5.2 | 140 | 8.2 | 143 | 2.3 | 3.57 | |
| 149 | South America | 5.1 | 145 | 7.6 | 134 | 2.7 | 2.81 | |
| 150 | Asia | 4.5 | 153 | 6.2 | 130 | 2.8 | 2.21 | |
| 150 | Asia | 4.5 | 148 | 7.2 | 160 | 1.9 | 3.79 | |
| 152 | Africa | 4.4 | 148 | 7.2 | 163 | 1.7 | 4.24 | |
| 152 | North America | 4.4 | 145 | 7.6 | 171 | 1.2 | 6.33 | |
| 154 | Asia | 4.1 | 164 | 4.7 | 115 | 3.4 | 1.38 | |
| 155 | Asia | 4.0 | 161 | 4.9 | 124 | 3.1 | 1.58 | |
| 155 | Oceania | 4.0 | 157 | 5.2 | 128 | 2.9 | 1.79 | |
| 157 | Europe | 3.8 | 154 | 6.1 | 170 | 1.5 | 4.07 | |
| 157 | South America | 3.8 | 151 | 6.6 | 171 | 1.2 | 5.5 | |
| 159 | Asia | 3.7 | 164 | 4.7 | 134 | 2.7 | 1.74 | |
| 159 | Asia | 3.7 | 157 | 5.2 | 143 | 2.3 | 2.26 | |
| 159 | Asia | 3.7 | 157 | 5.2 | 147 | 2.2 | 2.36 | |
| 162 | Asia | 3.5 | 163 | 4.8 | 177 | 0.9 | 5.33 | |
| 163 | North America | 3.4 | 156 | 5.3 | 163 | 1.7 | 3.12 | |
| 163 | Asia | 3.4 | 166 | 4.6 | 163 | 1.7 | 2.71 | |
| 165 | Africa | 3.3 | 161 | 4.9 | 162 | 1.8 | 2.72 | |
| 165 | Asia | 3.3 | 160 | 5.0 | 163 | 1.7 | 2.94 | |
| 167 | Africa | 3.2 | 167 | 4.4 | 147 | 2.2 | 2 | |
| 167 | Asia | 3.2 | 170 | 4.2 | 147 | 2.2 | 1.91 | |
| 169 | Africa | 3.1 | 179 | 2.5 | 108 | 3.6 | 0.69 | |
| 169 | Asia | 3.1 | 177 | 3.0 | 124 | 3.1 | 0.97 | |
| 169 | Africa | 3.1 | 170 | 4.2 | 152 | 2.1 | 2 | |
| 172 | North America | 2.9 | 167 | 4.4 | 163 | 1.7 | 2.59 | |
| 173 | Asia | 2.7 | 174 | 3.6 | 169 | 1.6 | 2.25 | |
| 173 | Asia | 2.7 | 175 | 3.5 | 181 | 0.8 | 4.38 | |
| 175 | Asia | 2.6 | 169 | 4.3 | 175 | 1.0 | 4.3 | |
| 176 | Asia | 2.4 | 173 | 3.8 | 173 | 1.1 | 3.45 | |
| 176 | North America | 2.4 | 172 | 3.9 | 177 | 0.9 | 4.33 | |
| 178 | Asia | 2.2 | 179 | 2.5 | 163 | 1.7 | 1.47 | |
| 179 | North America | 2.0 | 176 | 3.2 | 177 | 0.9 | 3.56 | |
| 180 | North America | 1.7 | 181 | 2.1 | 175 | 1.0 | 2.1 | |
| 181 | North America | 1.6 | 178 | 2.8 | 182 | 0.5 | 5.6 | |
| 182 | North America | 0.5 | 183 | 0.0 | 177 | 0.9 | 0 | |
| 183 | North America | 0.4 | 182 | 0.8 | 183 | 0.3 | 2.67 | |
- The male-female ratio shown below is based on the age-standardized rates: as compared to WHO world standard population, women's median age and life expectancy might be greater than that of men's for that country when rounded up, and vice versa when rounded down.[21]
- Suicide attempts are illegal and punishable by imprisonment or other penalties in this country. This may lead to underreporting of suicides, and may bring into question the reliability of suicide-related statistics (particularly in countries with low reported suicide rates). See also Suicide legislation.
List by other sources and years (1985–2019)
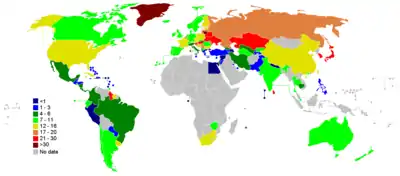
In this list various sources from various years are included, mixing plain crude rates with age-adjusted rates and estimated rates, so cross-national comparability is somewhat skewed.
| Regions | Male | Female | Average | Year |
|---|---|---|---|---|
| 84.99 | 28.44 | 58.28 (0.0583%) | 2016 | |
| 65.1 | 12.4 | 24.4 (0.02827%) | 2018 | |
| 38.0 | 15.8 | 26.9 (0.0269%) | 2019 | |
| 41.25 | 10.20 | 25.52 (0.0255%) | 2017 | |
| 40.68 | 8.01 | 23.81 (0.0238%) | 2017 | |
| 18.09 (0.018%) | 2016 | |||
| 14.6 (0.0146%) | 2018 | |||
| 17.98 (0.01798%) | 2016 | |||
| 20.5 (0.0205%) | 2017 | |||
| 20.1 (0.0201%) | 2018 | |||
| 22.4 (0.0224%) | 2016 | |||
| 18 (0.018%) | 2018 | |||
| 18.56 (0.0185%) | 2016 | |||
| 15.9 (0.0159%) | 2016 | |||
| 13.52 (0.0135%) | 2016 | |||
| 17.0 (0.0170%) | 2016 | |||
| 23.1 | 10.1 | 16.5 (0.0165%) | 2018 | |
| 21.8 | 11.1 | 16.4 (0.0164%) | 2018 | |
| 16 (0.016%) | 2016 | |||
| 12.16 (0.0121%) | 2017 | |||
| 23.8 | 7.1 | 13.69 (0.01369%) | 2016 | |
| 15.4 (0.0154%) | 2005 | |||
| 14.31 (0.0143%) | 2016 | |||
| 13.21 (0.01321%) | 2016 | |||
| 23.9 | 4.8 | 14.4 (0.0144%) | 2005 | |
| 22.3 | 6.9 | 14.26 (0.01426%) | 2016 | |
| 10.33 (0.0103%) | 2016 | |||
| 21.8 | 6.0 | 14.5 (0.0145%) | 2017 | |
| 12.28 (0.0138%) | 2016 | |||
| 13.7 (0.0137%) | 2017 | |||
| 13.6 (0.0136%) | 2012 | |||
| 12.57 (0.01257%) | 2016 | |||
| 11.29 (0.01129%) | 2016 | |||
| 19.0 | 5.5 | 12.3 (0.0123%) | 2008 | |
| 9.24 (0.0092%) | 2016 | |||
| 19.0 | 5.8 | 12.3 (0.0123%) | 2014–15 | |
| 16.2 | 8.8 | 12.3 (0.0123%) | 2011 | |
| 11.73 (0.01173%) | 2016 | |||
| 8.95 (0.00895%) | 2016 | |||
| 10.13 (0.01013%) | 2016 | |||
| 12.08 (0.01208%) | 2016 | |||
| 11.2 | 2018 | |||
| 16.9 | 5.3 | 11.5 (0.0115%) | 2009 | |
| 12.3 (0.0123%) | 2016 | |||
| 18.2 | 4.2 | 11.2 (0.0112%) | 2007 | |
| 17 | 5.8 | 11.2 (0.0112%) | 2011 | |
| 18.0 | 6.0 | 12.0 (0.0012%) | 2015 | |
| 17.9 | 3.8 | 10.7 (0.0107%) | 2006 | |
| 13.0 | 7.8 | 10.5 (0.0105%) | 2009 | |
| 17.4 | 3.4 | 10.3 (0.0103%) | 2013 | |
| 13.3 | 7.3 | 10.3 (0.0103%) | 2012 | |
| 12.7(0.012%) | 2017 | |||
| 7.48 (0.0074%) | 2016 | |||
| 9.8 (0.0098%) | 2014 | |||
| 9.5 (0.0095%) | 2019 | |||
| 14.1 | 3.6 | 8.8 (0.0088%) | 2009 | |
| 13.8 | 3.5 | 8.6 (0.0086%) | 1998 | |
| 12.7 | 4.1 | 8.3 (0.0083%) | 2013 | |
| 12.6 | 3.9 | 8.0 (0.008%) | 2009 | |
| 12.9 | 3.6 | 8.0 (0.008%) | 2008 | |
| 12.7 | 3.8 | 8.0 (0.0080%) | 2016 | |
| 10.6 | 5.2 | 7.9 (0.0079%) | 1990 | |
| 13.2 | 2.9 | 7.8 (0.0078%) | 2008 | |
| 12.6 | 3.0 | 7.7 (0.0077%) | 2008 | |
| 10.5 | 3.6 | 7.1 (0.0071%) | 2009 | |
| 11.8 | 1.9 | 6.8 (0.0068%) | 2008 | |
| 10.2 | 1.9 | 6.1 (0.0061%) | 2009 | |
| 9.7 | 2.58 | 6.03 (0.0613%) | 2013 | |
| 8.6 | 3.1 | 5.85 (0.0058%) | 2011 | |
| 9.9 | 2.1 | 5.8 (0.0058%) | 2007 | |
| 9.0 | 2.6 | 5.8 (0.0058%) | 2006 | |
| 9.0 | 1.9 | 5.5 (0.0055%) | 2008 | |
| 7.9 | 2.0 | 4.9 (0.0049%) | 2007 | |
| 7.7 | 2.0 | 4.8 (0.0048%) | 2008 | |
| 3.9 | 2.1 | 4.8 (0.0048%) | 2013 | |
| 7.0 | 2.3 | 4.7 (0.0047%) | 2005 | |
| 4.6 (0.0046%) | 2008 | |||
| 7.1 | 1.7 | 4.3 (0.0043%) | 2009 | |
| 6.34 | 1.90 | 4.12 (0.00412%) | 2019 | |
| 4.7 | 3.3 | 4.0 (0.004%) | 2003 | |
| 6.8 | 1.3 | 4.0 (0.004%) | 2008 | |
| 3.84 (0.00384%) | 2011 | |||
| 4.0 | 3.5 | 3.8 (0.0038%) | 2006 | |
| 6.6 | 0.7 | 3.7 (0.0037%) | 2008 | |
| 5.4 | 1.9 | 3.7 (0.0037%) | 2008 | |
| 5.1 | 2.0 | 3.6 (0.0036%) | 2008 | |
| 5.9 | 1.3 | 3.6 (0.0036%) | 2009 | |
| 5.6 | 1.7 | 3.6 (0.0036%) | 2008 | |
| 7.3 | 0.0 | 3.5 (0.0035%) | 2006 | |
| 6.1 | 1.0 | 3.5 (0.0035%) | 2009 | |
| 5.9 | 1.0 | 3.4 (0.0034%) | 2008 | |
| 4.5 | 1.0 | 2.75 (0.00275%) | 2005 | |
| 2.9 | 2.3 | 2.6 (0.0026%) | 2001 | |
| 4.9 | 0.0 | 2.4 (0.0024%) | 2005 | |
| 3.9 | 0.7 | 2.3 (0.0023%) | 2005 | |
| 2.8 | 1.1 | 1.9 (0.0019%) | 2008 | |
| 1.9 | 1.7 | 1.8 (0.0018%) | 2009 | |
| 1.9 | 0.6 | 1.2 (0.0012%) | 2005 | |
| 1.45 | 0.71 | 1.10 (0.0011%) | 2012 | |
| 1.1 | 0.6 | 0.9 (0.0009%) | 2000 | |
| 0.0 | 1.8 | 0.9 (0.0009%) | 1987 | |
| 1.0 | 0.3 | 0.6 (0.0006%) | 2007 | |
| 0.7 | 0.0 | 0.3 (0.0003%) | 2005 | |
| 0.3 | 0.0 | 0.1 (0.0001%) | 1990 | |
| 0.2 | 0.0 | 0.1 (0.0001%) | 1985 | |
| 0.2 | 0.0 | 0.1 (0.0001%) | 2008 | |
| 0.1 | 0.0 | 0.1 (0.0001%) | 2009 | |
| 0.0 | 0.0 | 0.0 (0%) | 2008 | |
| 0.0 | 0.0 | 0.0 (0%) | 1995 | |
| 0.0 | 0.0 | 0.0 (0%) | 1995 | |
| 0.0 | 0.0 | 0.0 (0%) | 2003 | |
| 0.0 | 0.0 | 0.0 (0%) | 2003 |
See also
Notes
- The first global estimates on suicide mortality began in the early 1990s, as a single World Bank-commissioned study on general mortality data compiled by the WHO as the first work of its kind on the global burden of disease (GBD).[1] In the following years, the Institute for Health Metrics and Evaluation acted as the coordinating center for the study then resulted in the collaboration between several researchers and institutions from many countries.[2]
- Data revised in April 2017 and April 2018. Revision for 2015 rates is available at World Health Organization's website, including year 2016 rates.[17]
- To proportion and compare the prevalence of suicide for different countries, WHO adjusts for age (age-standardization) every country's crude mortality rate based on demographic parameters and general mortality data (life expectancy) including other relevant statistical data such as median population ages, sex ratios and age distribution (i.e. age-groups) and its future development, enhancing long term cross-national comparability. Another way to think of it, is that since populations age structures are often very different, but the likelihood of dying by suicide is generally increased with age, in order to avoid masking the sensible differences given by each country's age distributions, countries' rates are reciprocally weighted into the overall trend to globally frame national suicide rates, and the epidemiological prevalence of suicide. Age-standardization works over time as a measure of the prevalence of suicide across diversely populated countries, by rounding down when populations are composed of a higher percentage of older people compared to the "standard" population, and vice versa.
- Europe is the most suicidal region of the world according to crude rates.[14][13]
- In government's annual release, there were 3637 people per one hundred thousands of people in 2018 died of contacting poison, accidental fall, exposure to fire or smoke, accidental drowning including sinking beneath water to death in addition to the suicidal death that was equal to 3865 people per 100,000 people.[36] Nevertheless, jumping from a high building as well as drowning were commom methods of suicide in Taiwan,[37] indicating the potential risks of type I and type II errors and misuse of statistics within the gorvernment's report. Hence, if halves of the death rates of the drowning and fall that were shown in government's report were extracted and added into the self-inflicted deaths (intentional injury death of self), it yields 0.0201% which is thought better reflecting the real case.
- Recently released figures by official Belgian authorities suggest a considerably higher rate of 17.0 persons (total) per 100,000 people per annum in 2009 (5,712 cases in a population of 10,749,000 (=10,666,866 as of 1 January 2008 increasing by 0,77% per annum.) as of 1 January 2009)."Toenemend aantal zelfdodingen in Belgie" (in Dutch). 2011. Archived from the original on 5 December 2012.
- The number of death in Belgium in 2008 due to suicide "zichzelf schade toebrengen" was reported at 2000 out of a total of 103.760 death. These death comprise 1453 men and 547 women. This puts the suicide rate at about 19 per 100.000. See statbel: http://statbel.fgov.be/nl/binaries/NL%20-%20Tableau%201%2E3_T_2008_tcm325-168456.pdf Archived 28 September 2013 at the Wayback Machine
- In government's annual release, there were 3637 people per one hundred thousands people in 2018 died of contacting poison, accidental fall, exposure to fire or smoke, accidental drowning, or sinking beneath water that were excluded from the statistical suicidal death figure equal to 3865 people per 100,000 people.[36] Furthermore, jumping from a high building as well as drowning were commom methods of suicide in Taiwan.[37]
- The updated figure of suicide rates in Belgium for 2011 is 2,084 with a total population of 10,933,607, equivalent to 18.96 per 100,000 inhabitants (source: Het Nieuwsblad, 10 April 2014).
- Taiwan is not a member of the WHO. The Taiwanese government adopted the WHO standard in 2007. According to the Taiwanese government's self-released data, the figure is standardized based upon the population within Taiwan.[83][84]
References
- "About the Global Burden of Disease (GBD) project". World Health Organization.
- "GBD History". Institute for Health Metrics and Evaluation.
- "With one suicide every 40 seconds, WHO urges action". 10 September 2019.
- Värnik, P (March 2012). "Suicide in the world". International Journal of Environmental Research and Public Health. 9 (3): 760–71. doi:10.3390/ijerph9030760. PMC 3367275. PMID 22690161.
- WHO (2002). "Self-directed violence" (PDF). www.who.int.
- Colby Itkowitz (31 August 2016). "Men die by suicide at alarming rates. This hashtag tells men 'it's okay to talk' about their emotions". Washington Post.
- John R. Cutcliffe (Editor), José Santos (Editor), Paul S. Links (Editor), Juveria Zaheer (Editor) (2016). Routledge International Handbook of Clinical Suicide Research. Routledge. ISBN 9781134459292.CS1 maint: multiple names: authors list (link) CS1 maint: extra text: authors list (link)
- Jodi O'Brien (Editor) (2009). Encyclopedia of Gender and Society (p. 817). SAGE Publications. ISBN 9781452266022.CS1 maint: extra text: authors list (link)
- Dan Bilsker, PhD, Jennifer White, EdD (2011). "The silent epidemic of male suicide". www.bcmj.org. BCMJ.CS1 maint: multiple names: authors list (link)
- "The Suicide Capital of the World". Retrieved 13 March 2013.
- "GBD Results Tool".
- "GBD Result Tool". HealthData.org. Retrieved 14 June 2020.
- "2015 Suicide rates per (100 000 population) Crude rates Data by WHO region". WHO. Retrieved 26 March 2018.
- "Suicide rate is highest in Europe: UN health agency report". euronews. 18 May 2017.
- Global rates of suicide death have fallen by a third since 1990, study finds
- Global, regional, and national burden of suicide mortality 1990 to 2016: systematic analysis for the Global Burden of Disease Study 2016
- "Suicide rates, crude - Data by WHO region, 2015 (updated April 2018)". WHO. 17 April 2018.
- "Suicide rates, age standardized - Data by WHO Region". WHO (archived on 17 January 2018). 2015. Archived from the original on 17 January 2018. Retrieved 13 April 2017.
- World Health Organization (2014). "Preventing suicide - A global imperative" (PDF). www.who.int.
- "Suicide Statistics — AFSP". American Foundation for Suicide Prevention.
- "Suicide rates, crude - Data by country". World Health Organization. 2016. Retrieved 20 October 2018.
- "Suicide rates Data by country". World Health Organization. 2016. Retrieved 23 September 2018.
- Värnik, P. (2012). "Suicide in the World". International Journal of Environmental Research and Public Health. 9 (12): 760–71. doi:10.3390/ijerph9030760. PMC 3367275. PMID 22690161.
- Unless otherwise stated all statistics are from WHO: "Suicide rates per 100,000 by country, year and sex (Table)". World Health Organization. 2011. Archived from the original on 22 January 2012. Retrieved 26 January 2012.
- "The Arctic Suicides: It's Not The Dark That Kills You". NPR.org. 21 April 2016. Retrieved 19 July 2019.
- "Rising suicide rate baffles Greenland". Retrieved 13 March 2013.
- "StatBank Greenland - Suicide by methode, place, age, time and sex [SUELDM2]".
- "Tables, Graphs and Maps Interface (TGM) table". Eurostat. Retrieved 19 July 2019.
- "Savižudybių statistika;". 15min. Retrieved 18 August 2020.
- "2019년 사망원인 통계". Statistics Korea (in Korean). 통계청. 2019. Retrieved 22 September 2020.
- "Trying To Stop Suicide: Guyana Aims To Bring Down Its High Rate". NPR.org. 29 June 2018. Retrieved 19 July 2019.
- "GBD Results Tool".
- "Suicide Rate By Country 2019". 2019 World Population by Country. 22 June 2019. Retrieved 19 July 2019.
- Wijesiri, Lionel (8 September 2018). "Rising suicide rate: too many questions, not enough answers". Daily News. Retrieved 19 July 2019.
- "National Statistical Committee of the Republic of Belarus (for 2017);" (PDF) (in Russian). Belstat. Archived from the original (PDF) on 14 May 2018. Retrieved 14 May 2018.
- "107年國人死因統計結果- 衛生福利部". 衛生福利部 (in Chinese). 21 June 2019. Retrieved 22 June 2019.
- Lung, F.-W.; Liao, S.-C.; Wu, C.-Y.; Lee, M.-B. (2017). "The effectiveness of suicide prevention programmes: urban and gender disparity in age-specific suicide rates in a Taiwanese population". Public Health. Elsevier BV. 147: 136–143. doi:10.1016/j.puhe.2017.01.030. ISSN 0033-3506. PMID 28404489.
- Хаустова О. О. World_Bank
- "Uruguay presenta una de las tasas más altas de suicidio en Latinoamérica" (in Spanish). Uruguay. 18 July 2013. Retrieved 12 February 2016.
- WHO
- WB
- "Eurostat - Tables, Graphs and Maps Interface (TGM) table". Retrieved 25 May 2016.
- "Death Due To Suicide". Eurostat. European Commission. 2009. Retrieved 10 January 2010.
- 厚生労働省>白書・統計>各種統計調査>厚生労働統計一覧>1.人口・世帯>人口動態統計特殊報告>自殺死亡統計>12. 統計表>第1表 総死亡数・死亡率(人口10万対)・自殺死亡数・死亡率(人口10万対)の年次推移
- "厚生労働省>分野別の政策一覧>福祉・介護>生活保護・福祉一般>自殺対策>自殺統計>各年の状況>平成30年中における自殺の状況>第3章 平成30年中における自殺の内訳>33p 補表1-1 年次別自殺者数、34p 補表2-1 年齢階級別自殺者数の推移、35p 補表2-2 年齢階級別自殺死亡率" (PDF). mhlw.go.jp. Retrieved 11 October 2019.
- "Odsjek za mentalne poremećaje s registrom za psihoze i registrom izvršenih samoubojstava" (in Croatian). HZJZ. Archived from the original on 28 March 2016.
- "World Suicide Death Rate Rankings (WHO)". 16 December 2018.
- Burrows, Stephanie; Laflamme, Lucie (February 2006). "Suicide Mortality in South Africa". Social Psychiatry and Psychiatric Epidemiology. 41 (2): 108–114. doi:10.1007/s00127-005-0004-4. PMID 16362168. S2CID 123246.. This data is for urban areas only. The data available for the whole of South Africa in 2007 are: men 1.4, women 0.4, total 0.9 (source: WHO)
- "Archived copy". Archived from the original on 14 November 2012. Retrieved 26 April 2013.CS1 maint: archived copy as title (link)
- "Number of suicides 1921-2014, Statistics Finland". 30 December 2015.
- Värnik, P (2 March 2012). "Suicide in the World- Table 2 - Suicide by gender and age groups in WHO regions, estimates for 2008". Int J Environ Res Public Health. 9 (3): 760–71. doi:10.3390/ijerph9030760. PMC 3367275. PMID 22690161.
- "Suicide and Self-Inflicted Injury-FastStats". Centers for Disease Control and Prevention. 27 June 2019. Retrieved 16 July 2019.
- Howard, Jacqueline (20 June 2019). "The US suicide rate is up 33% since 1999". CNN. Retrieved 16 July 2019.
- "Suicide Statistics". AFSP. 16 February 2016. Retrieved 16 July 2019.
- "Seasonality of Suicides among Victims Who Are under the Influence of Alcohol". Int. J. Environ. Res. Public Health 2019, 16(15), 2806. MDPI. Retrieved 15 August 2019.
- "INFORMATION ABOUT THE MORTALITY OF THE POPULATION FOR THE CAUSES OF DEATH FOR THE RUSSIAN FEDERATION - January - December 2017" (in Russian). Rosstat. Retrieved 29 January 2018.
- SRNA (16 April 2012). "BiH: Prošle godine ubilo se 507 lica, od čega 16 maloletnika". SRNA. Archived from the original on 27 September 2013. Retrieved 4 December 2012.
- "Health - Causes of Death in Germany" (PDF) (in German). 2013.
- "NZ suicide rates rise for first time in four years". New Zealand Herald. 6 October 2015. ISSN 1170-0777. Retrieved 6 October 2015.
- "Chief Coroner releases provisional annual suicide figures for the 2014/15 year". Coronial Services of New Zealand. 6 October 2015. Retrieved 12 February 2016.
- "Centre for Suicide Research and Prevention". Hong Kong. 2013.
- "Dödsorsaker 2012" [Causes of Death 2012] (PDF). www.socialstyrelsen.se - 6 August 2013.pdf (in Swedish and English). Statistics Sweden. 2013. Archived from the original (PDF) on 19 October 2014. Retrieved 13 September 2014.
- Sociedade Portuguesa de Suicidologia. "Estatística - Sociedade Portuguesa de Suicidologia". Retrieved 25 May 2016.
- https://www.ons.gov.uk/peoplepopulationandcommunity/birthsdeathsandmarriages/deaths/bulletins/suicidesintheunitedkingdom/2018registrations
- "Suicides and suicide rate, by sex and by age group, Canada".
- "36 died from own hand". Hagstofa Íslands/Statistical Bureau of Iceland. Morgunblaðið. 2010. Retrieved 21 September 2010.
- statistique, Office fédéral de la. "Développement durable". www.bfs.admin.ch. Archived from the original on 4 March 2016. Retrieved 15 October 2014.
- Central Statistics Office. "Vital Statistics - Fourth Quarter and Yearly Summary - 2013" (PDF).
- Samaritians of Singapore. "Suicide Statistics in Singapore" (PDF). Archived from the original (PDF) on 29 October 2013.
- "Back from the edge - The first of two articles on China's suicide rate looks at the effect of urbanisation". The Economist. 28 June 2014.
- https://es.panampost.com/sabrina-martin/2020/01/02/hecho-en-socialismo-en-2019-tasa-de-suicidios-rompio-record-en-venezuela/
- "Suicides and suicide rate, by sex and by age group, Spain". 27 June 2015.
- "Suicide Rates: Thailand". Archived from the original on 6 March 2016.
- "Suicide in Israel - 1981-2009 Suicides, Suicide Attempts 2004-2010" (PDF) (in Hebrew). Retrieved 9 September 2013.
- "Iranian Legal Medicine Organization". 2013. Archived from the original on 12 January 2014. Retrieved 12 January 2014. www.lmo.ir
- "Tehran has the highest rate of suicide in Iran" (in Persian). Bahar Newspaper. 2013. Archived from the original on 20 September 2013. via Google Translate
- "TÜİK - Statistics Data Portal". www.tuik.gov.tr.
- "WHO | Suicide rates per 100,000 by country, year and sex (Table)". Who.int. 7 December 2009. Archived from the original on 27 September 2010. Retrieved 30 September 2010.
- "Mortalidad y otros (Mortality and others)" (PDF). IUDPAS. 1 March 2011. Archived from the original (PDF) on 28 September 2013. Retrieved 22 January 2013.
- Chief, Barbara Mae Dacanay, Bureau (17 July 2012). "Suicide rate has steadily risen in Philippines for 21 years — report".
- Based on a population of 180.4 million in 2012 (Population Reference Bureau), a sex ratio of 1.06 males/female (CIA World Factbook, 2013) and figures from 'State of Human Rights in 2012' by the Human Rights Commission of Pakistan: 1,976 persons committed suicide in 2012 across the country of which 626 were women.
- "Suicide rates (per 100,000), by gender, Jordan, 1965-2008" (PDF). World Health Organization.
- "Kaohsiung City Government". Archived from the original on 25 July 2019. Retrieved 25 July 2019.
- "Kaohsiung city government II". Archived from the original on 25 July 2019. Retrieved 25 July 2019.
External links
- Suicide rates by country, 1950-2011 published by the World Health Organization (WHO).
- Top Ten Most Suicidal Countries published by International Business Times