List of countries by literacy rate
This is a list of countries by literacy rate. The figures represented are almost entirely collected by the UNESCO Institute for Statistics (UIS) on behalf of UNESCO with 2015 estimates based on people aged 15 or over who can read and write. Where data is taken from a different source, notes are provided. The data is collated by mostly using surveys within the last ten years which are self-declared by the persons in question.[1] UIS provide estimates based on these for the year 2015 with a Global Age-specific Literacy Projections Model (GALP).[2]
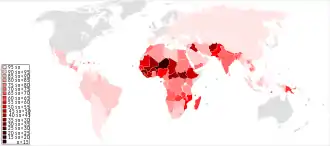
The global literacy rate for all people aged 15 and above is 86.3%. The global literacy rate for all males is 90.0% and the rate for all females is 82.7%. The rate varies throughout the world with developed nations having a rate of 99.2% (2013); South and West Asia having 70.2% (2015) and sub-Saharan Africa at 64.0% (2015).[3] Over 75% of the world's 781 million illiterate adults are found in South Asia, West Asia and sub-Saharan Africa and women represent almost two-thirds of all illiterate adults globally.[4]
List of UN member states by age group and gender disparity
Data published by UNESCO in 2018 (last informed rates and year), using the following definitions:[5]
Youth: Percentage of people aged 15 to 24 years who can both read and write with understanding a short simple statement on their everyday life. Generally, ‘literacy’ also encompasses ‘numeracy’, the ability to make simple arithmetic calculations
Adult: Percentage of the population aged 15 years and over who can both read and write with understanding a short simple statement on his/her everyday life. Generally, ‘literacy’ also encompasses ‘numeracy’, the ability to make simple arithmetic calculations
Elderly: Percentage of the population aged 65 years and over who can both read and write with understanding a short simple statement on their everyday life. Generally, ‘literacy’ also encompasses ‘numeracy’, the ability to make simple arithmetic calculations
Gender Parity Index (GPI): The gender parity index (GPI) of the youth literacy rate is the ratio of the female to male literacy rates of the population aged 15 to 24 years. A GPI value between 0.97 and 1.03 is usually interpreted to indicate gender parity.
|
| ||||||||||||||||||||||||||||||||||||||||||||||||||||||||||||||||||||||||||||||||||||||||||||||||||||||||||||||||||||||||||||||||||||||||||||||||||||||||||||||||||||||||||||||||||||||||||||||||||||||||||||||||||||||||||||||||||||||||||||||||||||||||||||||||||||||||||||||||||||||||||||||||||||||||||||||||||||||||||||||||||||||||||||||||||||||||||||||||||||||||||||||||||||||||||||||||||||||||||||||||||||||||||||||||||||||||||||||||||||||||||||||||||||||||||||||||||||||||||||||||||||||||||||||||||||||||||||||||||||||||||||||||||||||||||||||||||||||||||||||||||||||||||||||||||||||||||||||||||||||||||||||||||||||||||||||||||||||||||||||||||||||||||||||||||||||||||||||||||||||||||||||||||||||||||||||||||||||||||||||||||||||||||||||||||||||||||||||||||||||||||||||||||||||||||||||||||||||||||||||||||||||||||||||||||||||||||||||||||||||||||||||||||||||||||||||||||||||||||||||||||||||||||||||||||||||||||||||||||||||||||||||||||||||||||||||||||||||||||||||||||||||||||||||||||||||||||||||||||||||
List of UN member and observer states by adult literacy rate
| Country | UNESCO[3] | Non-UNESCO literacy rate | ||||
|---|---|---|---|---|---|---|
| Literacy rate (all) | Male literacy | Female literacy | Gender difference[note 1] | |||
| 86.3% | 90.0% | 82.7% | 7.3% | |||
| 38.2% | 52.0% | 24.2% | 27.8% | |||
| 97.6% | 98.4% | 96.8% | 1.6% | |||
| 80.2% | 87.2% | 73.1% | 14.0% | 87.7%[11] | ||
| not reported by UNESCO 2015 | ||||||
| 71.1% | 82.0% | 60.7% | 21.3% | |||
| not reported by UNESCO 2015 | 99.0%(2013)[3][note 2] | |||||
| 98.1% | 98.0% | 98.1% | -0.1% | |||
| 99.8% | 99.8% | 99.7% | 0.1% | |||
| not reported by UNESCO 2015 | ||||||
| not reported by UNESCO 2015 | ||||||
| 99.8% | 99.9% | 99.7% | 0.2% | |||
| not reported by UNESCO 2015 | ||||||
| 95.7% | 96.9% | 93.5% | 3.5% | |||
| 73.9% (Year-2018)[note 3] | 76.7% | 71. 2% | 5.5% | 73.9% ( Bangladesh Bureau of Statistics sample vital statistics for 2018) | ||
| not reported by UNESCO 2015 | ||||||
| 99.7% | 99.8% | 99.7% | 0.1% | |||
| not reported by UNESCO 2015 | ||||||
| 82.7% | 82.3% | 83.0% | -0.7% | |||
| 38.4% | 49.9% | 27.3% | 22.6% | |||
| 64.9% | 73.1% | 55.0% | 18.1% | |||
| 95.7% | 97.8% | 93.6% | 4.2% | |||
| 98.5% | 99.5% | 97.5% | 2.1% | 97.2% (2013)[12][note 4] | ||
| 88.5% | 88.0% | 88.9% | -0.9% | |||
| 91.7% | 91.4% | 92.1% | -0.7% | |||
| 96.4% | 97.7% | 95.1% | 2.6% | |||
| 98.4% | 98.7% | 98.1% | 0.7% | |||
| 36% | 43.0% | 29.3% | 13.7% | |||
| 85.6% | 88.2% | 83.1% | 5.1% | |||
| 87.6% | 92.1% | 83.1% | 9.0% | |||
| 77.2% | 84.5% | 70.5% | 13.9% | |||
| 75% | 81.2% | 68.9% | 12.3% | |||
| not reported by UNESCO 2015 | ||||||
| 36.8% | 50.7% | 24.4% | 26.4% | |||
| 40.2% | 48.5% | 31.9% | 16.6% | |||
| 97.3% | 97.4% | 97.2% | 0.2% | |||
| 96.4% | 98.2% | 94.5% | 3.7% | |||
| 94.7% | 94.6% | 94.8% | -0.2% | |||
| 77.8% | 81.8% | 73.7% | 8.1% | |||
| 79.3% | 86.4% | 72.9% | 13.6% | |||
| 77.3% | 88.9% | 66.0% | 22.8% | |||
| 97.8% | 97.7% | 97.8% | -0.1% | |||
| 43.1% | 53.1% | 32.5% | 20.6% | |||
| 99.3% | 99.7% | 98.9% | 0.7% | |||
| 99.7% | 99.7% | 99.8% | -0.1% | |||
| 99.1% | 99.5% | 98.7% | 0.8% | |||
| not reported by UNESCO 2015 | ||||||
| not reported by UNESCO 2015 | ||||||
| not reported by UNESCO 2015 | ||||||
| not reported by UNESCO 2015 | ||||||
| 91.8% | 91.2% | 92.3% | -1.1% | |||
| 94.5% | 95.4% | 93.5% | 1.8% | |||
| 75.2% | 83.2% | 67.3% | 16.0% | |||
| 88.4% | 90.7% | 86.4% | 4.3% | |||
| 95.3% | 97.4% | 93.0% | 4.4% | |||
| 73.8% | 82.4% | 65.5% | 16.9% | |||
| 99.8% | 99.8% | 99.8% | 0.0% | |||
| 49.1% | 57.2% | 41.1% | 16.1% | |||
| not reported by UNESCO 2015 | ||||||
| not reported by UNESCO 2015 | ||||||
| not reported by UNESCO 2015 | ||||||
| 83.2% | 85.3% | 81.0% | 4.3% | |||
| 55.5% | 63.9% | 47.6% | 16.3% | |||
| 99.8% | 99.8% | 99.7% | 0.1% | |||
| not reported by UNESCO 2015 | ||||||
| 76.6% | 82.0% | 71.4% | 10.7% | |||
| 97.7% | 98.5% | 96.9% | 1.6% | |||
| not reported by UNESCO 2015 | ||||||
| 79.3% | 84.7% | 74.4% | 10.4% | |||
| 30.4% | 38.1% | 22.8% | 15.3% | |||
| 59.9% | 71.8% | 48.3% | 23.5% | |||
| 88.5% | 87.2% | 89.8% | -2.6% | |||
| 60.7% | 64.3% | 57.3% | 7.0% | |||
| 88.5% | 88.4% | 88.6% | -0.1% | |||
| 99.1% | 99.1% | 99.0% | 0.2% | |||
| not reported by UNESCO 2015 | ||||||
| 77.7% (Year-2018)[note 5] | 82.37% | 65.79% | 16.6% | 77.7% (National Statistical Commission 2018 Survey) [13] | ||
| 93.9% | 96.3% | 91.5% | 4.7% | |||
| 86.8% | 91.2% | 82.5% | 8.7% | |||
| 43.7% | 43.0% | 38.0% | 5.0% | 78.5%[14] | ||
| not reported by UNESCO 2015 | ||||||
| not reported by UNESCO 2015 | 97.8% (2011)[4][note 6] | |||||
| 99.2% | 99.4% | 99.0% | 0.4% | |||
| 88.7% | 84.0% | 93.1% | -9.1% | |||
| not reported by UNESCO 2015 | ||||||
| 97.9% (in 2012) | 98.4% | 97.4% | 1.0% | |||
| 99.8% | 99.8% | 99.8% | 0.0% | |||
| 78% | 81.1% | 74.9% | 6.2% | |||
| not reported by UNESCO 2015 | ||||||
| 100.0% | 100.0% | 100.0% | 0.0% | |||
| not reported by UNESCO 2015 | ||||||
| 96.2% | 96.9% | 95.0% | 1.9% | |||
| 99.5% | 99.6% | 99.4% | 0.2% | |||
| 79.9% | 87.1% | 72.8% | 14.3% | |||
| 99.9% | 99.9% | 99.9% | 0.0% | |||
| 93.9% | 96.0% | 91.8% | 4.1% | |||
| 79.4% | 70.1% | 88.3% | -18.2% | |||
| 47.6% | 62.4% | 32.8% | 29.6% | |||
| 91% | 96.7% | 85.6% | 11.1% | |||
| not reported by UNESCO 2015 | ||||||
| 99.8% | 99.8% | 99.8% | 0.0% | |||
| not reported by UNESCO 2015 | ||||||
| 97.8% | 98.8% | 96.8% | 2.0% | |||
| 64.7% | 66.7% | 62.6% | 4.1% | |||
| 65.8% | 73.0% | 58.6% | 14.4% | |||
| 94.6% | 96.2% | 93.2% | 3.0% | |||
| 99.3% | 99.8% | 98.8% | 0.9% | |||
| 38.7% | 48.2% | 29.2% | 19.0% | |||
| 94.1% | 92.5% | 95.7% | -3.2% | |||
| not reported by UNESCO 2015 | ||||||
| 52.1% | 62.6% | 41.6% | 21.0% | |||
| 90.6% | 92.9% | 88.5% | 4.4% | |||
| 94.4% | 95.6% | 93.3% | 2.2% | |||
| not reported by UNESCO 2015 | ||||||
| 99.4% | 99.7% | 99.1% | 0.7% | |||
| not reported by UNESCO 2015 | ||||||
| 98.4% | 98.2% | 98.6% | -0.4% | |||
| 98.7% | 99.5% | 98.0% | 1.4% | |||
| 73.8%[9] | 83.3%[9] | 64.6%[9] | 18.7%[9] | |||
| 58.8% | 73.3% | 45.4% | 27.9% | |||
| 75.6%[note 7] | 80.0% | 71.9% | 8.1% | |||
| 81.9% | 79.2% | 84.5% | -5.3% | |||
| not reported by UNESCO 2015 | ||||||
| 64.7% | 75.6% | 55.1% | 20.5% | |||
| not reported by UNESCO 2015 | ||||||
| not reported by UNESCO 2015 | ||||||
| 82.8% | 82.4% | 83.2% | -0.9% | |||
| 19.1% | 27.3% | 11.0% | 16.3% | |||
| 59.6% | 69.2% | 49.7% | 19.5% | 71.6% (2010)[16][note 8] | ||
| not reported by UNESCO 2015 | ||||||
| 94.8% | 96.9% | 90.0% | 6.9% | |||
| 59.1% (Year-
2017) |
71.1% | 46.5% | 24.6% | 62.3% (2018)[17][note 9] | ||
| 99.5% | 99.5% | 99.6% | -0.1% | |||
| 95% | 95.7% | 94.4% | 1.2% | |||
| 64.2% | 65.6% | 62.8% | 2.8% | |||
| 95.6% | 96.1% | 95.0% | 1.1% | |||
| 94.5% | 97.3% | 91.7% | 5.6% | |||
| 96.3% | 95.8% | 96.8% | -1.0% | |||
| 99.8% | 99.9% | 99.7% | 0.2% | |||
| 95.4% | 96.9% | 94.1% | 2.8% | |||
| 96.7% | 98.5% | 94.8% | 3.7% | 2015[3] | UN Observer State[18] | |
| 97.8% | 97.9% | 97.3% | 0.6% | |||
| 98.8% | 99.1% | 98.5% | 0.6% | |||
| 99.7% | 99.7% | 99.7% | 0.0% | |||
| 70.5% | 73.2% | 68.0% | 5.2% | |||
| not reported by UNESCO 2015 | ||||||
| not reported by UNESCO 2015 | ||||||
| not reported by UNESCO 2015 | ||||||
| 99% | 98.9% | 99.1% | -0.2% | |||
| not reported by UNESCO 2015 | ||||||
| 74.9% | 81.8% | 68.4% | 13.4% | |||
| 94.7% | 97.0% | 91.1% | 5.9% | |||
| 55.7% | 68.5% | 43.8% | 24.6% | |||
| 98.1% | 99.1% | 97.2% | 1.9% | |||
| 95.2% | 94.7% | 95.7% | -1.0% | |||
| 48.1% | 58.7% | 37.7% | 21.1% | |||
| 96.8% | 98.7% | 95.1% | 3.6% | |||
| 99.6% | 99.6% | 99.6% | 0.0% | |||
| 99.7% | 99.7% | 99.7% | 0.0% | |||
| not reported by UNESCO 2015 | 84.1% (2015)[4][note 10] | |||||
| not reported by UNESCO 2015 | ||||||
| 94.4% | 95.5% | 93.1% | 2.4% | |||
| 26.8% | 34.8% | 19.2% | 15.6% | |||
| 98.1% | 98.7% | 97.5% | 1.3% | |||
| 92.6% | 93.6% | 91.7% | 1.9% | |||
| 53.5% | 59.80% | 46.7% | 13.1% | |||
| 95.6% | 96.1% | 95.0% | 1.1% | |||
| 87.5% | 87.4% | 87.5% | -0.1% | |||
| not reported by UNESCO 2015 | ||||||
| not reported by UNESCO 2015 | ||||||
| 86.4% | 91.7% | 81.0% | 10.7% | |||
| 99.8% | 99.8% | 99.7% | 0.1% | |||
| 80.3% | 84.8% | 75.9% | 9.0% | |||
| 96.7% | 96.6% | 96.7% | -0.1% | |||
| 67.5% | 71.5% | 63.4% | 8.1% | |||
| 66.5% | 78.3% | 55.3% | 23.0% | |||
| 99.4% | 99.3% | 99.4% | -0.1% | |||
| 99% | 99.2% | 98.7% | 0.5% | |||
| 81.8% | 89.6% | 74.2% | 15.4% | |||
| 95% | 98.4% | 91.8% | 6.6% | |||
| 99.7% | 99.8% | 99.6% | 0.1% | |||
| not reported by UNESCO 2015 | ||||||
| 73.9% | 80.8% | 66.9% | 14.0% | |||
| 99.8% | 99.8% | 99.7% | 0.1% | |||
| 93.8% | 93.1% | 95.8% | -2.6% | |||
| not reported by UNESCO 2015 | ||||||
| not reported by UNESCO 2015 | ||||||
| 98.4% | 98.1% | 98.7% | -0.6% | |||
| 99.6% | 99.7% | 99.5% | 0.3% | |||
| 85.2% | 86.6% | 83.8% | 2.8% | |||
| 95.4% | 95.0% | 95.7% | -0.7% | |||
| 94.5% | 96.3% | 92.8% | 3.4% | |||
| 70.1% | 85.1% | 55.0% | 30.1% | |||
| 63.4% | 70.9% | 56.0% | 14.9% | |||
| 86.5% | 88.5% | 84.6% | 4.0% | |||
List of other states and territories
See also
Notes
- Gender difference is calculated as the male literacy rate minus the female literacy rate. Negative values shows countries with higher female rates than male.
- The breakdown by gender is 98.4% male, 99.4% female (difference of -1.0%)
- Adult rate: 73.91%. By gender: M=76.67%,F=71.18%. All figures 2018, National estimates as published on UNESCO site.[3]
- Gender breakdown is 99.2% male and 95.2 for females. "Data on literacy were collected for persons aged 10 or more years who did not receive any kind of formal education or with incomplete primary education. A person capable of reading with understanding and writing a statement on his/her daily routine shall be considered to be a literate person."
- Adult rate: 74.37%. By gender: M=82.37%,F=65.79%. All figures 2018, UIS estimates as published on UNESCO site.[3]
- The breakdown by gender is 98.7% male, 95.8% female (difference of 2.9%)
- Adult rate: 75.55%. By gender: M=80.01%,F=71.85%. All figures 2016.[15]
- The breakdown by gender is 79.3% male, 63.7% female (difference is 15.6%)
- The breakdown by gender is 72.5% male, 51.8% female (difference is 20.7%)
- The breakdown by gender is 88.9% male, 79.2% female (difference is 9.7%)
References
- "Literacy Statistics Metadata Information Table". UNESCO Institute for Statistics. September 2015. Retrieved 19 November 2015.
- Lutz, Wolfgang & Scherbov, Sergei (July 2006). Global Age-specific Literacy Projections Model (GALP): Rationale, Methodology and Software (PDF). Adult Education and Literacy Statistics Programme. UNESCO Institute for Statistics.
- "Adult literacy rate, population 15+ years (both sexes, female, male)". UIS Data Centre. UNESCO. Retrieved 20 November 2019.
- "Country Comparison to the World of Literacy Rate". The World Factbook. Central Intelligence Agency. Retrieved 1 November 2015.
- "UIS Tellmaps". tellmaps.com. Retrieved 2018-11-02.
- "Literacy rate, youth total (% of people ages 15-24) - China | Data". data.worldbank.org. Retrieved 2020-01-05.
- "Literacy rate, adult total (% of people ages 15 and above) - China". data.worldbank.org. Retrieved 2020-01-05.
- "Literacy rate, youth (ages 15-24), gender parity index (GPI) - China | Data". data.worldbank.org. Retrieved 2020-01-05.
- "Morocco". uis.unesco.org. 2016-11-27. Retrieved 2021-01-19.
- "UIS Statistics". data.uis.unesco.org. Retrieved 2021-01-19.
- "Le taux d'analphabétisme a baissé à 12% en Algérie". La Tribune. 24 January 2017. Archived from the original on 22 October 2017. Retrieved 2 July 2017.
- "BiH Census 2013" (PDF). BHAS. 2016. p. 138.
- "International Literacy Day 2020: Andhra Pradesh worst, Delhi 2nd best – State wise literacy rate in India". www.timesnownews.com. Retrieved 2020-12-30.
- https://www.unicef.org/infobycountry/iraq_statistics.html
- http://data.uis.unesco.org/Index.aspx?DataSetCode=EDULIT_DS&popupcustomise=true&lang=en#
- "National Literacy Survey". National Bureau of Statistics. June 2010. Retrieved 5 September 2015.
- "Pakistan Economic Survey 2018-19 Chapter 10: Education" (PDF). Economic Survey of Pakistan. 2019-06-10. Retrieved 2019-07-07.
- "Non-member States". United Nations. Archived from the original on 9 May 2009. Retrieved 12 November 2015.
- "Republic of China's population over the age of 15 education statistics" (in Chinese). Ministry of the Interior. 25 February 2017. Archived from the original on 2017-04-24. Retrieved 23 April 2017.
External links
- World Bank – Literacy rate, adult total (% of people ages 15 and above), for historical use.