South Atlantic states
The South Atlantic United States form one of the nine Census Bureau Divisions within the United States that are recognized by the United States Census Bureau. This region, U.S. Census Bureau Region 3, Division 5, corresponds to the Old South with the addition of Florida.
Terminology
The name of the census division does not refer to the South Atlantic Ocean, but rather to its location along the Atlantic Coast of the United States. Farther north are the Census-defined Middle Atlantic and New England (or North Atlantic) States.
Geography
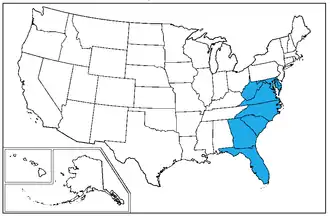
This division includes eight states and one district; Delaware, Florida, Georgia, Maryland, North Carolina, South Carolina, Virginia, West Virginia and the District of Columbia.[1] This division is also a recognized geographical division used by the United States Geological Survey.[2]:2 All entities within the region apart from the District of Columbia and West Virginia border the North Atlantic Ocean.
Together with the East South Central States (Alabama, Kentucky, Mississippi and Tennessee) and the West South Central States (Arkansas, Louisiana, Oklahoma and Texas), the South Atlantic States constitute the United States Census Bureau's broader Census Bureau Region of the South (the other three regions being the Northeast, Midwest and West, all of which have two divisions).
Demographics
As of 2010, the South Atlantic States had a combined population of 61,774,970. The South Atlantic States region covers 292,589 square miles (757,800 km2). With the exception of West Virginia, the region has seen rapid population growth and economic development in recent decades.
| State | 2010 Census | Land Area |
|---|---|---|
| Delaware | 917,072 | 1,982 |
| Florida | 19,552,860 | 65,755 |
| Georgia | 9,992,167 | 59,425 |
| Maryland | 5,928,814 | 12,407 |
| North Carolina | 9,848,060 | 53,819 |
| South Carolina | 4,774,839 | 32,020 |
| Virginia | 8,260,405 | 42,774 |
| West Virginia | 1,854,304 | 24,230 |
| Washington, D.C. | 646,449 | 177 |
| City | 2010 Pop. | |
|---|---|---|
| 1 | Jacksonville, Florida | 842,583 |
| 2 | Charlotte, North Carolina | 792,862 |
| 3 | Washington, D.C. | 646,449 |
| 4 | Baltimore, Maryland | 622,104 |
| 5 | Virginia Beach, Virginia | 448,479 |
| 6 | Atlanta, Georgia | 447,841 |
| 7 | Raleigh, North Carolina | 431,746 |
| 8 | Miami, Florida | 417,650 |
| 9 | Tampa, Florida | 352,957 |
| 10 | Greensboro, North Carolina | 279,639 |
| Metro Area | 2019 Est. | |
|---|---|---|
| 1 | Washington-Arlington-Alexandria, DC-VA-MD-WV MSA | 6,280,487 |
| 2 | Miami-Fort Lauderdale-West Palm Beach, FL MSA | 6,166,488 |
| 3 | Atlanta-Sandy Springs-Alpharetta, GA MSA | 6,020,364 |
| 4 | Tampa-St. Petersburg-Clearwater, FL MSA | 3,194,831 |
| 5 | Baltimore-Columbia-Towson, MD MSA | 2,800,053 |
| 6 | Charlotte-Concord-Gastonia, NC-SC MSA | 2,636,883 |
| 7 | Orlando-Kissimmee-Sanford, FL MSA | 2,608,147 |
| 8 | Virginia Beach-Norfolk-Newport News, VA-NC MSA | 1,768,901 |
| 9 | Jacksonville, FL MSA | 1,559,514 |
| 10 | Raleigh-Cary, NC MSA | 1,390,785 |
Politics in the Lower South Atlantic States
| Parties | ||||||||
| Nonpartisan | Democratic-Republican | Democratic | Nullifier | Whig | Republican | Liberal Republican | Dixiecrat | American Independent |
- Bold denotes election winner.
- Note: Election results for the Upper South Atlantic States (Delaware, Maryland, Virginia, West Virginia and Washington, D.C.) are included in the table of the Mid-Atlantic states article.
References
- "Census Regions and Divisions of the United States" Archived 2013-01-07 at the Library of Congress Web Archives, U.S. Census Bureau, retrieved June 19, 2011
- "Circular - Google Books". 2010-01-15. Retrieved 2016-10-04.