2020 United States presidential election in Tennessee
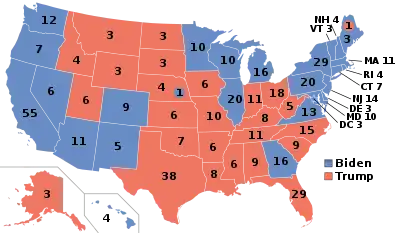
The 2020 United States presidential election in Tennessee was held on Tuesday, November 3, 2020, as part of the 2020 United States elections in which all 50 states plus the District of Columbia participated.[1] Tennessee voters chose electors to represent them in the Electoral College via a popular vote, pitting the Republican Party's nominee, incumbent President Donald Trump, and running mate Vice President Mike Pence against Democratic Party nominee, former Vice President Joe Biden, and his running mate California Senator Kamala Harris. Tennessee has 11 electoral votes in the Electoral College.[2]
| ||||||||||||||||||||||||||
| Turnout | % | |||||||||||||||||||||||||
|---|---|---|---|---|---|---|---|---|---|---|---|---|---|---|---|---|---|---|---|---|---|---|---|---|---|---|
| ||||||||||||||||||||||||||
 County results
| ||||||||||||||||||||||||||
| ||||||||||||||||||||||||||
.jpg.webp)
| Elections in Tennessee |
|---|
 |
|
|
Trump won Tennessee with 60.7% of the vote, almost tied with his 60.72% vote share in 2016. Despite this, Biden got 37.4% of the vote, three points better than Hillary Clinton. Prior to the election, all 17 news organizations considered this a state Trump would win, or a safe red state. The Volunteer State has not supported a Democrat since 1996. Biden won the same counties as Clinton did: urban Shelby and Davidson counties--anchored by Memphis and Nashville, respectively--as well as majority-Black Haywood County, and became the first Democrat to win the presidency without Hardeman County. In addition, Trump performed somewhat better than polls anticipated, as they had Trump leading Biden by 55%–41%.[3]
Despite this, Biden was able to improve his support among white progressives in Davidson County, winning with 64.5% of the vote, the best Democratic performance in the county since FDR won 72.1% of the vote in 1944. In addition, he narrowed Trump's margins in Hamilton County--anchored by Chattanooga--only losing it by 9.7 points, the best Democratic performance there since Bill Clinton lost the county by 6.5% in 1996; and with 44.1% of the popular vote, the best Democratic percentage since Carter's 48% in 1976, consequently losing by 2.8 points; and, to a much further extent, Rutherford County--anchored by Murfreesboro--only losing it 56.6% to 41.2%--a margin of 15.4%, much lower than Clinton's 25.9-point loss in 2016. This is the first time a Democrat has even garnered 40% of the vote in Rutherford County since 2000, when favorite son Al Gore lost the county by 9.7 points while at the same time losing both his home state and the election.
Winning the state by 708,764 votes, Tennessee gave Trump his largest margin of victory by the number of votes nationally. This exceeded the 631,221 vote margin he won in Texas, marking the first time since 1988 (when Florida provided the largest margin of victory) where Texas did not provide the Republican presidential nominee with his widest margin of votes for a statewide victory. Tennessee was also one of sixteen states where President Trump received less percentage of the vote than he did in the 2016 election.[lower-alpha 1] Additionally, this is the second consecutive election in which Tennessee was carried by more than 60%, the first time since 1996 that Tennessee and neighboring Georgia did not vote for the same president, and the first time since 1980 that Tennessee was won by the Republicans while Georgia was won by the Democrats.
Per exit polls by the Associated Press, Trump's strength in Tennessee came from a 69% showing among white voters, who made up 84% of the electorate. Similarly, Trump carried white born-again/Evangelical Christians by 86%–12%. The only strength Biden showed was 88% of African-American voters. 65% of voters opposed removing Confederate statues from public places in Tennessee, and these voters backed Trump by 83%–15%.[4]
Primary elections
Republican primary
The Republican primary was on March 3, 2020. Former Tennessee senator Bob Corker was considered a potential primary opponent for Trump.[5]
Incumbent United States President Donald Trump was challenged by two candidates: former congressman Joe Walsh of Illinois, and former governor Bill Weld of Massachusetts.[6] Walsh withdrew from the race prior to the primary. There was also an uncommitted option on the ballot. Trump won the state in a landslide victory over Walsh and Weld.
| Candidate | Votes | % | Estimated delegates |
|---|---|---|---|
| Donald Trump | 384,266 | 96.47 | 58 |
| Joe Walsh (withdrawn) | 4,178 | 1.05 | 0 |
| Bill Weld | 3,922 | 0.98 | 0 |
| Uncommitted | 5,948 | 1.49 | 0 |
| Total | 398,314 | 100% | 58 |
Democratic primary
The Democratic primary was on March 3, 2020. Elizabeth Warren, Bernie Sanders, and former Vice President Joe Biden were among the major declared candidates.[8][9]
%252C_2020.svg.png.webp)
| Candidate | Votes | % | Delegates[12] |
|---|---|---|---|
| Joe Biden | 215,390 | 41.72 | 36 |
| Bernie Sanders | 129,168 | 25.02 | 22 |
| Michael Bloomberg | 79,789 | 15.46 | 5 |
| Elizabeth Warren | 53,732 | 10.41 | 1 |
| Pete Buttigieg (withdrawn†) | 17,102 | 3.31 | 0 |
| Amy Klobuchar (withdrawn†) | 10,671 | 2.07 | 0 |
| Tulsi Gabbard | 2,278 | 0.44 | 0 |
| Tom Steyer (withdrawn†) | 1,932 | 0.37 | 0 |
| Michael Bennet (withdrawn) | 1,650 | 0.32 | 0 |
| Andrew Yang (withdrawn) | 1,097 | 0.21 | 0 |
| Cory Booker (withdrawn) | 953 | 0.18 | 0 |
| Marianne Williamson (withdrawn) | 498 | 0.10 | 0 |
| John Delaney (withdrawn) | 378 | 0.07 | 0 |
| Julian Castro (withdrawn) | 239 | 0.05 | 0 |
| Deval Patrick (withdrawn) | 182 | 0.04 | 0 |
| Uncommitted | 1,191 | 0.23 | 0 |
| Total | 516,250 | 100% | 64 |
General election
Predictions
| Source | Ranking | As of |
|---|---|---|
| The Cook Political Report[13] | Safe R | September 10, 2020 |
| Inside Elections[14] | Safe R | September 4, 2020 |
| Sabato's Crystal Ball[15] | Safe R | July 14, 2020 |
| Politico[16] | Safe R | September 8, 2020 |
| RCP[17] | Safe R | August 3, 2020 |
| Niskanen[18] | Safe R | July 26, 2020 |
| CNN[19] | Safe R | August 3, 2020 |
| The Economist[20] | Safe R | September 2, 2020 |
| CBS News[21] | Likely R | August 16, 2020 |
| 270towin[22] | Safe R | August 2, 2020 |
| ABC News[23] | Safe R | July 31, 2020 |
| NPR[24] | Likely R | August 3, 2020 |
| NBC News[25] | Safe R | August 6, 2020 |
| 538[26] | Safe R | September 9, 2020 |
Polling
Aggregate polls
| Source of poll aggregation |
Dates administered |
Dates updated |
Joe Biden Democratic |
Donald Trump Republican |
Other/ Undecided [lower-alpha 2] |
Margin |
|---|---|---|---|---|---|---|
| RealClearPolitics | Jan 28, 2020 – May 22, 2020 | September 15, 2020 | 39.0% | 53.0% | 8.0% | Trump +14.0 |
| FiveThirtyEight | until October 27, 2020 | October 28, 2020 | 41.0% | 54.4% | 4.6% | Trump +13.4 |
| Average | 40.0% | 53.7% | 6.3% | Trump +13.7 | ||
Polls
| Poll source | Date(s) administered |
Sample size[lower-alpha 3] |
Margin of error |
Donald Trump Republican |
Joe Biden Democratic |
Jo Jorgensen Libertarian |
Howie Hawkins Green |
Other | Undecided |
|---|---|---|---|---|---|---|---|---|---|
| SurveyMonkey/Axios | Oct 20 – Nov 2, 2020 | 3,342 (LV) | ± 2.5% | 54%[lower-alpha 4] | 45% | - | - | – | – |
| Swayable | Oct 23 – Nov 1, 2020 | 485 (LV) | ± 5.9% | 58% | 41% | 1% | 0% | – | – |
| SurveyMonkey/Axios | Oct 1–28, 2020 | 5,099 (LV) | – | 56% | 42% | - | - | – | – |
| SurveyMonkey/Axios | Sep 1–30, 2020 | 2,329 (LV) | – | 58% | 41% | - | - | – | 2% |
| SurveyMonkey/Axios | Aug 1–31, 2020 | 1,796 (LV) | – | 59% | 40% | - | - | – | 1% |
| SurveyMonkey/Axios | Jul 1–31, 2020 | 2,481 (LV) | – | 61% | 38% | - | - | – | 2% |
| SurveyMonkey/Axios | Jun 8–30, 2020 | 1,092 (LV) | – | 61% | 37% | - | - | – | 2% |
| SSRS/Vanderbilt University | May 5–22, 2020 | 1,000 (RV) | ± 3.8% | 51% | 42% | - | - | 5%[lower-alpha 5] | 2% |
| East Tennessee State University | Apr 22 – May 1, 2020 | 536 (LV) | – | 53% | 36% | - | - | 6% | 5% |
| Mason-Dixon | Jan 28–30, 2020 | 625 (RV) | ± 4.0% | 55% | 39% | - | - | – | 6% |
Former candidates | ||||||||||||||||||||||||||||||||||||||||||||||||||||||||
|---|---|---|---|---|---|---|---|---|---|---|---|---|---|---|---|---|---|---|---|---|---|---|---|---|---|---|---|---|---|---|---|---|---|---|---|---|---|---|---|---|---|---|---|---|---|---|---|---|---|---|---|---|---|---|---|---|
|
Donald Trump vs. Michael Bloomberg
Donald Trump vs. Pete Buttigieg
Donald Trump vs. Bernie Sanders
Donald Trump vs. Elizabeth Warren
|
Results
| Party | Candidate | Votes | % | ±% | |
|---|---|---|---|---|---|
| Republican | Donald Trump Mike Pence |
1,852,475 | 60.70% | -0.02% | |
| Democratic | Joe Biden Kamala Harris |
1,143,711 | 37.50% | +2.78% | |
| Libertarian | Jo Jorgensen Spike Cohen |
29,877 | 0.98% | ||
| Independent | Kanye West Michelle Tidball |
10,279 | 0.34% | ||
| Constitution | Don Blankenship William Mohr |
5,365 | 0.18% | ||
| Green | Howie Hawkins Angela Walker |
4,545 | 0.15% | ||
| Socialist Workers | Alyson Kennedy Malcolm Jarrett |
2,576 | 0.08% | ||
| Socialism and Liberation | Gloria La Riva Sunil Freeman |
2,301 | 0.08% | ||
| Alliance | Rocky De La Fuente Darcy Richardson |
1,860 | 0.06% | ||
| Write-in | 862 | 0.03% | |||
| Total votes | 3,053,851 | 100.00% | |||
By congressional district
Trump won 7 of 9 congressional districts.[28]
| District | Trump | Biden | Representative |
|---|---|---|---|
| 1st | 76.2% | 22.1% | Phil Roe |
| Diana Harshbarger | |||
| 2nd | 63.6% | 34.5% | Tim Burchett |
| 3rd | 65.3% | 32.9% | Chuck Fleischmann |
| 4th | 67.5% | 30.7% | Scott DesJarlais |
| 5th | 36.7% | 60.3% | Jim Cooper |
| 6th | 72.7% | 25.6% | John W. Rose |
| 7th | 66.9% | 31.3% | Mark E. Green |
| 8th | 65.4% | 33.2% | David Kustoff |
| 9th | 19.9% | 78.5% | Steve Cohen |
See also
Notes
- The other fifteen states were Alabama, Connecticut, Delaware, Georgia, Kentucky, Maine, Maryland, Massachusetts, Mississippi, Nebraska, New Hampshire, New Jersey, Rhode Island, Texas, and Virginia.
- Calculated by taking the difference of 100% and all other candidates combined.
- Key:
A – all adults
RV – registered voters
LV – likely voters
V – unclear - Overlapping sample with the previous SurveyMonkey/Axios poll, but more information available regarding sample size
- "Someone else" and would not vote with 2%; "refused" with 1%
References
- Kelly, Ben (August 13, 2018). "US elections key dates: When are the 2018 midterms and the 2020 presidential campaign?". The Independent. Retrieved January 3, 2019.
- "Distribution of Electoral Votes". National Archives and Records Administration. Retrieved January 3, 2019.
- Mehta, Aaron Bycoffe, Ritchie King and Dhrumil (June 28, 2018). "Tennessee President: general election Polls". FiveThirtyEight. Retrieved November 15, 2020.
- "Tennessee Voter Surveys: How Different Groups Voted". The New York Times. November 3, 2020. ISSN 0362-4331. Retrieved November 17, 2020.
- Mattise, Jonathan (December 20, 2018). "Trump foil, retiring GOP Sen. Corker: 'no idea' what's next". Associated Press. Retrieved December 26, 2018.
- Flessner, Dave (December 3, 2019). "16 Democrats and 3 Republicans on presidential primary ballot in Tennessee". Chattanooga Times Free Press. Retrieved December 4, 2019.
- "March 3, 2020 Republican Presidential Preference Primary" (PDF). Tennessee Secretary of State. Retrieved April 3, 2020.
- Taylor, Kate (February 9, 2019). "Elizabeth Warren Formally Announces 2020 Presidential Bid in Lawrence, Mass". The New York Times. Retrieved February 10, 2019.
- Herndon, Astead W.; Burns, Alexander (December 31, 2018). "Elizabeth Warren Announces Iowa Trip as She Starts Running for President in 2020". The New York Times. Retrieved January 3, 2019.
- "March 3, 2020 Democratic Presidential Preference Primary" (PDF). Tennessee Secretary of State. Retrieved April 3, 2020.
- "Tennessee Election Results 2020". PBS NewsHour. Retrieved March 7, 2020.
- "2020 Presidential Primaries, Caucuses, and Conventions: Tennessee Democrat". The Green Papers. Retrieved July 4, 2020.
- "2020 POTUS Race ratings" (PDF). The Cook Political Report. Retrieved May 21, 2019.
- "POTUS Ratings | Inside Elections". insideelections.com. Retrieved May 21, 2019.
- "Larry J. Sabato's Crystal Ball » 2020 President". crystalball.centerforpolitics.org. Retrieved May 21, 2019.
- "2020 Election Forecast". Politico. November 19, 2019.
- "Battle for White House". RCP. April 19, 2019.
- 2020 Bitecofer Model Electoral College Predictions, Niskanen Center, March 24, 2020, retrieved: April 19, 2020.
- David Chalian; Terence Burlij. "Road to 270: CNN's debut Electoral College map for 2020". CNN. Retrieved June 16, 2020.
- "Forecasting the US elections". The Economist. Retrieved July 7, 2020.
- "2020 Election Battleground Tracker". CBS News. July 12, 2020. Retrieved July 13, 2020.
- "2020 Presidential Election Interactive Map". 270 to Win.
- "ABC News Race Ratings". CBS News. July 24, 2020. Retrieved July 24, 2020.
- "2020 Electoral Map Ratings: Trump Slides, Biden Advantage Expands Over 270 Votes". NPR.org. Retrieved August 3, 2020.
- "Biden dominates the electoral map, but here's how the race could tighten". NBC News. Retrieved August 6, 2020.
- "2020 Election Forecast". FiveThirtyEight. Retrieved August 14, 2020.
- State of Tennessee General Election Results, November 3, 2020, Results By Office (PDF) (Report). Secretary of State of Tennessee. December 2, 2020. Retrieved December 2, 2020.
- Nir, David (November 19, 2020). "Daily Kos Elections' presidential results by congressional district for 2020, 2016, and 2012". Daily Kos. Retrieved December 10, 2020.
External links
- Government Documents Round Table of the American Library Association, "Tennessee", Voting & Elections Toolkits
- "Tennessee: Election Tools, Deadlines, Dates, Rules, and Links", Vote.org, Oakland, CA
- "League of Women Voters of Tennessee". (State affiliate of the U.S. League of Women Voters)
- Tennessee at Ballotpedia