Morrow County, Oregon
Morrow County is one of the 36 counties in the U.S. state of Oregon. As of the 2010 census, the population was 11,173.[1] The county seat is Heppner.[2] The county is named for one of its first white settlers, Jackson L. Morrow, who was a member of the state legislature when the county was created. Half of the Umatilla Chemical Depot, which includes the Umatilla Chemical Agent Disposal Facility, and the Naval Weapons Systems Training Facility Boardman are located within the county.
Morrow County | |
|---|---|
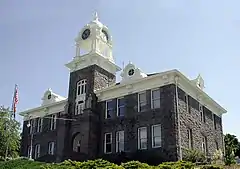 Morrow County Courthouse in Heppner | |
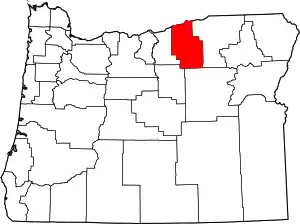 Location within the U.S. state of Oregon | |
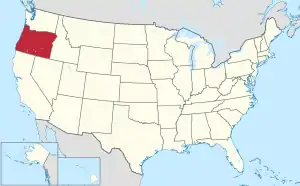 Oregon's location within the U.S. | |
| Coordinates: 45°25′N 119°34′W | |
| Country | |
| State | |
| Founded | February 16, 1885 |
| Seat | Heppner |
| Largest city | Boardman |
| Area | |
| • Total | 2,049 sq mi (5,310 km2) |
| • Land | 2,032 sq mi (5,260 km2) |
| • Water | 17 sq mi (40 km2) 0.8%% |
| Population (2010) | |
| • Total | 11,173 |
| • Estimate (2019) | 11,603 |
| • Density | 5.5/sq mi (2.1/km2) |
| Time zone | UTC−8 (Pacific) |
| • Summer (DST) | UTC−7 (PDT) |
| Congressional district | 2nd |
| Website | www |
Morrow County is part of the Pendleton–Hermiston, OR, Micropolitan Statistical Area. It is located on the south side of the Columbia River and is included in the eight-county definition of Eastern Oregon.
History
Morrow County was created in 1885 from the western portion of Umatilla County and a small portion of eastern Wasco County.[3] It is named for Jackson L. Morrow, a state representative who advocated for the county's formation. Heppner was designated the temporary county seat at the time the county was created and narrowly defeated Lexington in the election held in 1887 to determine the permanent county seat.
Geography
According to the U.S. Census Bureau, the county has a total area of 2,049 square miles (5,310 km2), of which 2,032 square miles (5,260 km2) is land and 17 square miles (44 km2) (0.8%) is covered by water.[4]
Adjacent counties
- Gilliam County - west
- Wheeler County - southwest
- Grant County - south
- Umatilla County - east
- Benton County, Washington - north
- Klickitat County, Washington - northwest
National protected areas
- Umatilla National Forest (part)
- Umatilla National Wildlife Refuge (part)
Demographics
| Historical population | |||
|---|---|---|---|
| Census | Pop. | %± | |
| 1890 | 4,205 | — | |
| 1900 | 4,151 | −1.3% | |
| 1910 | 4,357 | 5.0% | |
| 1920 | 5,617 | 28.9% | |
| 1930 | 4,941 | −12.0% | |
| 1940 | 4,337 | −12.2% | |
| 1950 | 4,783 | 10.3% | |
| 1960 | 4,871 | 1.8% | |
| 1970 | 4,465 | −8.3% | |
| 1980 | 7,519 | 68.4% | |
| 1990 | 7,625 | 1.4% | |
| 2000 | 10,995 | 44.2% | |
| 2010 | 11,173 | 1.6% | |
| 2019 (est.) | 11,603 | [5] | 3.8% |
| U.S. Decennial Census[6] 1790-1960[7] 1900-1990[8] 1990-2000[9] 2010-2019[1] | |||
2000 census
As of the census[10] of 2000, there were 10,995 people, 3,776 households, and 2,718 families living in the county. The population density was 5 people per square mile (2/km2). There were 4,296 housing units at an average density of 2 per square mile (1/km2). The racial makeup of the county was 76.27% White, 0.14% Black or African American, 1.42% Native American, 0.45% Asian, 0.08% Pacific Islander, 19.54% from other races, and 2.14% from two or more races. 24.43% of the population were Hispanic or Latino of any race. 13.6% were of German, 12.8% American, 8.3% Irish, and 8.0% English ancestry. 77.3% spoke English and 22.3% Spanish as their first language.
There were 3,776 households, out of which 38.91% had children under the age of 18 living with them, 62.60% were married couples living together, 8.87% had a female householder with no husband present, and 22.70% were non-families. 18.13% of all households were made up of individuals, and 7.40% had someone living alone who was 65 years of age or older. The average household size was 2.90 and the average family size was 3.28.
In the county, the population was spread out, with 30.80% under the age of 18, 8.90% from 18 to 24, 27.30% from 25 to 44, 22.40% from 45 to 64, and 10.60% who were 65 years of age or older. The median age was 33 years. For every 100 females, there were 106.50 males. For every 100 females age 18 and over, there were 106.10 males.
The median income for a household in the county was $37,525, and the median income for a family was $40,731. Males had a median income of $32,328 versus $22,887 for females. The per capita income for the county was $15,843. 14.80% of the population and 11.30% of families were below the poverty line. Out of the total population, 21.60% of those under the age of 18 and 10.1% of those 65 and older were living below the poverty line.
2010 census
As of the 2010 United States Census, there were 11,173 people, 3,916 households, and 2,953 families living in the county.[11] The population density was 5.5 inhabitants per square mile (2.1/km2). There were 4,442 housing units at an average density of 2.2 per square mile (0.85/km2).[12] The racial makeup of the county was 77.7% white, 1.2% American Indian, 0.9% Asian, 0.5% black or African American, 0.1% Pacific islander, 16.9% from other races, and 2.6% from two or more races. Those of Hispanic or Latino origin made up 31.3% of the population.[11] In terms of ancestry, 19.5% were German, 13.1% were English, 10.7% were Irish, and 5.0% were American.[13]
Of the 3,916 households, 37.7% had children under the age of 18 living with them, 59.7% were married couples living together, 9.6% had a female householder with no husband present, 24.6% were non-families, and 19.1% of all households were made up of individuals. The average household size was 2.85 and the average family size was 3.25. The median age was 36.5 years.[11]
The median income for a household in the county was $43,902 and the median income for a family was $49,868. Males had a median income of $38,045 versus $30,173 for females. The per capita income for the county was $20,201. About 12.4% of families and 15.3% of the population were below the poverty line, including 21.7% of those under age 18 and 3.9% of those age 65 or over.[14]
Politics
Like all counties in eastern Oregon, the majority of registered voters who are part of a political party in Morrow County are members of the Republican Party. In the 2008 presidential election 61.94% of Morrow County voters voted for Republican John McCain, while 34.62% voted for Democrat Barack Obama and 3.44% of voters either voted for a third-party candidate or wrote in a candidate.[15] These numbers show a slight shift towards the Democratic candidate when compared to the 2004 presidential election, in which 65.9% of Morrow Country voters voted for George W. Bush, while 32.8% voted for John Kerry, and 1.4% of voters either voted for a third-party candidate or wrote in a candidate.[16] However, it shifted back in 2012 and 2016, with Mitt Romney and Donald Trump both receiving roughly 65% of the vote.
.gif)
| Year | Republican | Democratic | Third parties |
|---|---|---|---|
| 2016 | 65.3% 2,721 | 24.4% 1,017 | 10.3% 429 |
| 2012 | 65.2% 2,532 | 31.0% 1,202 | 3.8% 148 |
| 2008 | 61.8% 2,509 | 34.8% 1,410 | 3.4% 139 |
| 2004 | 65.9% 2,732 | 32.8% 1,361 | 1.4% 56 |
| 2000 | 61.6% 2,224 | 33.2% 1,197 | 5.2% 188 |
| 1996 | 41.5% 1,381 | 42.8% 1,426 | 15.7% 524 |
| 1992 | 34.2% 1,187 | 33.8% 1,174 | 32.0% 1,113 |
| 1988 | 51.5% 1,529 | 46.3% 1,375 | 2.2% 66 |
| 1984 | 62.7% 2,130 | 36.9% 1,254 | 0.4% 13 |
| 1980 | 55.0% 1,728 | 34.3% 1,077 | 10.7% 336 |
| 1976 | 46.1% 1,091 | 49.1% 1,162 | 4.8% 114 |
| 1972 | 52.8% 1,059 | 35.8% 718 | 11.5% 230 |
| 1968 | 54.3% 1,068 | 40.5% 797 | 5.2% 102 |
| 1964 | 29.9% 627 | 70.1% 1,470 | 0.0% 0 |
| 1960 | 49.1% 1,003 | 50.9% 1,039 | 0.0% 0 |
| 1956 | 55.0% 1,092 | 45.0% 893 | 0.0% 0 |
| 1952 | 61.3% 1,254 | 38.4% 786 | 0.2% 5 |
| 1948 | 46.3% 751 | 51.7% 838 | 2.0% 33 |
| 1944 | 46.8% 747 | 52.4% 836 | 0.8% 13 |
| 1940 | 43.3% 758 | 56.0% 979 | 0.7% 12 |
| 1936 | 27.6% 518 | 63.0% 1,181 | 9.3% 175 |
| 1932 | 36.2% 579 | 58.0% 929 | 5.8% 93 |
| 1928 | 64.9% 1,093 | 32.2% 543 | 2.9% 49 |
| 1924 | 53.3% 991 | 21.4% 397 | 25.3% 470 |
| 1920 | 68.8% 1,186 | 26.1% 451 | 5.1% 88 |
| 1916 | 44.1% 748 | 48.9% 830 | 7.0% 119 |
| 1912 | 42.6% 447 | 26.2% 275 | 31.2% 328 |
| 1908 | 62.1% 680 | 24.8% 272 | 13.1% 143 |
| 1904 | 65.1% 875 | 17.1% 230 | 17.8% 239 |
Economy
The principal industries in the county today include agriculture, food processing, lumber, livestock, and recreation. The Columbia River also provides Morrow County with a number of related jobs. A coal-fired generating plant in Boardman also employs a significant number of people.
_(morDA0001a).jpg.webp)
Early cattlemen found an abundance of rye along the creek bottoms of the region and drove their herds into the area to forage on these natural pastures. Ranching was the primary economic force in the county for many years. Increased settlement, the enclosure of the free grazing lands and diminished pastures due to overgrazing, resulted in the decline of ranching during the 19th century, and farming became predominant. The completion of rail lines into the county in 1883 increased access to markets and encouraged wheat production in the area. The advent of technology for center pivot irrigation has been a further stimulus to the local economy.
The Port of Morrow, situated on the Columbia River near the city of Boardman, was established in 1957.
The coal-fired electricity generation plant, the Boardman Turbine Coal Plant (601 megawatts), is 14 miles (23 km) southwest of the town of Boardman and is owned by Portland General Electric (PGE; 66%-owned and operated), Idaho Power (10%), Pacific Northwest Generating (10%), and General Electric Credit Corp. (16%). There are also two natural gas-fired plants located at the Port of Morrow; Coyote Springs I (255-276 MW), owned and operated by Portland General Electric; and Coyote Springs II (241-280 MW; PGE operator) owned by Avista Corp.
Transportation
Airports
Major roads
 Interstate 84
 U.S. Route 30
 U.S. Route 730
 Oregon Route 74
 Oregon Route 206
 Oregon Route 207
Communities
Unincorporated communities
Ghost town
References
- "State & County QuickFacts". United States Census Bureau. Archived from the original on June 20, 2011. Retrieved November 15, 2013.
- "Find a County". National Association of Counties. Retrieved June 7, 2011.
- "Oregon: Individual County Chronologies". Oregon Atlas of Historical County Boundaries. The Newberry Library. 2007. Retrieved February 28, 2015.
- "2010 Census Gazetteer Files". United States Census Bureau. August 22, 2012. Retrieved February 26, 2015.
- "Population and Housing Unit Estimates". Retrieved March 26, 2020.
- "U.S. Decennial Census". United States Census Bureau. Retrieved February 26, 2015.
- "Historical Census Browser". University of Virginia Library. Retrieved February 26, 2015.
- Forstall, Richard L., ed. (March 27, 1995). "Population of Counties by Decennial Census: 1900 to 1990". United States Census Bureau. Retrieved February 26, 2015.
- "Census 2000 PHC-T-4. Ranking Tables for Counties: 1990 and 2000" (PDF). United States Census Bureau. April 2, 2001. Retrieved February 26, 2015.
- "U.S. Census website". United States Census Bureau. Retrieved January 31, 2008.
- "DP-1 Profile of General Population and Housing Characteristics: 2010 Demographic Profile Data". United States Census Bureau. Archived from the original on February 13, 2020. Retrieved February 23, 2016.
- "Population, Housing Units, Area, and Density: 2010 - County". United States Census Bureau. Archived from the original on February 13, 2020. Retrieved February 23, 2016.
- "DP02 SELECTED SOCIAL CHARACTERISTICS IN THE UNITED STATES – 2006-2010 American Community Survey 5-Year Estimates". United States Census Bureau. Archived from the original on February 13, 2020. Retrieved February 23, 2016.
- "DP03 SELECTED ECONOMIC CHARACTERISTICS – 2006-2010 American Community Survey 5-Year Estimates". United States Census Bureau. Archived from the original on February 13, 2020. Retrieved February 23, 2016.
- Retrieved on 4/21/09
- http://www.city-data.com/county/Umatilla_County-OR.html Retrieved on 4/21/09
- http://records.sos.state.or.us/ORSOSWebDrawer/Recordpdf/6812395 Retrieved on April 21, 2009
- Leip, David. "Dave Leip's Atlas of U.S. Presidential Elections". uselectionatlas.org. Retrieved April 11, 2018.
External links
Municipalities and communities of Morrow County, Oregon, United States | ||
|---|---|---|
| Cities | Morrow County map | |
| Unincorporated communities | ||
| Ghost town | ||
| ||
| Authority control |
|---|