Benton County, Oregon
Benton County is one of the 36 counties in the U.S. state of Oregon. As of the 2010 census, the population was 85,579.[1] Its county seat is Corvallis.[2] The county was named after Thomas Hart Benton, a U.S. Senator who advocated American control over the Oregon Country. Benton County is designated as the Corvallis, OR Metropolitan Statistical Area, which is included in the Portland–Vancouver–Salem, OR–WA Combined Statistical Area. It is in the Willamette Valley.
Benton County | |
|---|---|
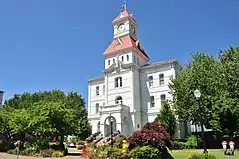 Benton County Courthouse in Corvallis | |
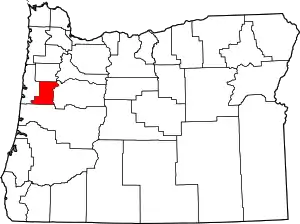 Location within the U.S. state of Oregon | |
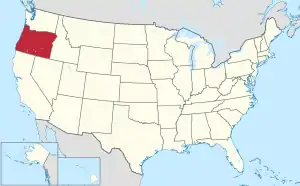 Oregon's location within the U.S. | |
| Coordinates: 44°29′25″N 123°25′57″W | |
| Country | |
| State | |
| Founded | December 23, 1847 |
| Seat | Corvallis |
| Largest city | Corvallis |
| Area | |
| • Total | 679 sq mi (1,760 km2) |
| • Land | 676 sq mi (1,750 km2) |
| • Water | 2.7 sq mi (7 km2) 0.4%% |
| Population (2010) | |
| • Total | 85,579 |
| • Estimate (2019) | 93,053 |
| • Density | 127/sq mi (49/km2) |
| Time zone | UTC−8 (Pacific) |
| • Summer (DST) | UTC−7 (PDT) |
| Congressional districts | 4th, 5th |
| Website | www |
History
Benton County was created on December 23, 1847 by an act of the Provisional Government of Oregon.[3] The county was named after Democratic Senator Thomas Hart Benton of Missouri, an advocate of the doctrine of Manifest Destiny and the belief that the American government should control the whole of the Oregon Country. At the time of its formation the county included all the country west of the Willamette River, south of Polk County and running all the way to the California border in the south and the Pacific Ocean in the west.[4]
The county was created out of lands originally inhabited by the Klickitat, who rented it from the Kalapuyas for use as hunting grounds. All aboriginal claims to land within Benton County were ceded in the Treaty of Dayton in 1855. Portions of Benton County were taken to form Coos, Curry, Douglas, Jackson, Josephine, Lane and Lincoln Counties, leaving Benton County in its present form.
The city of Marysville, later renamed Corvallis, was made the county seat in 1851. The city briefly was the capital of Oregon.[5] In 1862 Corvallis became the site of the Oregon State Agricultural College, known today as Oregon State University.
Geography
According to the U.S. Census Bureau, the county has a total area of 679 square miles (1,760 km2), of which 676 square miles (1,750 km2) is land and 2.7 square miles (7.0 km2) (0.4%) is water.[6] It is the fourth-smallest county in Oregon by land area and third-smallest by total area.
Adjacent counties
- Polk County (north)
- Lincoln County (west)
- Linn County (east)
- Lane County (south)
National protected areas
Demographics
| Historical population | |||
|---|---|---|---|
| Census | Pop. | %± | |
| 1850 | 814 | — | |
| 1860 | 3,074 | 277.6% | |
| 1870 | 4,584 | 49.1% | |
| 1880 | 6,403 | 39.7% | |
| 1890 | 8,650 | 35.1% | |
| 1900 | 6,706 | −22.5% | |
| 1910 | 10,663 | 59.0% | |
| 1920 | 13,744 | 28.9% | |
| 1930 | 16,555 | 20.5% | |
| 1940 | 18,629 | 12.5% | |
| 1950 | 31,570 | 69.5% | |
| 1960 | 39,165 | 24.1% | |
| 1970 | 53,776 | 37.3% | |
| 1980 | 68,211 | 26.8% | |
| 1990 | 70,811 | 3.8% | |
| 2000 | 78,153 | 10.4% | |
| 2010 | 85,579 | 9.5% | |
| 2019 (est.) | 93,053 | [7] | 8.7% |
| U.S. Decennial Census[8] 1790–1960[9] 1900–1990[10] 1990–2000[11] 2010–2019[1] | |||
2000 census
As of the census[12] of 2000, there were 78,153 people, 30,145 households, and 18,237 families residing in the county. The population density was 116 people per square mile (45/km2). There were 31,980 housing units at an average density of 47 per square mile (18/km2). The racial makeup of the county was 89.16% White, 0.84% Black or African American, 0.79% Native American, 4.49% Asian, 0.24% Pacific Islander, 1.92% from other races, and 2.56% from two or more races. 4.66% of the population were Hispanic or Latino of any race. 18.2% were of German, 11.6% English, 8.9% Irish and 7.0% American ancestry. 91.1% spoke English, 4.1% Spanish and 1.0% Chinese as their first language.
There were 30,145 households, out of which 28.40% had children under the age of 18 living with them, 50.40% were married couples living together, 7.20% had a female householder with no husband present, and 39.50% were non-families. 26.10% of all households were made up of individuals, and 6.70% had someone living alone who was 65 years of age or older. The average household size was 2.43 and the average family size was 2.95.
In the county, the population was spread out, with 21.30% under the age of 18, 20.20% from 18 to 24, 26.70% from 25 to 44, 21.40% from 45 to 64, and 10.30% who were 65 years of age or older. The median age was 31 years. For every 100 females there were 99.10 males. For every 100 females age 18 and over, there were 97.80 males.
The median income for a household in the county was $41,897, and the median income for a family was $56,319. Males had a median income of $42,018 versus $29,795 for females. The per capita income for the county was $21,868. About 6.80% of families and 14.60% of the population were below the poverty line, including 10.60% of those under age 18 and 4.90% of those age 65 or over.
Benton County has the lowest church attendance per capita of any county in the nation (25% attendance).[13]
2010 census
As of the 2010 United States Census, there were 85,579 people, 34,317 households, and 19,256 families residing in the county.[14] The population density was 126.6 inhabitants per square mile (48.9/km2). There were 36,245 housing units at an average density of 53.6 per square mile (20.7/km2).[15] The racial makeup of the county was 87.1% white, 5.2% Asian, 0.9% black or African American, 0.7% American Indian, 0.2% Pacific islander, 2.3% from other races, and 3.6% from two or more races. Those of Hispanic or Latino origin made up 6.4% of the population.[14] In terms of ancestry, 22.6% were German, 16.1% were English, 13.5% were Irish, and 3.6% were American.[16]
Of the 34,317 households, 24.2% had children under the age of 18 living with them, 45.3% were married couples living together, 7.3% had a female householder with no husband present, 43.9% were non-families, and 28.2% of all households were made up of individuals. The average household size was 2.35 and the average family size was 2.87. The median age was 32.1 years.[14]
The median income for a household in the county was $48,012 and the median income for a family was $71,763. Males had a median income of $50,282 versus $35,387 for females. The per capita income for the county was $26,177. About 7.7% of families and 19.1% of the population were below the poverty line, including 13.6% of those under age 18 and 5.5% of those age 65 or over.[17]
Communities

Cities
- Adair Village
- Albany (part)
- Corvallis (county seat)
- Monroe
- Philomath
Census-designated places
Politics and government
For a long time Benton County strongly favored the Republican Party. Along with Riverside County in California it was one of only two counties in the Pacific States to be held by Herbert Hoover in 1932. As late as 1960[18] Benton was the most Republican county in the traditionally Republican state of Oregon, which at that point had never supported a Democrat other than FDR for President except for 1912 when the Republican Party was divided and a very narrow victory in 1868. Up to 1984 Benton County had voted for a Democratic Presidential candidate only four times, in the above-mentioned 1868 election plus the national Democratic landslides of 1912, 1936 and 1964. In 1964, Lyndon Johnson became the first Democrat to win an absolute majority of the county's vote since Horatio Seymour.[19]
The Republican edge in the county narrowed from the 1970s onward, culminating when it swung from a five-point victory for Ronald Reagan in 1984 to a nine-point victory for Michael Dukakis in 1988. Since then, Benton County has become a strongly Democratic county, and is usually the second-strongest Democratic bastion in the state, behind only Multnomah County (Portland). This is largely due to the leanings of Oregon State's student body and staff, closely tracking with Democratic gains in other counties influenced by college towns. No Republican has come within nine percentage points of carrying Benton County since 1988, and Barack Obama and Hillary Clinton have won the county by over thirty percentage points during each of the last three presidential elections.
Since 1972, Benton County has been a home rule county, meaning that the citizens have full control over the county charter, rather than using a standard charter issued by the state.[20] The voters have chosen to eliminate the traditional elected county offices of Assessor, Treasurer, Surveyor, Justice of the Peace, and Clerk. Currently, they only elect three County Commissioners and a Sheriff.[21][22]
The three current Benton County Commissioners are Chair Pat Malone, Xanthippe Augerot, and Annabelle Jaramillo. They are all members of the Democratic Party and have served since 2019, 2017, and 2001; respectively. Jaramillo and Augerot's current terms expire in January 2021, while Malone's is up in January 2023.[22][23][24]
The current Benton County Sheriff is Scott Jackson. He was appointed to the office as of July 1, 2013 to fill the remainder of the term of retiring sheriff Diana Simpson, the first elected female sheriff in Oregon. He was re-elected in 2014 and 2018.[25][26]
| Year | Republican | Democratic | Third parties |
|---|---|---|---|
| 2020 | 28.2% 14,878 | 67.9% 35,827 | 4.0% 2,094 |
| 2016 | 27.6% 13,445 | 59.9% 29,193 | 12.5% 6,115 |
| 2012 | 33.5% 14,991 | 62.0% 27,776 | 4.5% 2,035 |
| 2008 | 32.8% 15,264 | 64.3% 29,901 | 2.8% 1,313 |
| 2004 | 40.4% 18,460 | 58.0% 26,515 | 1.7% 760 |
| 2000 | 41.4% 15,825 | 50.9% 19,444 | 7.7% 2,957 |
| 1996 | 36.1% 12,450 | 49.9% 17,211 | 14.0% 4,839 |
| 1992 | 30.5% 11,550 | 47.4% 17,966 | 22.2% 8,407 |
| 1988 | 44.3% 14,004 | 53.6% 16,930 | 2.1% 676 |
| 1984 | 52.4% 17,836 | 47.2% 16,073 | 0.5% 153 |
| 1980 | 43.4% 14,982 | 38.1% 13,150 | 18.5% 6,375 |
| 1976 | 53.1% 15,555 | 40.6% 11,887 | 6.4% 1,865 |
| 1972 | 56.3% 14,906 | 41.0% 10,842 | 2.7% 708 |
| 1968 | 61.3% 11,654 | 34.4% 6,538 | 4.3% 824 |
| 1964 | 44.0% 7,250 | 54.4% 8,971 | 1.6% 265 |
| 1960 | 64.4% 9,734 | 35.6% 5,391 | |
| 1956 | 68.2% 9,016 | 31.9% 4,214 | |
| 1952 | 75.3% 9,229 | 24.2% 2,966 | 0.6% 67 |
| 1948 | 66.2% 6,839 | 30.4% 3,135 | 3.4% 355 |
| 1944 | 64.4% 5,242 | 34.8% 2,830 | 0.9% 69 |
| 1940 | 63.0% 5,089 | 36.4% 2,942 | 0.6% 48 |
| 1936 | 45.7% 3,390 | 47.8% 3,547 | 6.6% 486 |
| 1932 | 54.7% 4,068 | 42.0% 3,121 | 3.3% 244 |
| 1928 | 75.6% 4,605 | 23.2% 1,412 | 1.3% 78 |
| 1924 | 60.7% 3,417 | 28.0% 1,579 | 11.3% 635 |
| 1920 | 66.3% 3,752 | 30.4% 1,719 | 3.4% 192 |
| 1916 | 50.7% 2,902 | 43.5% 2,488 | 5.8% 332 |
| 1912 | 27.4% 715 | 37.8% 986 | 34.8% 906 |
| 1908 | 56.0% 1,183 | 36.6% 773 | 7.4% 157 |
| 1904 | 62.5% 1,107 | 25.0% 442 | 12.5% 222 |
Economy
Along with Oregon State University, agriculture, lumber, wood products, and some printing technology research and development form the economic base of the county. A substantial portion of the nation's research in forestry, agriculture, engineering, education and the sciences takes place at OSU.
References
- "State & County QuickFacts". United States Census Bureau. Archived from the original on July 7, 2011. Retrieved November 14, 2013.
- "Find a County". National Association of Counties. Archived from the original on May 31, 2011. Retrieved June 7, 2011.
- Hubert Howe Bancroft, The Works of Hubert Howe Bancroft: Volume XXX: History of Oregon: Volume II, 1848–1888. San Francisco, CA: The History Company, 1888; pg. 706.
- Bancroft, History of Oregon, Volume II, pp. 706-707.
- Benton County - A rich history Archived July 23, 2015, at the Wayback Machine, Official Website of Benton County
- "2010 Census Gazetteer Files". United States Census Bureau. August 22, 2012. Retrieved February 25, 2015.
- "Population and Housing Unit Estimates". Retrieved March 26, 2020.
- "U.S. Decennial Census". United States Census Bureau. Retrieved February 25, 2015.
- "Historical Census Browser". University of Virginia Library. Retrieved February 25, 2015.
- Forstall, Richard L., ed. (March 27, 1995). "Population of Counties by Decennial Census: 1900 to 1990". United States Census Bureau. Retrieved February 25, 2015.
- "Census 2000 PHC-T-4. Ranking Tables for Counties: 1990 and 2000" (PDF). United States Census Bureau. April 2, 2001. Retrieved February 25, 2015.
- "U.S. Census website". United States Census Bureau. Retrieved January 31, 2008.
- Reeves, Carol (December 21, 2003). "Where are the faithful?". Corvallis Gazette-Times. Archived from the original on August 3, 2009. Retrieved June 11, 2006.
- "DP-1 Profile of General Population and Housing Characteristics: 2010 Demographic Profile Data". United States Census Bureau. Archived from the original on February 13, 2020. Retrieved February 23, 2016.
- "Population, Housing Units, Area, and Density: 2010 - County". United States Census Bureau. Archived from the original on February 13, 2020. Retrieved February 23, 2016.
- "DP02 SELECTED SOCIAL CHARACTERISTICS IN THE UNITED STATES – 2006-2010 American Community Survey 5-Year Estimates". United States Census Bureau. Archived from the original on February 13, 2020. Retrieved February 23, 2016.
- "DP03 SELECTED ECONOMIC CHARACTERISTICS – 2006-2010 American Community Survey 5-Year Estimates". United States Census Bureau. Archived from the original on February 13, 2020. Retrieved February 23, 2016.
- Dave Leip's U.S. Election Atlas; 1960 Presidential General Election Data Graphs – Oregon by County
- Menendez, Albert J.; The Geography of Presidential Elections in the United States, 1868–2004, pp. 284–286 ISBN 0786422173
- "County Government in Oregon". Oregon Blue Book. Retrieved December 11, 2013.
- Tollenaar and Associates. "COUNTY HOME RULE IN OREGON" (PDF). Association of Oregon Counties. Archived from the original (PDF) on December 14, 2013. Retrieved December 11, 2013.
- "Benton County Charter" (PDF). Benton County Oregon. Archived from the original (PDF) on July 20, 2012. Retrieved December 11, 2013.
- "Benton County Board of Commissioners Office". Benton County, Oregon. Retrieved August 5, 2020.
- "Benton County". Oregon Blue Book. Retrieved June 23, 2017.
- "Scott Jackson chosen as new Benton County sheriff". Corvallis Gazette-Times. May 18, 2013. Retrieved December 11, 2013.
- "Benton County Sheriff Scott Jackson". Benton County, Oregon. Retrieved August 5, 2020.
- Leip, David. "Dave Leip's Atlas of U.S. Presidential Elections". uselectionatlas.org. Retrieved April 11, 2018.
Further reading
- David D. Fagan, History of Benton County, Oregon: Including... a Full Political History, ...Incidents of Pioneer Life, and Biographical Sketches of Early and Prominent Citizens... Portland, OR: A.G. Walling, Printer, 1885.
- H.O. Lang (ed.), History of the Willamette Valley: Being a Description of the Valley and its Resources, with an Account of its Discovery and Settlement by White Men, and its Subsequent History; Together with Personal Reminiscences of its Early Pioneers. Portland: Himes and Lang, 1885.
- Benton County, Oregon, Illustrated: Published under Direction of the Benton County Citizens' League. n.c.: Benton County Citizens' League, 1904. —Copies in collections at OSU and UO libraries.
- Portrait and Biographical Record of the Willamette Valley, Oregon, Containing Original Sketches of Many Well Known Citizens of the Past and Present. Chicago: Chapman Publishing Co., 1903.
- Turnbull, George S. (1939). . . Binfords & Mort.
External links
Places adjacent to Benton County, Oregon | ||||||||||
|---|---|---|---|---|---|---|---|---|---|---|
| ||||||||||
Municipalities and communities of Benton County, Oregon, United States | ||
|---|---|---|
| Cities | Benton County map | |
| CDPs | ||
| Other unincorporated communities | ||
| Footnotes | ‡This populated place also has portions in an adjacent county or counties | |
| ||
| Authority control |
|---|