Lincoln County, Oregon
Lincoln County is one of the 36 counties in the U.S. state of Oregon. As of the 2010 census, its population was 46,034.[1] The county seat is Newport.[2] The county is named for Abraham Lincoln, 16th president of the United States.[3]
Lincoln County | |
|---|---|
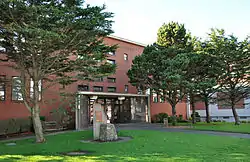 Lincoln County Courthouse in Newport | |
 Location within the U.S. state of Oregon | |
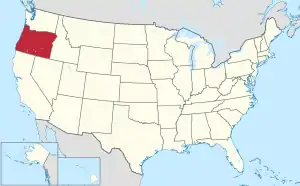 Oregon's location within the U.S. | |
| Coordinates: 44°38′N 123°55′W | |
| Country | |
| State | |
| Founded | February 20, 1893 |
| Seat | Newport |
| Largest city | Newport |
| Area | |
| • Total | 1,194 sq mi (3,090 km2) |
| • Land | 980 sq mi (2,500 km2) |
| • Water | 214 sq mi (550 km2) 18%% |
| Population (2010) | |
| • Total | 46,034 |
| • Estimate (2019) | 49,962 |
| • Density | 47/sq mi (18/km2) |
| Time zone | UTC−8 (Pacific) |
| • Summer (DST) | UTC−7 (PDT) |
| Congressional district | 5th |
| Website | www |
Lincoln County includes the Newport, Oregon Micropolitan Statistical Area.
History
Lincoln County was created by the Oregon Legislative Assembly on February 20, 1893, from the western portion of Benton and Polk counties. The county adjusted its boundaries in 1923, 1925, 1927, 1931, and 1949.
At the time of the county's creation, Toledo was picked as the temporary county seat. In 1896 it was chosen as the permanent county seat. Three elections were held to determine if the county seat should be moved from Toledo to Newport. Twice these votes failed—in 1928 and 1938. In 1954, however, the vote went in Newport's favor. While Toledo has remained the industrial hub of Lincoln County, the city has never regained the position it once had.
Like Tillamook County to the north, for the first decades of its existence Lincoln County was isolated from the rest of the state. This was solved with the construction of U.S. Route 101 (completed in 1925), and the Salmon River Highway (completed in 1930). In 1936, as some of many federally funded construction projects during the Great Depression, bridges were constructed across the bays at Waldport, Newport, and Siletz, eliminating the ferries needed to cross these bays.
The northern part of Lincoln County includes the Siletz Reservation, created by treaty in 1855. The reservation was open to non-Indian settlement between 1895 and 1925. The Siletz's tribal status was terminated by the federal government in 1954, but in 1977 it became the first Oregon tribe to have its tribal status reinstated. The current reservation totals 3,666 acres (14.84 km2).
In 2020, during the COVID-19 pandemic, Lincoln County issued a face mask directive which exempted "people of color". After county officials were overwhelmed with criticism, the exemption was rescinded.[4]
Economy
Principal industries of the county are travel (primarily tourism), trade, health services and construction.[5][6] Paper manufacturing and fishing are still important although they contribute proportionally less to the county's employment than they used to. Newport is one of the two major fishing ports of Oregon (along with Astoria) that ranks in the top twenty of fishing ports in the U.S. Its port averaged 105 million pounds (48,000 t) of fish landed in 1997–2000. Newport is home of Oregon State University's Hatfield Marine Science Center, as well as the Oregon Coast Aquarium, and their fleet of ocean-going vessels.
Many of the other communities in Lincoln county depend on tourism as their principal source of income. The county's average nonfarm employment was 18,820 in 2007.
Geography
According to the U.S. Census Bureau, the county has a total area of 1,194 square miles (3,090 km2), of which 980 square miles (2,500 km2) is land and 214 square miles (550 km2) (18%) is water.[7]
Adjacent counties
- Tillamook County (north)
- Polk County (east)
- Benton County (east)
- Lane County (south)
National protected areas
Demographics
| Historical population | |||
|---|---|---|---|
| Census | Pop. | %± | |
| 1900 | 3,575 | — | |
| 1910 | 5,587 | 56.3% | |
| 1920 | 6,084 | 8.9% | |
| 1930 | 9,903 | 62.8% | |
| 1940 | 14,549 | 46.9% | |
| 1950 | 21,308 | 46.5% | |
| 1960 | 24,635 | 15.6% | |
| 1970 | 25,755 | 4.5% | |
| 1980 | 35,264 | 36.9% | |
| 1990 | 38,889 | 10.3% | |
| 2000 | 44,479 | 14.4% | |
| 2010 | 46,034 | 3.5% | |
| 2019 (est.) | 49,962 | [8] | 8.5% |
| U.S. Decennial Census[9] 1790-1960[10] 1900-1990[11] 1990-2000[12] 2010-2019[1] | |||
2000 census
As of the 2000 census, there were 44,479 people, 19,296 households, and 12,252 families living in the county. The population density was 45 people per square mile (18/km2). There were 26,889 housing units at an average density of 27 per square mile (11/km2). The racial makeup of the county was 90.59% White, 0.30% Black or African American, 3.14% Native American, 0.93% Asian, 0.16% Pacific Islander, 1.66% from other races, and 3.23% from two or more races. 4.76% of the population were Hispanic or Latino of any race. 16.8% were of German, 13.5% English, 10.8% Irish and 8.5% American ancestry.
There were 19,296 households, out of which 24.40% had children under the age of 18 living with them, 49.50% were married couples living together, 10.00% had a female householder with no husband present, and 36.50% were non-families. 29.30% of all households were made up of individuals, and 12.70% had someone living alone who was 65 years of age or older. The average household size was 2.27 and the average family size was 2.75.
In the county, the population was spread out, with 21.40% under the age of 18, 6.50% from 18 to 24, 23.50% from 25 to 44, 29.00% from 45 to 64, and 19.50% who were 65 years of age or older. The median age was 44 years. For every 100 females there were 94.00 males. For every 100 females age 18 and over, there were 90.10 males.
The median income for a household in the county was $32,769, and the median income for a family was $39,403. Males had a median income of $32,407 versus $22,622 for females. The per capita income for the county was $18,692. About 9.80% of families and 13.90% of the population were below the poverty line, including 19.50% of those under age 18 and 7.20% of those age 65 or over.
2010 census
As of the 2010 United States Census, there were 46,034 people, 20,550 households, and 12,372 families living in the county.[13] The population density was 47.0 inhabitants per square mile (18.1/km2). There were 30,610 housing units at an average density of 31.2 per square mile (12.0/km2).[14] The racial makeup of the county was 87.7% white, 3.5% American Indian, 1.1% Asian, 0.4% black or African American, 0.1% Pacific islander, 3.4% from other races, and 3.7% from two or more races. Those of Hispanic or Latino origin made up 7.9% of the population.[13] In terms of ancestry, 23.5% were German, 22.0% were English, 14.6% were Irish, and 4.6% were American.[15]
Of the 20,550 households, 21.2% had children under the age of 18 living with them, 46.3% were married couples living together, 9.6% had a female householder with no husband present, 39.8% were non-families, and 31.2% of all households were made up of individuals. The average household size was 2.20 and the average family size was 2.70. The median age was 49.6 years.[13]
The median income for a household in the county was $39,738 and the median income for a family was $52,730. Males had a median income of $42,416 versus $31,690 for females. The per capita income for the county was $24,354. About 11.7% of families and 16.2% of the population were below the poverty line, including 21.7% of those under age 18 and 8.8% of those age 65 or over.[16]
Politics
In its early history, Lincoln County, like almost all of Western Oregon during the era, was very solidly Republican. It was won by the Republican presidential nominee in every election from its creation up to and including 1928, even voting for William Howard Taft in 1912 when his party was divided.[17] Since Franklin Delano Roosevelt became the first Democrat to carry the county in 1932, Lincoln has become a strongly Democratic-leaning county. The only Republicans to win Lincoln County since the Great Depression transformed its politics have been Dwight D. Eisenhower, Richard Nixon and Ronald Reagan, who each carried the county twice. With the exception of 1968, all these post-Depression Republican wins in Lincoln County occurred during landslide GOP victories across the nation.
In the United States House of Representatives, Lincoln County lies within Oregon's 5th congressional district, represented by Democrat Kurt Schrader.
| Year | Republican | Democratic | Third parties |
|---|---|---|---|
| 2016 | 39.8% 10,039 | 49.5% 12,501 | 10.8% 2,716 |
| 2012 | 37.8% 8,686 | 58.3% 13,401 | 3.9% 897 |
| 2008 | 36.8% 8,791 | 59.7% 14,258 | 3.5% 840 |
| 2004 | 41.8% 10,160 | 56.5% 13,753 | 1.7% 412 |
| 2000 | 40.0% 8,446 | 51.4% 10,861 | 8.6% 1,811 |
| 1996 | 32.6% 6,717 | 51.2% 10,552 | 16.2% 3,338 |
| 1992 | 26.4% 5,716 | 44.4% 9,603 | 29.2% 6,304 |
| 1988 | 42.2% 7,364 | 55.0% 9,598 | 2.8% 481 |
| 1984 | 51.2% 9,110 | 48.5% 8,637 | 0.3% 57 |
| 1980 | 44.6% 7,637 | 40.9% 7,009 | 14.5% 2,481 |
| 1976 | 43.6% 5,755 | 50.7% 6,685 | 5.8% 759 |
| 1972 | 51.6% 6,112 | 43.2% 5,117 | 5.3% 625 |
| 1968 | 47.0% 5,031 | 46.8% 5,009 | 6.2% 659 |
| 1964 | 31.0% 3,200 | 68.8% 7,101 | 0.2% 22 |
| 1960 | 49.9% 5,231 | 50.0% 5,243 | 0.1% 9 |
| 1956 | 53.6% 5,346 | 46.4% 4,624 | 0.0% 0 |
| 1952 | 60.1% 5,559 | 39.3% 3,632 | 0.7% 61 |
| 1948 | 46.9% 3,587 | 48.6% 3,720 | 4.6% 349 |
| 1944 | 48.2% 2,801 | 50.7% 2,947 | 1.1% 65 |
| 1940 | 45.1% 2,962 | 53.5% 3,510 | 1.4% 93 |
| 1936 | 31.4% 1,585 | 60.0% 3,024 | 8.6% 433 |
| 1932 | 35.4% 1,415 | 59.4% 2,376 | 5.2% 207 |
| 1928 | 57.3% 2,100 | 40.0% 1,464 | 2.7% 99 |
| 1924 | 52.2% 1,328 | 25.2% 641 | 22.6% 575 |
| 1920 | 59.1% 1,229 | 32.2% 669 | 8.8% 182 |
| 1916 | 50.9% 1,167 | 39.9% 915 | 9.2% 212 |
| 1912 | 31.1% 410 | 28.4% 375 | 40.5% 534[19] |
| 1908 | 58.5% 595 | 27.7% 282 | 13.8% 140 |
| 1904 | 64.8% 581 | 20.0% 179 | 15.2% 136 |
Communities

Census-designated places
Unincorporated communities
See also
References
- "State & County QuickFacts". United States Census Bureau. Archived from the original on June 20, 2011. Retrieved November 15, 2013.
- "Find a County". National Association of Counties. Retrieved June 7, 2011.
- Gannett, Henry (1905). The Origin of Certain Place Names in the United States. U.S. Government Printing Office. p. 187.
- Ross, Erin (June 28, 2020). "How Internet Outrage Led to A Change In Lincoln County's Face Mask Policy". OPB.
- Oregon Labor Market Information System
- Bureau of Economic Analysis
- "2010 Census Gazetteer Files". United States Census Bureau. August 22, 2012. Retrieved February 26, 2015.
- "Population and Housing Unit Estimates". Retrieved March 26, 2020.
- "U.S. Decennial Census". United States Census Bureau. Retrieved February 26, 2015.
- "Historical Census Browser". University of Virginia Library. Retrieved February 26, 2015.
- Forstall, Richard L., ed. (March 27, 1995). "Population of Counties by Decennial Census: 1900 to 1990". United States Census Bureau. Retrieved February 26, 2015.
- "Census 2000 PHC-T-4. Ranking Tables for Counties: 1990 and 2000" (PDF). United States Census Bureau. April 2, 2001. Retrieved February 26, 2015.
- "DP-1 Profile of General Population and Housing Characteristics: 2010 Demographic Profile Data". United States Census Bureau. Archived from the original on February 13, 2020. Retrieved February 23, 2016.
- "Population, Housing Units, Area, and Density: 2010 - County". United States Census Bureau. Archived from the original on February 13, 2020. Retrieved February 23, 2016.
- "DP02 SELECTED SOCIAL CHARACTERISTICS IN THE UNITED STATES – 2006-2010 American Community Survey 5-Year Estimates". United States Census Bureau. Archived from the original on February 13, 2020. Retrieved February 23, 2016.
- "DP03 SELECTED ECONOMIC CHARACTERISTICS – 2006-2010 American Community Survey 5-Year Estimates". United States Census Bureau. Archived from the original on February 13, 2020. Retrieved February 23, 2016.
- Menendez, Albert J.; The Geography of Presidential Elections in the United States, 1868-2004, pp. 284-285 ISBN 0786422173
- Leip, David. "Dave Leip's Atlas of U.S. Presidential Elections". uselectionatlas.org. Retrieved April 11, 2018.
- The leading "other" candidate, Progressive Theodore Roosevelt, received 265 votes, while Socialist Eugene Debs received 227 votes, Prohibition candidate Eugene Chafin received 42 votes.
External links
- Lincoln County Official Site
- Accurate statistical information provided by the government of the united states
 Media related to Lincoln County, Oregon at Wikimedia Commons
Places adjacent to Lincoln County, Oregon | ||||||||||
|---|---|---|---|---|---|---|---|---|---|---|
| ||||||||||
Municipalities and communities of Lincoln County, Oregon, United States | ||
|---|---|---|
| Cities | Lincoln County map | |
| CDPs | ||
| Unincorporated communities | ||
| Indian reservation | ||
| Footnotes | ‡This populated place also has portions in an adjacent county or counties | |
| ||
| Authority control |
|---|