Malheur County, Oregon
Malheur County (pronounce:/mælˈhɪər/) is one of the 36 counties in the U.S. state of Oregon. As of the 2010 census, the population was 31,313.[1] Its county seat is Vale,[2] and its largest city is Ontario. The county was named after the Malheur River, which runs through the county. The word "malheur" is French for misfortune or tragedy.[3]
Malheur County | |
|---|---|
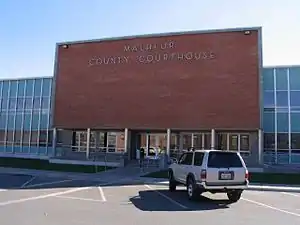 Malheur County Courthouse in Vale | |
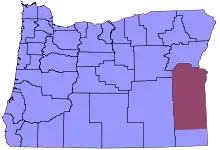
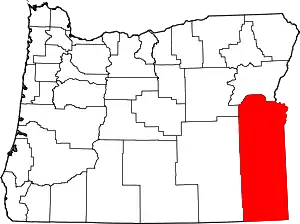 Location within the U.S. state of Oregon | |
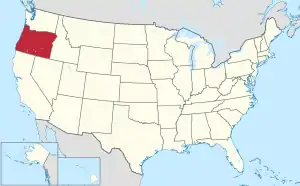 Oregon's location within the U.S. | |
| Coordinates: 43°13′N 117°38′W | |
| Country | |
| State | |
| Founded | February 17, 1887 |
| Named for | Malheur River |
| Seat | Vale |
| Largest city | Ontario |
| Area | |
| • Total | 9,930 sq mi (25,700 km2) |
| • Land | 9,888 sq mi (25,610 km2) |
| • Water | 42 sq mi (110 km2) 0.4%% |
| Population (2010) | |
| • Total | 31,313 |
| • Estimate (2019) | 30,571 |
| • Density | 3.2/sq mi (1.2/km2) |
| Time zones | |
| primary | UTC−7 (Mountain) |
| • Summer (DST) | UTC−6 (MDT) |
| southern fifth | UTC−8 (Pacific) |
| • Summer (DST) | UTC−7 (PDT) |
| Congressional district | 2nd |
| Website | www |
Malheur County is included in the Ontario, Oregon Micropolitan Statistical Area, which is also included in the Boise Combined Statistical Area. It is included in the eight-county definition of Eastern Oregon.
History
Malheur County was created February 17, 1887, from the southern territory of Baker County. It was first settled by miners and stockmen in the early 1860s. The discovery of gold in 1863 attracted further development, including settlements and ranches. Basques settled in the region in the 1890s and were mainly engaged in sheep raising.
Geography
According to the United States Census Bureau, the county has a total area of 9,930 square miles (25,700 km2), of which 9,888 square miles (25,610 km2) is land and 42 square miles (110 km2) (0.4%) is water.[4] It is the second-largest county in Oregon by area and the only county in Oregon in the Mountain Time Zone.
Adjacent counties
- Grant County - northwest/Pacific Time Border
- Baker County - north/Pacific Time Border
- Washington County, Idaho - northeast
- Payette County, Idaho - east
- Canyon County, Idaho - east
- Owyhee County, Idaho - east
- Humboldt County, Nevada - south
- Harney County - west/Pacific Time Border
National protected areas
- Deer Flat National Wildlife Refuge (part)
- Malheur National Forest (part)
- Whitman National Forest (part)
Time zones
Malheur County is one of the few counties in the United States with two time zones. Most of the county is in the Mountain Time Zone, but a small portion in the south is in the Pacific Time Zone.
Demographics
| Historical population | |||
|---|---|---|---|
| Census | Pop. | %± | |
| 1890 | 2,601 | — | |
| 1900 | 4,203 | 61.6% | |
| 1910 | 8,601 | 104.6% | |
| 1920 | 10,907 | 26.8% | |
| 1930 | 11,269 | 3.3% | |
| 1940 | 19,767 | 75.4% | |
| 1950 | 23,223 | 17.5% | |
| 1960 | 22,764 | −2.0% | |
| 1970 | 23,169 | 1.8% | |
| 1980 | 26,896 | 16.1% | |
| 1990 | 26,038 | −3.2% | |
| 2000 | 31,615 | 21.4% | |
| 2010 | 31,313 | −1.0% | |
| 2019 (est.) | 30,571 | [5] | −2.4% |
| U.S. Decennial Census[6] 1790-1960[7] 1900-1990[8] 1990-2000[9] 2010-2019[1] | |||
2000 census
As of the census[10] of 2000, there were 31,615 people, 10,221 households, and 7,348 families living in the county. The population density was 3 people per square mile (1.2/km2). There were 11,233 housing units at an average density of 1 per square mile (0.4/km2). The racial makeup of the county was:
- 75.78% White
- 1.22% Black or African American
- 1.02% Native American
- 1.96% Asian
- 0.08% Pacific Islander
- 17.38% from other races
- 2.56% from two or more races
25.62% of the population were Hispanic or Latino of any race. 14.2% were of German, 10.5% English, 8.4% American and 6.9% Irish ancestry. 79.4% spoke English and 19.4% Spanish as their first language.
There were 10,221 households, out of which 36.20% had children under the age of 18 living with them, 57.30% were married couples living together, 10.40% had a female householder with no husband present, and 28.10% were non-families. 23.70% of all households were made up of individuals, and 12.00% had someone living alone who was 65 years of age or older. The average household size was 2.77 and the average family size was 3.28.
In the county, the population was spread out, with 27.60% under the age of 18, 10.60% from 18 to 24, 27.20% from 25 to 44, 21.00% from 45 to 64, and 13.70% who were 65 years of age or older. The median age was 34 years. For every 100 females, there were 116.00 males. For every 100 females age 18 and over, there were 121.20 males.
The median income for a household in the county was $30,241, and the median income for a family was $35,672. Males had a median income of $25,489 versus $21,764 for females. The per capita income for the county was $13,895. About 14.60% of families and 18.60% of the population were below the poverty line, including 25.80% of those under age 18 and 11.60% of those age 65 or over.
Malheur County is the poorest county in Oregon.[11] As of 2008, 21% of its residents live in poverty.[12]
2010 census
As of the 2010 United States Census, there were 31,313 people, 10,411 households, and 7,149 families living in the county.[13] The population density was 3.2 inhabitants per square mile (1.2/km2). There were 11,692 housing units at an average density of 1.2 per square mile (0.46/km2).[14] The racial makeup of the county was 77.5% white, 1.7% Asian, 1.2% American Indian, 1.2% black or African American, 0.1% Pacific islander, 15.5% from other races, and 2.9% from two or more races. Those of Hispanic or Latino origin made up 31.5% of the population.[13] In terms of ancestry, 16.2% were German, 11.9% were English, 10.3% were Irish, and 9.9% were American.[15]
Of the 10,411 households, 34.8% had children under the age of 18 living with them, 51.6% were married couples living together, 11.8% had a female householder with no husband present, 31.3% were non-families, and 26.0% of all households were made up of individuals. The average household size was 2.69 and the average family size was 3.24. The median age was 36.2 years.[13]
The median income for a household in the county was $39,144 and the median income for a family was $46,136. Males had a median income of $33,234 versus $27,883 for females. The per capita income for the county was $16,335. About 15.2% of families and 22.7% of the population were below the poverty line, including 27.1% of those under age 18 and 10.5% of those age 65 or over.[16]
Politics
.gif)
Like all counties in eastern Oregon, the majority of registered voters who are part of a political party in Malheur County are members of the Republican Party. In the 2008 presidential election, 69.10% of Malheur County voters voted for Republican John McCain, while 28.47% voted for Democrat Barack Obama and 2.42% of voters voted for a third-party candidate. These statistics do not include write-in votes.[18] These numbers show a small shift towards the Democratic candidate when compared to the 2004 presidential election, in which 74.9% of Malheur Country voters voted for George W. Bush, while 23.8% voted for John Kerry, and 1.3% of voters either voted for a third-party candidate or wrote in a candidate.[19]
Malheur County is one of the dominant Republican counties in Oregon when it comes to presidential elections. It was one of only two counties in Oregon to give the majority of its vote to Barry Goldwater and has favored the Republican candidate for decades.[20] The last Democratic candidate to carry the county was Franklin D. Roosevelt in 1940.[21] Further every Republican candidate since 1996 has received more than 60% of the county's vote.[22] Malheur County is also one of the most reliably Republican counties in state elections, for example in the 1998 gubernatorial election it was the only county to vote for Bill Sizemore instead of John Kitzhaber, and in the 1998 U.S. Senate election, it was the only county to vote for state senator John Lim over Ron Wyden.
As part of Oregon's 2nd congressional district it has been represented by Republican Greg Walden since 1999. At the state level, Malheur County is within Oregon's 30th Senate district, represented by Republican Cliff Bentz. In the Oregon House of Representatives 60th district it is represented by Republican Lynn Findley.
| Year | Republican | Democratic | Third parties |
|---|---|---|---|
| 2020 | 69.4% 8,187 | 27.6% 3,260 | 3.0% 357 |
| 2016 | 68.9% 7,194 | 21.5% 2,246 | 9.5% 995 |
| 2012 | 68.8% 6,851 | 27.7% 2,759 | 3.5% 346 |
| 2008 | 68.6% 7,157 | 28.3% 2,949 | 3.1% 327 |
| 2004 | 74.9% 8,123 | 23.8% 2,577 | 1.4% 146 |
| 2000 | 73.3% 7,624 | 22.5% 2,336 | 4.3% 444 |
| 1996 | 61.1% 6,045 | 28.6% 2,827 | 10.3% 1,020 |
| 1992 | 50.4% 5,374 | 23.8% 2,539 | 25.8% 2,750 |
| 1988 | 66.6% 6,285 | 31.4% 2,965 | 2.0% 193 |
| 1984 | 76.2% 8,441 | 23.6% 2,611 | 0.2% 19 |
| 1980 | 67.8% 7,705 | 25.8% 2,937 | 6.4% 722 |
| 1976 | 59.1% 5,682 | 36.5% 3,507 | 4.4% 421 |
| 1972 | 67.4% 5,908 | 21.3% 1,870 | 11.3% 993 |
| 1968 | 65.2% 5,447 | 24.2% 2,021 | 10.7% 892 |
| 1964 | 52.3% 4,177 | 47.6% 3,798 | 0.1% 8 |
| 1960 | 59.9% 5,043 | 40.1% 3,381 | 0.0% 0 |
| 1956 | 61.3% 4,981 | 38.8% 3,151 | 0.0% 0 |
| 1952 | 70.5% 5,414 | 29.2% 2,245 | 0.3% 26 |
| 1948 | 55.4% 3,265 | 42.4% 2,499 | 2.3% 134 |
| 1944 | 55.1% 2,797 | 44.0% 2,234 | 0.9% 47 |
| 1940 | 49.4% 2,929 | 49.9% 2,958 | 0.7% 42 |
| 1936 | 31.4% 1,385 | 59.6% 2,630 | 9.0% 395 |
| 1932 | 42.3% 1,589 | 53.9% 2,025 | 3.7% 140 |
| 1928 | 67.4% 2,164 | 31.6% 1,016 | 1.0% 33 |
| 1924 | 51.9% 1,671 | 25.7% 828 | 22.3% 718 |
| 1920 | 65.0% 2,352 | 29.7% 1,075 | 5.3% 193 |
| 1916 | 42.4% 1,682 | 48.8% 1,937 | 8.8% 350 |
| 1912 | 33.8% 648 | 34.2% 656 | 32.1% 615 |
| 1908 | 54.4% 800 | 36.9% 543 | 8.6% 127 |
| 1904 | 63.8% 799 | 22.4% 280 | 13.8% 173 |
Economy
The county is 94% rangeland, with the Bureau of Land Management controlling 72% of the land. Irrigated fields in the county's northeast corner, known as Western Treasure Valley, are the center of intensive and diversified farming. Malheur County's economy also depends on tourism.
The county's two largest employers are Heinz of Ontario, a potato processor branded as Ore-Ida, and the Snake River Correctional Institution, five miles northwest of Ontario.[12]
Communities

Cities
- Adrian
- Jordan Valley
- Nyssa
- Ontario
- Vale (county seat)
Other unincorporated communities
Ghost towns
- Inskip Station
- Leslie Gulch
- Malheur
- Westfall
See also
- National Register of Historic Places listings in Malheur County, Oregon
- Malheur Enterprise, local newspaper of public record
References
- "State & County QuickFacts". United States Census Bureau. Archived from the original on June 20, 2011. Retrieved November 15, 2013.
- "Find a County". National Association of Counties. Retrieved June 7, 2011.
- "malheur - traduction - Dictionnaire Français-Anglais WordReference.com". www.wordreference.com (in French). Retrieved April 11, 2018.
- "2010 Census Gazetteer Files". United States Census Bureau. August 22, 2012. Retrieved February 26, 2015.
- "Population and Housing Unit Estimates". Retrieved March 26, 2020.
- "U.S. Decennial Census". United States Census Bureau. Retrieved February 26, 2015.
- "Historical Census Browser". University of Virginia Library. Retrieved February 26, 2015.
- Forstall, Richard L., ed. (March 27, 1995). "Population of Counties by Decennial Census: 1900 to 1990". United States Census Bureau. Retrieved February 26, 2015.
- "Census 2000 PHC-T-4. Ranking Tables for Counties: 1990 and 2000" (PDF). United States Census Bureau. April 2, 2001. Retrieved February 26, 2015.
- "U.S. Census website". United States Census Bureau. Retrieved January 31, 2008.
- U.S. Census Data Archived September 23, 2015, at the Wayback Machine
- Jacklet, Ben (April 2008). "Prisontown myth". Oregon Business magazine. Archived from the original on December 2, 2008. Retrieved March 25, 2008.
- "DP-1 Profile of General Population and Housing Characteristics: 2010 Demographic Profile Data". United States Census Bureau. Archived from the original on February 13, 2020. Retrieved February 23, 2016.
- "Population, Housing Units, Area, and Density: 2010 - County". United States Census Bureau. Archived from the original on February 13, 2020. Retrieved February 23, 2016.
- "DP02 SELECTED SOCIAL CHARACTERISTICS IN THE UNITED STATES – 2006-2010 American Community Survey 5-Year Estimates". United States Census Bureau. Archived from the original on February 13, 2020. Retrieved February 23, 2016.
- "DP03 SELECTED ECONOMIC CHARACTERISTICS – 2006-2010 American Community Survey 5-Year Estimates". United States Census Bureau. Archived from the original on February 13, 2020. Retrieved February 23, 2016.
- http://records.sos.state.or.us/ORSOSWebDrawer/Recordpdf/6812402 Retrieved on 4/21/09
- "Archived copy". Archived from the original on August 4, 2012. Retrieved April 21, 2009.CS1 maint: archived copy as title (link) Retrieved on 4/21/09
- http://www.city-data.com/county/Malheur_County-OR.html Retrieved on 4/21/09
- David Leip's Presidential Atlas (Maps for Oregon by election)
- Geographie Electorale
- The New York Times electoral map (Zoom in on Oregon)
- Leip, David. "Dave Leip's Atlas of U.S. Presidential Elections". uselectionatlas.org. Retrieved April 11, 2018.
External links
- Malheur County (official website)
- Information about Malheur County from Oregon State University Malheur Experiment Station
| Wikimedia Commons has media related to Malheur County, Oregon. |
Municipalities and communities of Malheur County, Oregon, United States | ||
|---|---|---|
| Cities | Malheur County map | |
| CDPs | ||
| Other unincorporated communities | ||
| Ghost town | ||
| Indian reservation | ||
| Footnotes | ‡This populated place also has portions in an adjacent county or counties | |
| ||
| Authority control |
|---|