2012 United States presidential election in Oklahoma
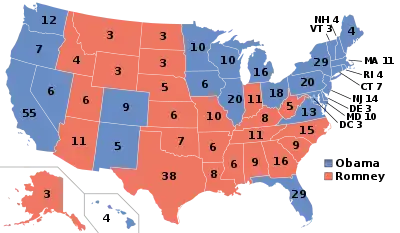
The 2012 United States presidential election in Oklahoma took place on November 6, 2012, as part of the 2012 United States presidential election in which all 50 states plus the District of Columbia participated. Voters chose seven electors to represent them in the Electoral College via a popular vote pitting incumbent Democratic President Barack Obama and his running mate, Vice President Joe Biden, against Republican challenger and former Massachusetts Governor Mitt Romney and his running mate, Congressman Paul Ryan. For the third election in a row since 2004, no third parties were allowed on the ballot.
| ||||||||||||||||||||||||||
| ||||||||||||||||||||||||||
 County Results
Romney 50-60% 60-70% 70-80% 80-90% 90-100%
| ||||||||||||||||||||||||||
| ||||||||||||||||||||||||||
| Elections in Oklahoma |
|---|
 |
|
|
2012 U.S. presidential election | |
|---|---|
| Democratic Party | |
| Republican Party | |
| Related races | |
| |
Oklahoma in recent years has become one of the most conservative states in the nation. For the third year in a row, the Republicans won over 65% of the vote and swept every single county in the state.
With 66.77% of the popular vote to Obama's mere 33.23%, Oklahoma would prove to be Romney's third strongest state in the 2012 election after Utah and Wyoming.[1]
Democratic primary
President Obama faced four challengers in Oklahoma's Democratic primary. Challenger Randall Terry took 12 counties with candidate Jim Rogers winning in three counties. Candidates Bob Ely and Darcy Richardson also appeared on Oklahoma's ballot but failed to obtain a majority of votes in any county.
| 2012 Oklahoma Democratic primary[2] | |||
|---|---|---|---|
| Candidate | Votes | Percentage | Projected national delegates[2] |
| 64,259 | 57.07% | 35 | |
| Randall Terry | 20,294 | 18.02% | 7 |
| Jim Rogers | 15,535 | 13.80% | 3 |
| Darcy Richardson | 7,192 | 6.39% | 0 |
| Bob Ely | 5,318 | 4.72% | 0 |
| Totals | 112,598 | 100.00% | 45 |
Republican primary
The Republican primary took place on Super Tuesday, March 6, 2012.[3][4]
Oklahoma has 43 delegates to the 2012 Republican National Convention. Three super delegates are unbound by the primary results. 15 delegates are allocated by congressional districts, 3 delegates for each district. If a candidate gets a majority in the district, he takes all 3 delegates; if no one gets a majority, the delegates are split either 2-to-1 or 1-1-1 depending on how many candidates get at least 15% of the vote. Another 25 delegates are awarded to the candidate who wins a majority in the state, or allocated proportionately among candidates winning at least 15% of the vote statewide if no one gets majority.[5]
| 2012 Oklahoma Republican primary[6] | |||
|---|---|---|---|
| Candidate | Votes | Percentage | Projected national delegates[7] |
| 96,849 | 33.8% | 14 | |
| Mitt Romney | 80,356 | 28.0% | 13 |
| Newt Gingrich | 78,730 | 27.5% | 13 |
| Ron Paul | 27,596 | 9.6% | 0 |
| Rick Perry | 1,291 | 0.45% | 0 |
| Michele Bachmann | 951 | 0.33% | 0 |
| Jon Huntsman | 750 | 0.26% | 0 |
| Unprojected delegates | 3 | ||
| Totals | 286,523 | 100.0% | 43 |
| Key: | Withdrew prior to contest |
Republican Conventions for Oklahoma's Congressional Districts
Fifteen delegates to the 2012 Republican national convention were elected at congressional-district conventions March 31 to April 14, 2012 — three from each of Oklahoma's five congressional districts.[8][9]
Oklahoma Republican Convention
The Oklahoma Republican State Convention was held May 11–12, 2012 in Norman. Irregularities were reported.[8][10]
At least two Ron Paul supporters said they were physically attacked by Romney supporters.[11][12]
Oklahoma's (Republican) Governor Mary Fallin tried to speak at the convention. After loud chants of "Ron Paul" from the floor, she stated (referring to Romney) "We have a presidential nominee", resulting in loud booing.[12]
Paul supporters said that the convention was stopped with unfinished business, without a two-thirds vote, and therefore against parliamentary procedure.[13] It was reported that, after the convention was said to be adjourned, a partition in the room was moved, isolating many attendees from the rest of the body. The lights were turned out momentarily.[10]
After the convention was stopped and the chairman left, many Paul supporters assembled outside and held a rump convention, chaired by Jake Peters, at which they elected a slate of Paul supporters as delegates to the national convention.[12][14]
Four Paul supporters, including Jake Peters, made a formal complaint to the Oklahoma Republican Party, saying that Party rules were broken by failing to take a roll-call vote on the delegate slate and that the convention was adjourned without the required vote. The complaint asserted that state law is involved in the Republican Party's nominating process and cited case law to the effect that party process should be considered "an integral part of the State's election system".[13][15][16]
General election
Slates of Electors
Democrat: Isabel Baker, Doug Dodd, Carl Downing, Connie Johnson, Judy Eason McIntyre, Mack Miller, Martha Skeeters
Republican: David Holt, Lynn Windel, Lawrence A. Williamson, Joe Peters, Mark Thomas, Jason Cowen, Duane Crumbacher[17]
Results
| 2012 United States presidential election in Oklahoma[18] | ||||||
|---|---|---|---|---|---|---|
| Party | Candidate | Running mate | Votes | Percentage | Electoral votes | |
| Republican | Mitt Romney | Paul Ryan | 891,325 | 66.77% | 7 | |
| Democratic | Barack Obama | Joe Biden | 443,547 | 33.23% | 0 | |
| Totals | 1,334,872 | 100.00% | 7 | |||
By county
Note: The Oklahoma SoS website only lists the Democrat and Republican results. No third-party results are available.
| County | Obama% | Obama# | Romney% | Romney# | Total |
|---|---|---|---|---|---|
| Adair | 32.68% | 2,127 | 67.32% | 4,381 | 6,508 |
| Alfalfa | 15.46% | 322 | 84.54% | 1,761 | 2,083 |
| Atoka | 26.00% | 1,243 | 74.00% | 3,538 | 4,781 |
| Beaver | 10.58% | 244 | 89.42% | 2,062 | 2,306 |
| Beckham | 20.46% | 1,417 | 79.54% | 5,508 | 6,925 |
| Blaine | 26.00% | 992 | 74.00% | 2,824 | 3,816 |
| Bryan | 27.88% | 3,681 | 72.12% | 9,520 | 13,201 |
| Caddo | 35.75% | 3,164 | 64.25% | 5,687 | 8,851 |
| Canadian | 22.83% | 10,537 | 77.17% | 35,625 | 46,162 |
| Carter | 28.66% | 4,908 | 71.34% | 12,214 | 17,122 |
| Cherokee | 42.95% | 6,144 | 57.05% | 8,162 | 14,306 |
| Choctaw | 29.49% | 1,494 | 70.51% | 3,572 | 5,066 |
| Cimarron | 09.61% | 115 | 90.39% | 1,082 | 1,197 |
| Cleveland | 37.03% | 34,771 | 62.97% | 59,116 | 93,887 |
| Coal | 27.51% | 649 | 72.49% | 1,710 | 2,359 |
| Comanche | 41.48% | 12,521 | 58.52% | 17,664 | 30,185 |
| Cotton | 26.78% | 657 | 73.22% | 1,796 | 2,453 |
| Craig | 32.92% | 1,747 | 67.08% | 3,559 | 5,306 |
| Creek | 27.30% | 7,128 | 72.70% | 18,986 | 26,114 |
| Custer | 24.06% | 2,359 | 75.94% | 7,446 | 9,805 |
| Delaware | 29.39% | 4,196 | 70.61% | 10,080 | 14,276 |
| Dewey | 14.38% | 301 | 85.62% | 1,792 | 2,093 |
| Ellis | 12.55% | 226 | 87.45% | 1,575 | 1,801 |
| Garfield | 23.77% | 4,733 | 76.23% | 15,177 | 19,910 |
| Garvin | 26.98% | 2,559 | 73.02% | 6,925 | 9,484 |
| Grady | 24.39% | 4,786 | 75.61% | 14,833 | 19,619 |
| Grant | 19.00% | 393 | 81.00% | 1,675 | 2,068 |
| Greer | 26.64% | 488 | 73.36% | 1,344 | 1,832 |
| Harmon | 28.60% | 264 | 71.40% | 659 | 923 |
| Harper | 12.06% | 173 | 87.94% | 1,261 | 1,434 |
| Haskell | 27.69% | 1,175 | 72.31% | 3,069 | 4,244 |
| Hughes | 32.56% | 1,370 | 67.44% | 2,838 | 4,208 |
| Jackson | 24.67% | 1,954 | 75.33% | 5,965 | 7,919 |
| Jefferson | 27.02% | 605 | 72.98% | 1,634 | 2,239 |
| Johnston | 30.03% | 1,137 | 69.97% | 2,649 | 3,786 |
| Kay | 28.69% | 4,627 | 71.31% | 11,499 | 16,126 |
| Kingfisher | 15.57% | 898 | 84.43% | 4,870 | 5,768 |
| Kiowa | 32.32% | 1,106 | 67.68% | 2,316 | 3,422 |
| Latimer | 30.81% | 1,170 | 69.19% | 2,628 | 3,798 |
| Le Flore | 29.43% | 4,662 | 70.57% | 11,177 | 15,839 |
| Lincoln | 25.52% | 3,273 | 74.48% | 9,553 | 12,826 |
| Logan | 27.73% | 4,724 | 72.27% | 12,314 | 17,038 |
| Love | 29.80% | 1,034 | 70.20% | 2,436 | 3,470 |
| Major | 14.2% | 446 | 85.8% | 2,700 | 3,146 |
| Marshall | 27.2% | 1,396 | 72.8% | 3,744 | 5,140 |
| Mayes | 33.4% | 4,823 | 66.6% | 9,637 | 14,460 |
| McClain | 22.3% | 3,194 | 77.7% | 11,112 | 14,306 |
| McCurtain | 24.2% | 2,440 | 75.8% | 7,635 | 10,075 |
| McIntosh | 38.1% | 2,779 | 61.9% | 4,509 | 7,288 |
| Murray | 29.9% | 1,540 | 70.1% | 3,606 | 5,146 |
| Muskogee | 42.6% | 9,952 | 57.4% | 13,404 | 23,356 |
| Noble | 24.68% | 1,143 | 75.32% | 3,488 | 4,631 |
| Nowata | 30.52% | 1,244 | 69.48% | 2,832 | 4,076 |
| Okfuskee | 34.98% | 1,256 | 65.02% | 2,335 | 3,591 |
| Oklahoma | 41.67% | 106,982 | 58.33% | 149,728 | 256,710 |
| Okmulgee | 41.27% | 5,432 | 58.73% | 7,731 | 13,163 |
| Osage | 37.36% | 6,704 | 62.64% | 11,242 | 17,946 |
| Ottawa | 35.18% | 3,509 | 64.82% | 6,466 | 9,975 |
| Pawnee | 29.99% | 1,813 | 70.01% | 4,232 | 6,045 |
| Payne | 35.82% | 9,198 | 64.18% | 16,481 | 25,679 |
| Pittsburg | 30.83% | 4,831 | 69.17% | 10,841 | 15,672 |
| Pontotoc | 30.62% | 3,947 | 69.38% | 8,945 | 12,892 |
| Pottawatomie | 30.67% | 7,188 | 69.33% | 16,250 | 23,438 |
| Pushmataha | 25.25% | 1,043 | 74.75% | 3,087 | 4,130 |
| Roger Mills | 16.25% | 272 | 83.75% | 1,402 | 1,674 |
| Rogers | 24.93% | 9,148 | 75.07% | 27,553 | 36,701 |
| Seminole | 34.87% | 2,600 | 65.13% | 4,856 | 7,456 |
| Sequoyah | 30.45% | 4,193 | 69.55% | 9,578 | 13,771 |
| Stephens | 23.38% | 3,939 | 76.62% | 12,908 | 16,847 |
| Texas | 14.88% | 862 | 85.12% | 4,930 | 5,792 |
| Tillman | 33.30% | 906 | 66.70% | 1,815 | 2,721 |
| Tulsa | 36.32% | 82,744 | 63.68% | 145,062 | 227,806 |
| Wagoner | 27.15% | 7,791 | 72.85% | 20,900 | 28,691 |
| Washington | 26.09% | 5,532 | 73.91% | 15,668 | 21,200 |
| Washita | 19.05% | 822 | 80.95% | 3,494 | 4,316 |
| Woods | 19.75% | 671 | 80.25% | 2,727 | 3,398 |
| Woodward | 16.01% | 1,133 | 83.99% | 5,945 | 7,078 |
Analysis
As expected, Mitt Romney swept every county in the state, carrying 66.77% of the vote to Obama's measly 33.23%. Romney capitalized on his strength amongst white and conservative voters – Oklahoma's population is 65.6% white[19] (a demographic Romney won nationwide by 59% to Obama's 39%)[20] and the state has a Cook Partisan Voting Index of R+20, tied for the second most Republican in the nation along with Utah.[21] His strongest performance was in the Oklahoma Panhandle, one of the most staunchly conservative regions in the country, where he garnered 80% to 90% of the vote in many of these counties. Romney also performed well in the Little Dixie region and on the state's border with Texas. Despite many counties having a plurality of registered Democratic voters exceeding the number of registered Republicans (such as Comanche and Okmulgee),[22] Obama failed to carry any counties. However, Obama was still able to garner margins of around 45% to Romney's 55% in some counties, such as Cherokee County (Obama's best performance), which is 36.4% Native American and home to the capital of the Cherokee Nation, Tahlequah,[23][24] and Muskogee County, which is located in the Creek Nation.[25] He also had a formidable, but still lackluster, performance in Oklahoma County, home to the state's capital and largest city, Oklahoma City, which is quite conservative despite being the state's most urban region.
See also
References
- "2012 Presidential Election Statistics". Dave Leip's Atlas of U.S. Presidential Elections. Retrieved 2018-03-05.
- The Green Papers, Retrieved July 8, 2015
- "Primary and Caucus Printable Calendar". CNN. Retrieved January 12, 2012.
- "Presidential Primary Dates" (PDF). Federal Election Commission. Retrieved January 23, 2012.
- Nate Silver (March 4, 2012). "Romney Could Win Majority of Super Tuesday Delegates". FiveThirtyEight. Retrieved March 5, 2012.
- State of Oklahoma Unofficial Results, Retrieved March 23, 2012
- The Green Papers, Retrieved April 27
- "Oklahoma Republican Presidential Nominating Process". Retrieved May 16, 2012.
- McNutt, Michael (May 13, 2012). "Oklahoma Republicans elect delegates to national convention". newsok.com. Retrieved May 16, 2012.
- "Rachel Maddow Discusses Ron Paul & GOP Conventions Chaos". May 14, 2012. Retrieved May 15, 2012.
- "2 Romney Supporters ASSAULT 2 Ron Paul Supporters in OK". www.youtube.com R11110000. May 13, 2012. Retrieved May 25, 2012.
- "Violent OK GOP State Convention". newsODP/www.youtube.com. Retrieved May 15, 2012.
- "Ron Paul Supporters Submit Challenge to Oklahoma GOP State Convention". Retrieved May 25, 2012.
- "Ron Paul Supporters Stage Rump Convention in OK – May 12, 2012". Archived from the original on May 15, 2012. Retrieved May 15, 2012.
- "Rules of the Oklahoma Republican Party, Amended August 27, 2011" (PDF). Retrieved May 25, 2012.
- "Report of the Committee on Rules and Order of Business". Oklahoma Republican State Convention. May 12, 2012. Retrieved May 25, 2012.
- https://www.flickr.com/photos/programwitch/8161047259
- "Oklahoma State Election Board". Retrieved 2012-11-24.
- "State Population By Race, Ethnicity Data". www.governing.com. Retrieved 2020-09-27.
- "President Exit Polls". The New York Times. ISSN 0362-4331. Retrieved 2020-09-27.
- "State PVIs". The Cook Political Report. Retrieved 2020-09-27.
- "Current Registration Statistics by County" (PDF). Oklahoma State Election Board. January 15, 2019. Retrieved September 27, 2020.
- "U.S. Census Bureau QuickFacts: Cherokee County, Oklahoma". www.census.gov. Retrieved 2020-09-27.
- "Cherokee County | The Encyclopedia of Oklahoma History and Culture". www.okhistory.org. Retrieved 2020-09-27.
- "Muskogee County | The Encyclopedia of Oklahoma History and Culture". www.okhistory.org. Retrieved 2020-09-27.
External links
- The Green Papers: for Oklahoma
- The Green Papers: Major state elections in chronological order