2012 United States presidential election in Texas
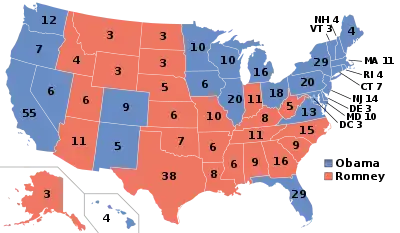
The 2012 United States presidential election in Texas took place on November 6, 2012, as part of the 2012 United States presidential election in which all 50 states plus the District of Columbia participated. Texas voters chose 38 electors to represent them in the Electoral College via a popular vote pitting incumbent Democratic President Barack Obama and his running mate, Vice President Joe Biden, against Republican challenger and former Massachusetts Governor Mitt Romney and his running mate, Congressman Paul Ryan.
| ||||||||||||||||||||||||||
| Turnout | 58.6% (of registered voters) 43.7% (of voting age population)[1] | |||||||||||||||||||||||||
|---|---|---|---|---|---|---|---|---|---|---|---|---|---|---|---|---|---|---|---|---|---|---|---|---|---|---|
| ||||||||||||||||||||||||||
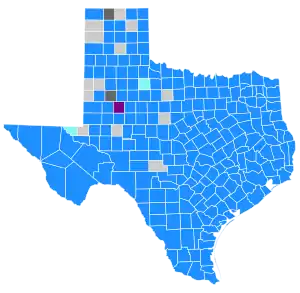
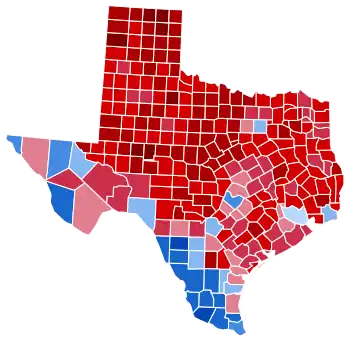 County Results
| ||||||||||||||||||||||||||
| ||||||||||||||||||||||||||
| Elections in Texas |
|---|
 |
|
|
As one of the largest Republican strongholds in the country, Romney won the Lone Star State with 57.17%, over Barack Obama's 41.38%, a margin of 15.78%. As in past elections, President Obama and the Democrats dominated the Rio Grande Valley, winning upwards of 70% or 80% of the vote in most of these counties, with his best performance in Starr County at 86.34% to Romney's 13.02%, a 73.32% margin. Further, he won the major urban centers of Austin, El Paso, Dallas, Houston, and San Antonio, but Republicans were able to overwhelm the urban vote by sweeping the vast rural areas and suburbs of Texas by large margins. Romney also came extremely close to carrying Harris County, home to Houston, which Obama carried by only 0.08%, or 971 votes.[2] In the process Romney beat George W. Bush's 2004 record of the most votes for a presidential candidate in Texas, a record later surpassed in 2016 by Donald Trump and in 2020 by both Trump and Joe Biden. By receiving 95.86% of the vote in King County,[3] Romney also recorded the highest proportion of any county's vote cast for one candidate since Barry Goldwater received between 95.92 and 96.59% of the vote in seven Mississippi counties[lower-alpha 1] in 1964 – although this occurred when African-American majorities in these counties had been almost totally disenfranchised for seven-and-a-half decades.
Texas's 38 electoral votes were Romney's largest electoral prize in the election. The state solidified its Republican identity in the Reagan Era and has not voted for a Democratic presidential nominee since fellow Southerner Jimmy Carter carried it in 1976. The oil industry is the driving factor of the state's economy, with numerous oil companies such as ExxonMobil being based in the state,[4] and consequently the state has rejected the Democratic Party which has increasingly embraced environmentalist policies. In addition, moderate Republicans' popularity among suburban Texans has only boosted their support. However, although Romney improved on John McCain's 2008 performance, this election solidified the Texas urban areas' move away from the GOP. Dallas and Harris Counties, home to Dallas and Houston respectively, which flipped in 2008, remained there this year, setting the stage for suburban areas beginning to slip from the Republican Party.
As a consequence, this is the last time Texas was decided by a double digit margin of victory. Following this election and the loss of the Republican Party's former hold on the vast suburbs of Austin, Dallas–Fort Worth, and Houston, it would become a Republican-leaning state,[5] voting for Donald Trump by only 8.99% in 2016[6] and 5.58% in 2020.[7]
As of 2020, this is the last election that Fort Bend County has voted for the Republican nominee and the last time Jefferson County voted for the Democratic nominee.
Democratic primary
| |||||||||||||||||||
| |||||||||||||||||||
 Texas results by county
Barack Obama
John Wolfe Jr.
Bob Ely
Tie
No votes | |||||||||||||||||||

The 2012 Texas Democratic Primary was held on May 29, 2012. Incumbent Barack Obama, who was running for the nomination without any major opposition, won the primary with 88.18% of the vote, and was awarded all of Texas' 287 delegates to the 2012 Democratic National Convention.
| Texas Democratic primary, 2012[8] | |||
|---|---|---|---|
| Candidate | Votes | Percentage | Delegates |
| 520,410 | 88.18% | 287 | |
| John Wolfe Jr. | 29,879 | 5.06% | 0 |
| Darcy Richardson | 25,430 | 4.31% | 0 |
| Bob Ely | 14,445 | 2.45% | 0 |
| Total: | 590,164 | 100.0% | 287 |
| Key: | Withdrew prior to contest |
Republican primary
| |||||||||||||||||||||||||
| |||||||||||||||||||||||||
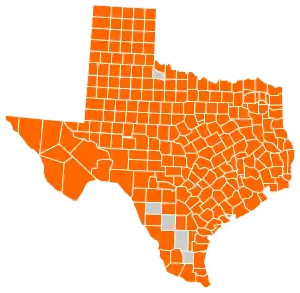 Texas results by county
Mitt Romney
No votes
(Note: Italicization indicates a withdrawn candidacy) | |||||||||||||||||||||||||
.jpg.webp)
The Republican primary was held May 29, 2012.[9][10]
152 delegates were chosen, for a total of 155 delegates to go to the national convention.
The election was originally scheduled to take place on Super Tuesday, March 6.[11] Due to litigation over the state's redistricting following the 2010 United States Census, it was rescheduled for April 3.[12][13] That date also became uncertain and the primary was expected to be held, at the earliest, in late May 2012, with both May 22[11] and May 29[14] being proposed. U.S. District Court judge Xavier Rodriguez, one of the three judges overseeing the litigation, had suggested a June 26 date for the election.[11] Finally, on March 1, 2012, the court issued an order setting the date of the primary to May 29, 2012.[9]
| Texas Republican primary, 2012[15] | |||
|---|---|---|---|
| Candidate | Votes | Percentage | Delegates |
| 1,001,387 | 69% | 105 | |
| Ron Paul | 174,207 | 12.02% | 18 |
| Rick Santorum | 115,584 | 7.97% | 12 |
| Newt Gingrich | 68,247 | 4.71% | 7 |
| Uncommited | 60,659 | 4.18% | 6 |
| Michele Bachmann | 12,097 | 0.83% | 1 |
| Jon Huntsman | 8,695 | 0.60% | 1 |
| Buddy Roemer | 4,714 | 0.33% | 0 |
| L. John Davis Jr. | 3,887 | 0.27% | 0 |
| Unpledged delegates: | 4 | ||
| Superdelegates: | 3 | ||
| Total: | 1,449,477 | 100.0% | 155 |
| Key: | Withdrew prior to contest |
General election
Candidate ballot access:
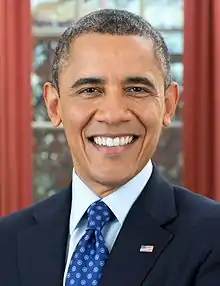
- Barack Hussein Obama / Joseph Robinette Biden, Jr., Democratic
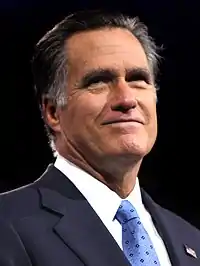
- Willard Mitt Romney / Paul Davis Ryan, Republican
- Gary Earl Johnson / James Polin Gray, Libertarian
- Jill Ellen Stein / Cheri Lynn Honkala, Green
Write-in candidate access:
Results
| 2012 United States presidential election in Texas [16] | ||||||
|---|---|---|---|---|---|---|
| Party | Candidate | Running mate | Votes | Percentage | Electoral votes | |
| Republican | Mitt Romney | Paul Ryan | 4,569,843 | 57.17% | 38 | |
| Democratic | Barack Obama | Joe Biden | 3,308,124 | 41.38% | 0 | |
| Libertarian | Gary Johnson | Jim Gray | 88,580 | 1.11% | 0 | |
| Green | Jill Stein | Cheri Honkala | 24,657 | 0.31% | 0 | |
| Constitution (Write-in) | Virgil Goode | Jim Clymer | 1,287 | 0.02% | 0 | |
| Justice (Write-in) | Rocky Anderson | Luis J. Rodriguez | 426 | 0.01% | 0 | |
| America's Party (Write-in) | Thomas Hoefling | Jonathan D. Ellis | 374 | 0.00% | 0 | |
| Other Write-ins | 311 | 0.00% | 0 | |||
| Socialist (Write-in) | Stewart Alexander | Alex Mendoza | 162 | 0.00% | 0 | |
| Reform (Write-in) | Andre Barnett | Kenneth Cross | 87 | 0.00% | 0 | |
| Totals | 7,993,851 | 100.00% | 38 | |||
| Voter turnout (Voting age population) | 43.73% | |||||
By county
| County | Romney % | Romney # | Obama % | Obama # | Others % | Others # | Total |
|---|---|---|---|---|---|---|---|
| Anderson | 75.64% | 12,262 | 23.52% | 3,813 | 0.85% | 137 | 16,212 |
| Andrews | 81.19% | 3,639 | 17.74% | 795 | 1.07% | 48 | 4,482 |
| Angelina | 71.47% | 20,303 | 27.58% | 7,834 | 0.95% | 269 | 28,406 |
| Aransas | 70.79% | 6,830 | 28.03% | 2,704 | 1.18% | 114 | 9,648 |
| Archer | 86.46% | 3,600 | 12.61% | 525 | 0.94% | 39 | 4,164 |
| Armstrong | 88.56% | 828 | 10.48% | 98 | 0.96% | 9 | 935 |
| Atascosa | 58.65% | 7,461 | 40.35% | 5,133 | 1.00% | 127 | 12,721 |
| Austin | 79.53% | 9,265 | 19.33% | 2,252 | 1.13% | 132 | 11,649 |
| Bailey | 73.73% | 1,339 | 25.66% | 466 | 0.61% | 11 | 1,816 |
| Bandera | 78.60% | 7,426 | 19.73% | 1,864 | 1.67% | 158 | 9,448 |
| Bastrop | 57.32% | 14,033 | 40.29% | 9,864 | 2.39% | 584 | 24,481 |
| Baylor | 81.47% | 1,297 | 16.77% | 267 | 1.76% | 28 | 1,592 |
| Bee | 55.29% | 4,356 | 43.81% | 3,452 | 0.90% | 71 | 7,879 |
| Bell | 57.51% | 49,574 | 41.19% | 35,512 | 1.30% | 1,120 | 86,206 |
| Bexar | 47.04% | 241,617 | 51.56% | 264,856 | 1.40% | 7,208 | 513,681 |
| Blanco | 73.16% | 3,638 | 24.53% | 1,220 | 2.31% | 115 | 4,973 |
| Borden | 89.26% | 324 | 8.82% | 32 | 1.93% | 7 | 363 |
| Bosque | 80.00% | 5,885 | 18.58% | 1,367 | 1.41% | 104 | 7,356 |
| Bowie | 70.24% | 24,869 | 28.80% | 10,196 | 0.96% | 339 | 35,404 |
| Brazoria | 66.39% | 70,862 | 32.25% | 34,421 | 1.36% | 1,456 | 106,739 |
| Brazos | 66.49% | 37,209 | 31.23% | 17,477 | 2.28% | 1,276 | 55,962 |
| Brewster | 51.10% | 1,976 | 45.64% | 1,765 | 3.26% | 126 | 3,867 |
| Briscoe | 82.34% | 578 | 16.67% | 117 | 1.00% | 7 | 702 |
| Brooks | 21.10% | 507 | 78.49% | 1,886 | 0.42% | 10 | 2,403 |
| Brown | 85.29% | 11,895 | 13.65% | 1,904 | 1.06% | 148 | 13,947 |
| Burleson | 72.35% | 4,671 | 26.41% | 1,705 | 1.24% | 80 | 6,456 |
| Burnet | 76.46% | 12,843 | 21.87% | 3,674 | 1.66% | 279 | 16,796 |
| Caldwell | 54.40% | 6,021 | 43.29% | 4,791 | 2.31% | 256 | 11,068 |
| Calhoun | 62.33% | 4,144 | 36.25% | 2,410 | 1.41% | 94 | 6,648 |
| Callahan | 84.24% | 4,378 | 14.45% | 751 | 1.31% | 68 | 5,197 |
| Cameron | 33.94% | 26,099 | 64.99% | 49,975 | 1.07% | 821 | 76,895 |
| Camp | 66.46% | 2,881 | 32.94% | 1,428 | 0.60% | 26 | 4,335 |
| Carson | 88.23% | 2,451 | 10.51% | 292 | 1.26% | 35 | 2,778 |
| Cass | 74.34% | 8,763 | 24.80% | 2,924 | 0.86% | 101 | 11,788 |
| Castro | 69.37% | 1,470 | 29.73% | 630 | 0.90% | 19 | 2,119 |
| Chambers | 79.99% | 11,787 | 18.93% | 2,790 | 1.07% | 158 | 14,735 |
| Cherokee | 75.00% | 12,094 | 24.03% | 3,875 | 0.97% | 157 | 16,126 |
| Childress | 83.42% | 1,665 | 16.03% | 320 | 0.55% | 11 | 1,996 |
| Clay | 84.36% | 4,266 | 14.63% | 740 | 1.01% | 51 | 5,057 |
| Cochran | 70.77% | 649 | 27.92% | 256 | 1.31% | 12 | 917 |
| Coke | 86.51% | 1,218 | 12.71% | 179 | 0.78% | 11 | 1,408 |
| Coleman | 86.25% | 3,012 | 12.66% | 442 | 1.09% | 38 | 3,492 |
| Collin | 65.02% | 196,888 | 33.49% | 101,415 | 1.49% | 4,518 | 302,821 |
| Collingsworth | 83.65% | 962 | 15.39% | 177 | 0.96% | 11 | 1,150 |
| Colorado | 74.24% | 6,026 | 25.00% | 2,029 | 0.76% | 62 | 8,117 |
| Comal | 76.30% | 39,318 | 22.22% | 11,450 | 1.48% | 761 | 51,529 |
| Comanche | 80.39% | 3,944 | 18.14% | 890 | 1.47% | 72 | 4,906 |
| Concho | 79.22% | 793 | 19.38% | 194 | 1.40% | 14 | 1,001 |
| Cooke | 83.28% | 11,951 | 15.65% | 2,246 | 1.07% | 154 | 14,351 |
| Coryell | 67.57% | 11,220 | 31.06% | 5,158 | 1.36% | 226 | 16,604 |
| Cottle | 74.90% | 555 | 24.29% | 180 | 0.81% | 6 | 741 |
| Crane | 76.77% | 985 | 21.43% | 275 | 1.79% | 23 | 1,283 |
| Crockett | 65.68% | 957 | 32.94% | 480 | 1.37% | 20 | 1,457 |
| Crosby | 63.35% | 1,132 | 35.76% | 639 | 0.90% | 16 | 1,787 |
| Culberson | 33.56% | 295 | 64.62% | 568 | 1.82% | 16 | 879 |
| Dallam | 81.36% | 1,248 | 16.49% | 253 | 2.15% | 33 | 1,534 |
| Dallas | 41.66% | 295,813 | 57.11% | 405,571 | 1.23% | 8,733 | 710,117 |
| Dawson | 71.14% | 2,591 | 27.98% | 1,019 | 0.88% | 32 | 3,642 |
| Deaf Smith | 70.60% | 3,042 | 28.75% | 1,239 | 0.65% | 28 | 4,309 |
| Delta | 75.52% | 1,524 | 22.50% | 454 | 1.98% | 40 | 2,018 |
| Denton | 64.91% | 157,579 | 33.35% | 80,978 | 1.74% | 4,224 | 242,781 |
| DeWitt | 77.16% | 5,122 | 22.10% | 1,467 | 0.74% | 49 | 6,638 |
| Dickens | 77.82% | 793 | 21.20% | 216 | 0.98% | 10 | 1,019 |
| Dimmit | 26.12% | 762 | 73.40% | 2,141 | 0.48% | 14 | 2,917 |
| Donley | 83.84% | 1,287 | 14.72% | 226 | 1.43% | 22 | 1,535 |
| Duval | 22.56% | 980 | 76.68% | 3,331 | 0.76% | 33 | 4,344 |
| Eastland | 83.82% | 5,444 | 14.93% | 970 | 1.25% | 81 | 6,495 |
| Ector | 73.85% | 24,010 | 24.97% | 8,118 | 1.18% | 385 | 32,513 |
| Edwards | 72.62% | 642 | 26.24% | 232 | 1.13% | 10 | 884 |
| El Paso | 33.15% | 57,150 | 65.51% | 112,952 | 1.34% | 2,310 | 172,412 |
| Ellis | 73.08% | 39,574 | 25.63% | 13,881 | 1.29% | 696 | 54,151 |
| Erath | 82.81% | 10,329 | 15.75% | 1,965 | 1.44% | 179 | 12,473 |
| Falls | 61.76% | 3,356 | 37.41% | 2,033 | 0.83% | 45 | 5,434 |
| Fannin | 75.54% | 8,161 | 23.01% | 2,486 | 1.45% | 157 | 10,804 |
| Fayette | 76.83% | 8,106 | 21.94% | 2,315 | 1.23% | 130 | 10,551 |
| Fisher | 67.16% | 1,094 | 31.43% | 512 | 1.41% | 23 | 1,629 |
| Floyd | 73.05% | 1,523 | 26.43% | 551 | 0.53% | 11 | 2,085 |
| Foard | 70.30% | 348 | 28.28% | 140 | 1.41% | 7 | 495 |
| Fort Bend | 52.91% | 116,126 | 46.08% | 101,144 | 1.01% | 2,219 | 219,489 |
| Franklin | 80.95% | 3,446 | 17.64% | 751 | 1.41% | 60 | 4,257 |
| Freestone | 74.58% | 5,646 | 24.44% | 1,850 | 0.98% | 74 | 7,570 |
| Frio | 39.29% | 1,559 | 59.88% | 2,376 | 0.83% | 33 | 3,968 |
| Gaines | 85.69% | 3,484 | 13.16% | 535 | 1.16% | 47 | 4,066 |
| Galveston | 62.74% | 69,059 | 35.89% | 39,511 | 1.37% | 1,508 | 110,078 |
| Garza | 80.96% | 1,263 | 17.88% | 279 | 1.15% | 18 | 1,560 |
| Gillespie | 82.12% | 10,306 | 16.37% | 2,055 | 1.51% | 189 | 12,550 |
| Glasscock | 91.00% | 526 | 7.61% | 44 | 1.38% | 8 | 578 |
| Goliad | 66.34% | 2,294 | 32.59% | 1,127 | 1.07% | 37 | 3,458 |
| Gonzales | 69.61% | 4,216 | 29.34% | 1,777 | 1.06% | 64 | 6,057 |
| Gray | 87.20% | 6,443 | 11.99% | 886 | 0.81% | 60 | 7,389 |
| Grayson | 73.20% | 30,936 | 25.25% | 10,670 | 1.56% | 658 | 42,264 |
| Gregg | 69.25% | 28,742 | 29.87% | 12,398 | 0.88% | 367 | 41,507 |
| Grimes | 71.40% | 6,141 | 27.19% | 2,339 | 1.41% | 121 | 8,601 |
| Guadalupe | 66.88% | 33,117 | 31.80% | 15,744 | 1.32% | 653 | 49,514 |
| Hale | 73.30% | 6,490 | 25.33% | 2,243 | 1.37% | 121 | 8,854 |
| Hall | 75.02% | 832 | 23.90% | 265 | 1.08% | 12 | 1,109 |
| Hamilton | 82.15% | 2,918 | 16.64% | 591 | 1.21% | 43 | 3,552 |
| Hansford | 91.13% | 1,788 | 8.10% | 159 | 0.76% | 15 | 1,962 |
| Hardeman | 78.66% | 1,176 | 20.20% | 302 | 1.14% | 17 | 1,495 |
| Hardin | 83.33% | 17,746 | 15.77% | 3,359 | 0.90% | 192 | 21,297 |
| Harris | 49.31% | 586,073 | 49.39% | 587,044 | 1.30% | 15,468 | 1,188,585 |
| Harrison | 66.92% | 17,512 | 32.31% | 8,456 | 0.77% | 202 | 26,170 |
| Hartley | 89.28% | 1,708 | 9.62% | 184 | 1.10% | 21 | 1,913 |
| Haskell | 70.74% | 1,424 | 27.47% | 553 | 1.79% | 36 | 2,013 |
| Hays | 53.65% | 31,661 | 43.27% | 25,537 | 3.07% | 1,813 | 59,011 |
| Hemphill | 86.02% | 1,298 | 12.72% | 192 | 1.26% | 19 | 1,509 |
| Henderson | 76.85% | 21,231 | 22.10% | 6,106 | 1.05% | 290 | 27,627 |
| Hidalgo | 28.65% | 39,865 | 70.40% | 97,969 | 0.95% | 1,325 | 139,159 |
| Hill | 75.82% | 9,132 | 22.85% | 2,752 | 1.34% | 161 | 12,045 |
| Hockley | 77.74% | 5,546 | 20.83% | 1,486 | 1.43% | 102 | 7,134 |
| Hood | 81.69% | 18,409 | 17.05% | 3,843 | 1.26% | 283 | 22,535 |
| Hopkins | 77.13% | 9,836 | 21.78% | 2,777 | 1.10% | 140 | 12,753 |
| Houston | 71.59% | 5,880 | 27.57% | 2,265 | 0.84% | 69 | 8,214 |
| Howard | 74.22% | 6,453 | 24.27% | 2,110 | 1.52% | 132 | 8,695 |
| Hudspeth | 54.58% | 471 | 43.92% | 379 | 1.51% | 13 | 863 |
| Hunt | 74.91% | 21,011 | 23.78% | 6,671 | 1.31% | 367 | 28,049 |
| Hutchinson | 85.82% | 6,804 | 13.18% | 1,045 | 1.00% | 79 | 7,928 |
| Irion | 84.77% | 668 | 14.21% | 112 | 1.02% | 8 | 788 |
| Jack | 88.72% | 2,580 | 10.42% | 303 | 0.86% | 25 | 2,908 |
| Jackson | 77.73% | 3,906 | 21.29% | 1,070 | 0.98% | 49 | 5,025 |
| Jasper | 73.66% | 9,957 | 25.32% | 3,423 | 1.01% | 137 | 13,517 |
| Jeff Davis | 60.32% | 719 | 36.91% | 440 | 2.77% | 33 | 1,192 |
| Jefferson | 48.79% | 43,242 | 50.40% | 44,668 | 0.81% | 717 | 88,627 |
| Jim Hogg | 21.36% | 356 | 78.04% | 1,301 | 0.60% | 10 | 1,667 |
| Jim Wells | 41.18% | 4,598 | 58.14% | 6,492 | 0.68% | 76 | 11,166 |
| Johnson | 77.11% | 37,661 | 21.49% | 10,496 | 1.39% | 681 | 48,838 |
| Jones | 76.56% | 4,262 | 22.02% | 1,226 | 1.42% | 79 | 5,567 |
| Karnes | 67.50% | 2,825 | 31.66% | 1,325 | 0.84% | 35 | 4,185 |
| Kaufman | 71.66% | 24,846 | 27.32% | 9,472 | 1.02% | 352 | 34,670 |
| Kendall | 81.58% | 14,508 | 17.11% | 3,043 | 1.30% | 232 | 17,783 |
| Kenedy | 50.30% | 84 | 49.10% | 82 | 0.60% | 1 | 167 |
| Kent | 82.72% | 335 | 16.30% | 66 | 0.99% | 4 | 405 |
| Kerr | 78.95% | 17,274 | 19.83% | 4,338 | 1.22% | 267 | 21,879 |
| Kimble | 88.11% | 1,667 | 11.47% | 217 | 0.42% | 8 | 1,892 |
| King | 95.86% | 139 | 3.45% | 5 | 0.69% | 1 | 145 |
| Kinney | 61.75% | 880 | 36.63% | 522 | 1.61% | 23 | 1,425 |
| Kleberg | 45.56% | 4,058 | 53.37% | 4,754 | 1.07% | 95 | 8,907 |
| Knox | 76.82% | 1,160 | 21.99% | 332 | 1.19% | 18 | 1,510 |
| Lamar | 74.58% | 12,826 | 24.31% | 4,181 | 1.10% | 190 | 17,197 |
| Lamb | 74.75% | 3,058 | 24.40% | 998 | 0.86% | 35 | 4,091 |
| Lampasas | 78.03% | 5,621 | 20.53% | 1,479 | 1.44% | 104 | 7,204 |
| LaSalle | 40.64% | 669 | 58.63% | 965 | 0.73% | 12 | 1,646 |
| Lavaca | 81.94% | 6,796 | 17.22% | 1,428 | 0.84% | 70 | 8,294 |
| Lee | 72.45% | 4,507 | 26.23% | 1,632 | 1.32% | 82 | 6,221 |
| Leon | 83.71% | 5,814 | 15.29% | 1,062 | 0.99% | 69 | 6,945 |
| Liberty | 76.16% | 17,323 | 22.87% | 5,202 | 0.97% | 221 | 22,746 |
| Limestone | 69.92% | 5,288 | 29.19% | 2,208 | 0.89% | 67 | 7,563 |
| Lipscomb | 89.38% | 1,044 | 10.19% | 119 | 0.43% | 5 | 1,168 |
| Live Oak | 76.68% | 3,154 | 22.34% | 919 | 0.97% | 40 | 4,113 |
| Llano | 79.62% | 7,610 | 19.06% | 1,822 | 1.32% | 126 | 9,558 |
| Loving | 84.38% | 54 | 14.06% | 9 | 1.56% | 1 | 64 |
| Lubbock | 69.61% | 63,469 | 28.81% | 26,271 | 1.58% | 1,444 | 91,184 |
| Lynn | 73.46% | 1,439 | 25.83% | 506 | 0.71% | 14 | 1,959 |
| Madison | 75.17% | 3,028 | 24.01% | 967 | 0.82% | 33 | 4,028 |
| Marion | 63.83% | 2,733 | 34.91% | 1,495 | 1.26% | 54 | 4,282 |
| Martin | 84.24% | 1,368 | 15.27% | 248 | 0.49% | 8 | 1,624 |
| Mason | 79.52% | 1,565 | 19.31% | 380 | 1.17% | 23 | 1,968 |
| Matagorda | 66.27% | 8,040 | 32.80% | 3,980 | 0.93% | 113 | 12,133 |
| Maverick | 20.55% | 2,171 | 78.60% | 8,303 | 0.84% | 89 | 10,563 |
| McCulloch | 80.82% | 2,419 | 17.94% | 537 | 1.24% | 37 | 2,993 |
| Mclennan | 64.26% | 47,903 | 34.47% | 25,694 | 1.27% | 944 | 74,541 |
| McMullen | 85.69% | 431 | 13.32% | 67 | 0.99% | 5 | 503 |
| Medina | 69.03% | 11,079 | 29.81% | 4,784 | 1.16% | 186 | 16,049 |
| Menard | 78.33% | 665 | 20.14% | 171 | 1.53% | 13 | 849 |
| Midland | 80.03% | 35,689 | 18.58% | 8,286 | 1.39% | 622 | 44,597 |
| Milam | 66.60% | 5,481 | 32.03% | 2,636 | 1.37% | 113 | 8,230 |
| Mills | 85.51% | 1,882 | 12.68% | 279 | 1.82% | 40 | 2,201 |
| Mitchell | 75.82% | 1,756 | 23.23% | 538 | 0.95% | 22 | 2,316 |
| Montague | 84.49% | 6,549 | 14.40% | 1,116 | 1.11% | 86 | 7,751 |
| Montgomery | 79.70% | 137,969 | 19.02% | 32,920 | 1.28% | 2,224 | 173,113 |
| Moore | 79.60% | 3,968 | 19.34% | 964 | 1.06% | 53 | 4,985 |
| Morris | 62.89% | 3,232 | 36.15% | 1,858 | 0.95% | 49 | 5,139 |
| Motley | 89.67% | 538 | 9.17% | 55 | 1.17% | 7 | 600 |
| Nacogdoches | 67.42% | 13,925 | 31.30% | 6,465 | 1.27% | 263 | 20,653 |
| Navarro | 70.60% | 10,847 | 28.31% | 4,350 | 1.09% | 167 | 15,364 |
| Newton | 70.06% | 4,112 | 28.57% | 1,677 | 1.36% | 80 | 5,869 |
| Nolan | 71.74% | 3,282 | 26.58% | 1,216 | 1.68% | 77 | 4,575 |
| Nueces | 50.95% | 48,966 | 47.63% | 45,772 | 1.42% | 1,366 | 96,104 |
| Ochiltree | 90.85% | 2,719 | 8.45% | 253 | 0.70% | 21 | 2,993 |
| Oldham | 90.91% | 790 | 8.17% | 71 | 0.92% | 8 | 869 |
| Orange | 76.56% | 23,366 | 22.28% | 6,800 | 1.15% | 352 | 30,518 |
| Palo Pinto | 79.18% | 7,393 | 19.40% | 1,811 | 1.42% | 133 | 9,337 |
| Panola | 77.71% | 7,950 | 21.61% | 2,211 | 0.67% | 69 | 10,230 |
| Parker | 82.28% | 39,243 | 16.47% | 7,853 | 1.25% | 598 | 47,694 |
| Parmer | 78.74% | 2,011 | 20.71% | 529 | 0.55% | 14 | 2,554 |
| Pecos | 60.53% | 2,512 | 38.34% | 1,591 | 1.13% | 47 | 4,150 |
| Polk | 73.54% | 14,071 | 25.39% | 4,859 | 1.07% | 204 | 19,134 |
| Potter | 71.52% | 18,918 | 26.94% | 7,126 | 1.53% | 406 | 26,450 |
| Presidio | 27.74% | 504 | 70.56% | 1,282 | 1.71% | 31 | 1,817 |
| Rains | 80.23% | 3,279 | 18.62% | 761 | 1.15% | 47 | 4,087 |
| Randall | 83.40% | 41,447 | 15.24% | 7,574 | 1.36% | 675 | 49,696 |
| Reagan | 80.19% | 676 | 18.74% | 158 | 1.07% | 9 | 843 |
| Real | 80.52% | 1,236 | 18.05% | 277 | 1.43% | 22 | 1,535 |
| Red River | 69.94% | 3,549 | 29.21% | 1,482 | 0.85% | 43 | 5,074 |
| Reeves | 41.29% | 1,188 | 57.53% | 1,655 | 1.18% | 34 | 2,877 |
| Refugio | 62.12% | 1,663 | 37.28% | 998 | 0.60% | 16 | 2,677 |
| Roberts | 92.13% | 468 | 6.50% | 33 | 1.38% | 7 | 508 |
| Robertson | 60.64% | 4,419 | 38.40% | 2,798 | 0.96% | 70 | 7,287 |
| Rockwall | 75.99% | 27,113 | 22.76% | 8,120 | 1.25% | 445 | 35,678 |
| Runnels | 84.62% | 3,104 | 14.15% | 519 | 1.23% | 45 | 3,668 |
| Rusk | 75.08% | 13,924 | 24.00% | 4,451 | 0.92% | 171 | 18,546 |
| Sabine | 81.41% | 3,727 | 17.63% | 807 | 0.96% | 44 | 4,578 |
| San Augustine | 66.91% | 2,469 | 32.33% | 1,193 | 0.76% | 28 | 3,690 |
| San Jacinto | 73.91% | 7,107 | 25.06% | 2,410 | 1.03% | 99 | 9,616 |
| San Patricio | 59.79% | 12,005 | 39.13% | 7,856 | 1.08% | 217 | 20,078 |
| San Saba | 84.33% | 1,905 | 14.30% | 323 | 1.37% | 31 | 2,259 |
| Schleicher | 77.38% | 787 | 21.73% | 221 | 0.88% | 9 | 1,017 |
| Scurry | 82.04% | 4,124 | 16.67% | 838 | 1.29% | 65 | 5,027 |
| Shackelford | 89.36% | 1,218 | 9.61% | 131 | 1.03% | 14 | 1,363 |
| Shelby | 74.10% | 6,879 | 25.01% | 2,322 | 0.89% | 83 | 9,284 |
| Sherman | 87.48% | 908 | 11.66% | 121 | 0.87% | 9 | 1,038 |
| Smith | 72.02% | 57,331 | 26.95% | 21,456 | 1.02% | 814 | 79,601 |
| Somervell | 81.15% | 2,871 | 17.33% | 613 | 1.53% | 54 | 3,538 |
| Starr | 13.02% | 1,547 | 86.34% | 10,260 | 0.64% | 76 | 11,883 |
| Stephens | 84.76% | 2,892 | 13.92% | 475 | 1.32% | 45 | 3,412 |
| Sterling | 92.91% | 459 | 6.28% | 31 | 0.81% | 4 | 494 |
| Stonewall | 75.11% | 507 | 23.70% | 160 | 1.19% | 8 | 675 |
| Sutton | 74.55% | 1,110 | 24.78% | 369 | 0.67% | 10 | 1,489 |
| Swisher | 72.91% | 1,655 | 25.51% | 579 | 1.59% | 36 | 2,270 |
| Tarrant | 57.12% | 348,920 | 41.43% | 253,071 | 1.46% | 8,899 | 610,890 |
| Taylor | 76.06% | 32,904 | 22.54% | 9,750 | 1.41% | 609 | 43,263 |
| Terrell | 64.50% | 358 | 33.15% | 184 | 2.34% | 13 | 555 |
| Terry | 70.15% | 2,602 | 28.55% | 1,059 | 1.29% | 48 | 3,709 |
| Throckmorton | 86.10% | 700 | 13.41% | 109 | 0.49% | 4 | 813 |
| Titus | 68.71% | 6,084 | 29.91% | 2,648 | 1.38% | 122 | 8,854 |
| Tom Green | 73.20% | 26,878 | 25.31% | 9,294 | 1.49% | 548 | 36,720 |
| Travis | 36.21% | 140,152 | 60.14% | 232,788 | 3.65% | 14,117 | 387,057 |
| Trinity | 72.77% | 4,537 | 25.89% | 1,614 | 1.35% | 84 | 6,235 |
| Tyler | 77.21% | 5,910 | 21.79% | 1,668 | 0.99% | 76 | 7,654 |
| Upshur | 79.37% | 12,015 | 19.63% | 2,971 | 1.00% | 152 | 15,138 |
| Upton | 73.31% | 953 | 25.62% | 333 | 1.08% | 14 | 1,300 |
| Uvalde | 53.69% | 4,529 | 45.35% | 3,825 | 0.96% | 81 | 8,435 |
| Val Verde | 46.64% | 5,635 | 52.02% | 6,285 | 1.33% | 161 | 12,081 |
| Van Zandt | 82.69% | 15,794 | 16.15% | 3,084 | 1.16% | 222 | 19,100 |
| Victoria | 68.25% | 19,692 | 30.51% | 8,802 | 1.24% | 359 | 28,853 |
| Walker | 64.97% | 12,140 | 33.46% | 6,252 | 1.57% | 293 | 18,685 |
| Waller | 58.13% | 9,244 | 40.96% | 6,514 | 0.91% | 144 | 15,902 |
| Ward | 72.91% | 2,366 | 25.92% | 841 | 1.17% | 38 | 3,245 |
| Washington | 75.41% | 10,857 | 23.48% | 3,381 | 1.10% | 159 | 14,397 |
| Webb | 22.56% | 11,078 | 76.56% | 37,597 | 0.89% | 435 | 49,110 |
| Wharton | 69.21% | 9,750 | 30.06% | 4,235 | 0.72% | 102 | 14,087 |
| Wheeler | 88.25% | 1,878 | 10.90% | 232 | 0.85% | 18 | 2,128 |
| Wichita | 72.68% | 29,812 | 25.66% | 10,525 | 1.66% | 681 | 41,018 |
| Wilbarger | 74.27% | 2,956 | 24.40% | 971 | 1.33% | 53 | 3,980 |
| Willacy | 27.96% | 1,416 | 71.09% | 3,600 | 0.95% | 48 | 5,064 |
| Williamson | 59.41% | 97,006 | 37.90% | 61,875 | 2.69% | 4,390 | 163,271 |
| Wilson | 71.01% | 12,218 | 28.02% | 4,821 | 0.96% | 166 | 17,205 |
| Winkler | 76.00% | 1,311 | 23.07% | 398 | 0.93% | 16 | 1,725 |
| Wise | 82.95% | 17,207 | 15.53% | 3,221 | 1.53% | 317 | 20,745 |
| Wood | 81.63% | 14,351 | 17.38% | 3,056 | 0.99% | 174 | 17,581 |
| Yoakum | 79.79% | 1,698 | 19.22% | 409 | 0.99% | 21 | 2,128 |
| Young | 85.09% | 6,225 | 13.56% | 992 | 1.35% | 99 | 7,316 |
| Zapata | 28.14% | 997 | 71.32% | 2,527 | 0.54% | 19 | 3,543 |
| Zavala | 15.71% | 574 | 83.27% | 3,042 | 1.01% | 37 | 3,653 |
See also
References
- https://www.sos.state.tx.us/elections/historical/70-92.shtml
- "Texas". The New York Times. ISSN 0362-4331. Retrieved 2020-12-02.
- See Dave Leip's Atlas of U.S. Presidential Elections; 2012 Presidential Election Statistics (and earlier years)
- "Fortune 500 2011: States: Texas Companies - FORTUNE on CNNMoney.com". money.cnn.com. Retrieved 2020-12-02.
- Savicki, Drew (September 21, 2020). "The Road to 270: Texas". 270toWin. Retrieved December 2, 2020.
- "Texas Election Results 2016". The New York Times. 2017-08-01. ISSN 0362-4331. Retrieved 2020-12-02.
- "Texas Election Results". The New York Times. 2020-11-03. ISSN 0362-4331. Retrieved 2020-12-02.
- "2012 Democratic Party Primary Election, Texas Secretary of State". Retrieved November 17, 2016.
- Fernandez, Manny (March 2, 2012). "Texas: Primary Election Set for May 29". New York Times. Retrieved March 12, 2012.
- Perez, et al. v. Texas, no. 11-CV-360 (March 1, 2012 W.D. Texas), order, page 8
- Weber, Paul J. (February 15, 2012). "Unsettled Texas primary may slip into May or later". Boston Globe. Associated Press. Retrieved February 22, 2012.
- "Primary and Caucus Printable Calendar". CNN. Retrieved January 12, 2012.
- "Presidential Primary Dates" (PDF). Federal Election Commission. Retrieved January 23, 2012.
- "Judge in Texas redistricting case tells Republican state officials to plan for May 29 primary". Washington Post. Associated Press. February 15, 2012. Retrieved February 22, 2012.
- "2012 Republican Party Primary Election, Texas Secretary of State". Retrieved November 17, 2016.
- "2012 General Election, Texas Secretary of State". Retrieved November 17, 2016.
Notes
External links
- The Green Papers for Texas
- The Green Papers major state elections in chronological order