2012 United States presidential election in Washington (state)
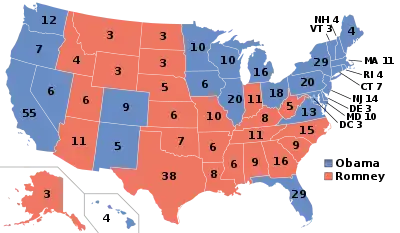
The 2012 United States presidential election in Washington took place on November 6, 2012, as part of the 2012 United States presidential election in which all 50 states plus the District of Columbia participated. Washington voters chose 12 electors to represent them in the Electoral College via a popular vote pitting incumbent Democratic President Barack Obama and his running mate, Vice President Joe Biden, against Republican challenger and former Massachusetts Governor Mitt Romney and his running mate, Congressman Paul Ryan.
| ||||||||||||||||||||||||||
| Turnout | 81.25% (of registered voters)
| |||||||||||||||||||||||||
|---|---|---|---|---|---|---|---|---|---|---|---|---|---|---|---|---|---|---|---|---|---|---|---|---|---|---|
| ||||||||||||||||||||||||||
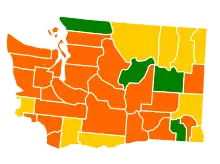
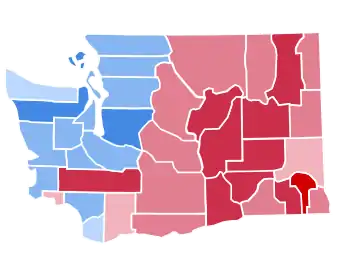 County Results
| ||||||||||||||||||||||||||
| ||||||||||||||||||||||||||
| Elections in Washington |
|---|
 |
2012 U.S. presidential election | |
|---|---|
| Democratic Party | |
| Republican Party | |
| Related races | |
| |
President Obama easily won the state of Washington, taking 56.16% of the vote to Mitt Romney's 41.29%, a 14.87% margin of victory.[2] In terms of raw vote total, Obama received 1,755,396 votes to Romney's 1,290,670 votes, a 464,726 vote margin. Obama received the largest number of votes of any candidate up to that point, a record which would be broken by his then-running mate Joe Biden in 2020, when Biden broke Obama's record by 614,216 votes.[3] Third parties collectively made up 79,450 votes, or 2.54%. Obama led in every single poll conducted, often by double digits. Washington has not voted for a Republican since Ronald Reagan carried it in his 1984 landslide, and today is considered part of the Blue Wall, a bloc of 242 electoral votes that have safely voted for the Democratic nominee since 1992. Despite being a Republican-leaning swing state in the early- to mid-20th century, the rise of cultural conservatism and resistance to social liberalism in the Republican Party pushed voters in Washington, as well as many other Blue Wall states, away from the Republicans.[4]
As with all other Pacific states, Washington politics are dominated by its progressive metropolitan areas. Washington itself is one of the most progressive states in the country, most notably on women's issues: it was one of the first states to loosen abortion restrictions[4] and is the United States' 7th most secular state.[5] Economically, while Washington was historically a socially liberal and economically conservative state, it has become more dominated by leftism in the past few years at the presidential, congressional, and local level.[4][6] Thus, an Obama win was near guaranteed. He dominated the Seattle–Tacoma metropolitan area, winning 69.07% of the vote (a 40.56% margin) in King County, the largest in the state and home to Seattle. King County alone casts 29% of the state's ballots, and the Seattle metropolitan area (as defined by the United States Census Bureau) comprised 69.66% of the state's population in 2012.[7][8] This area of the Evergreen State also has the highest minority composition with a 15% Asian, 9% Hispanic, and 7% African American population, and is dominated by diverse, well-educated voters. The Seattle LGBT community is one of the largest in the country.[4] Thurston County, the 6th largest county in the state and home to the state capital of Olympia, gave Obama 58.27% of the vote, a 19.48% margin. The Democratic ticket also won by great margins in the counties of (in decreasing order of margin) Snohomish (Everett), Whatcom (Bellingham), Kitsap (Bremerton), and Pierce (Tacoma). Clark County, home to Vancouver, in the southwest of the state, was won by the president with a 431-vote margin. Overall, Western Washington voted 7.7% more Democratic than the state overall.[6]
Meanwhile, Romney's best performance was in the east of the state, which is mostly rural and sparse and has an economy dominated by agriculture. Washington's geographic divide resembles that of California and Oregon: voters east of the Cascade Mountains are the most conservative in the Evergreen State, and Eastern Washington voted 28.5% more Republican than the state as a whole.[6] While comprising most of the counties in the state, this area casts only one-fifth of the ballots. Though many of these counties the Republicans won with over 60% of the vote, these victories were not able to offset Obama's landslide margins in the Seattle–Tacoma metro. Romney's biggest prize was Spokane County, which gave him over 115,000 votes and a 5.81% margin of victory. He also won Yakima County. However, he was able to flip four counties that Obama won in 2008: Klickitat, Skamania, Wahkhiakum, and Whitman.
This election continued Clallam County's bellwether streak, marking the 9th election since 1980 that it voted for the winner of the nationwide election. Clallam's streak would eventually become the longest of any county in 2020.[9]
Washington weighed in as 11.01% more Democratic than the national average in 2012.
As of 2020, this is the last presidential election in which the Republican nominee won Whitman County and the Democratic nominee won Cowlitz, Grays Harbor, Mason, and Pacific Counties.
Democratic caucuses
As incumbent President Barack Obama ran without opposition nationwide, the non-binding primary was cancelled by the Washington State Legislature. Precinct caucuses took place on April 15, legislative district caucuses on April 28, county conventions on April 29, and congressional district caucuses on May 30. The Washington state convection took place from June 1 to June 3, and according to The Green Papers, Obama ran unopposed in the caucuses, receiving 114 delegates in the Democratic National Convention floor vote. The other 6 delegates' votes were unannounced.[10]
Republican caucuses
The Republican caucuses were held on March 3, 2012.[11] The additional preferential primary, as held since 1992, was canceled this year for budgetary reasons, as was the one in 2004.[12] Caucus participants, however, did not allocate national delegates to the candidates – they only elected delegates to the county conventions and took part in a nonbinding straw poll. Only the state convention from May 31 to June 2, 2012 legally pledged delegates to the national convention to specific candidates.
Caucus results
With 3,677,919 registered voters as of February 29,[13] the turnout was 1.4%.[14] Former Massachusetts Governor Mitt Romney won the caucuses with a plurality, receiving 19,111 votes or 37.65%. Ron Paul, representative from Texas's 14th district, narrowly won second place with 24.81% of the vote against former Senator from Pennsylvania Rick Santorum's 23.81%. Former Speaker of the House Newt Gingrich placed fourth, with 5,221 votes, or 10.28%. The other 3.44% of votes were uncommitted or write-ins.
| Washington state Republican caucuses nonbinding strawpoll | |||
|---|---|---|---|
| Candidate | Votes | Percentage | |
| Mitt Romney | 19,111 | 37.65% | |
| Ron Paul | 12,594 | 24.81% | |
| Rick Santorum | 12,089 | 23.81% | |
| Newt Gingrich | 5,221 | 10.28% | |
| Uncommitted | 1,656 | 3.26% | |
| Total Write-Ins | 93 | 0.18% | |
| Totals | 50,764 | 100.00% | |
Convention results
At the Republican National Convention, Romney received all 3 delegates from the 1st, 2nd, 4th, 5th, 6th, 8th, 9th, and 10th districts. Ron Paul received 2 delegates from the 3rd district and all 3 from the 7th. The 3rd district also allocated 1 delegate to Rick Santorum. All 10 state delegates were allocated to Romney, as were the 3 superdelegates.
| Convention Results[15][16][17] | |||||||||||||
|---|---|---|---|---|---|---|---|---|---|---|---|---|---|
| Candidate | 1st | 2nd | 3rd | 4th | 5th | 6th | 7th | 8th | 9th | 10th | State | Party leaders |
Total |
| Mitt Romney | 3 | 3 | 0 | 3 | 3 | 3 | 0 | 3 | 3 | 3 | 10 | 3 | 37 |
| Ron Paul | 0 | 0 | 2 | 0 | 0 | 0 | 3 | 0 | 0 | 0 | 0 | 0 | 5 |
| Rick Santorum | 0 | 0 | 1 | 0 | 0 | 0 | 0 | 0 | 0 | 0 | 0 | 0 | 1 |
| Total | 30 | 10 | 3 | 43 | |||||||||
General election
Polling
President Obama consistently led in polling up until election day: at one point, a SurveyUSA poll conducted from September 28 to 30 had him leading by 20 points. In only two polls did Obama lead by single digits: a Public Policy Polling poll conducted October 15 to 16 had him leading by 5 points, and another conducted November 1 to 3 had him up 7. An average of all polls conducted before election day had Obama leading by 13.6 percentage points.
| Poll source | Date administered | Democrat | % | Republican | % | Lead margin | Sample Size | Margin of error |
|---|---|---|---|---|---|---|---|---|
| YouGov | October 31 – November 3, 2012 | Barack Obama | 54% | Mitt Romney | 40% | 14 | 837 LV | ±--% |
| Public Policy Polling | November 1 – 3, 2012 | Barack Obama | 53% | Mitt Romney | 46% | 7 | 932 LV | ±3.2% |
| Survey USA | October 28 – 31, 2012 | Barack Obama | 54% | Mitt Romney | 40% | 14 | 555 LV | ±4.2% |
| University of Washington | October 18 – 31, 2012 | Barack Obama | 57% | Mitt Romney | 36% | 21 | 632 LV | ±3.9% |
| Strategies 360 | October 17 – 20, 2012 | Barack Obama | 52% | Mitt Romney | 39% | 13 | 500 LV | ±4.4% |
| Public Policy Polling | October 15 – 16, 2012 | Barack Obama | 50% | Mitt Romney | 45% | 5 | 574 LV | ±--% |
| The Washington Poll | October 1–16, 2012 | Barack Obama | 52% | Mitt Romney | 41% | 11 | 782 LV | ±3.5% |
| Rasmussen Reports | October 14, 2012 | Barack Obama | 55% | Mitt Romney | 42% | 13 | 500 LV | ±4.5% |
| SurveyUSA | October 12 – 14, 2012 | Barack Obama | 54% | Mitt Romney | 40% | 14 | 543 LV | ±4.3% |
| SurveyUSA | September 28 – 30, 2012 | Barack Obama | 56% | Mitt Romney | 36% | 20 | 540 LV | ±4.3% |
| Rasmussen Reports | September 26, 2012 | Barack Obama | 52% | Mitt Romney | 41% | 11 | 500 LV | ±4.5% |
| Gravis Marketing | September 21–22, 2012 | Barack Obama | 56% | Mitt Romney | 39% | 17 | 625 RV | ±4.6% |
| Elway | September 9–12, 2012 | Barack Obama | 53% | Mitt Romney | 36% | 17 | 405 RV | ±5.0% |
| Public Policy Polling | September 7–9, 2012 | Barack Obama | 53% | Mitt Romney | 42% | 11 | 563 | ±n/a% |
| KING5NEWS/SurveyUSA | September 7–9, 2012 | Barack Obama | 54% | Mitt Romney | 38% | 16 | 700 | ±4.4% |
Candidate ballot access
- Barack Hussein Obama / Joseph Robinette Biden, Jr., Democratic
- Willard Mitt Romney / Paul Davis Ryan, Republican
- Gary Earl Johnson / James Polin Gray, Libertarian
- Virgil Hamlin Good, Jr. / James N. Clymer, Constitution
- Jill Ellen Stein / Cheri Lynn Honkala, Green
- Peta Lindsay / Yari Osorio, Socialism and Liberation
- James Harris / Alyson Kennedy, Socialist Workers
- Ross Carl "Rocky" Anderson / Luis Javier Rodriguez, Justice
Results
| 2012 United States presidential election in Washington (state)[2] | ||||||
|---|---|---|---|---|---|---|
| Party | Candidate | Running mate | Votes | Percentage | Electoral votes | |
| Democratic | Barack Obama | Joe Biden | 1,755,396 | 56.16% | 12 | |
| Republican | Mitt Romney | Paul Ryan | 1,290,670 | 41.29% | 0 | |
| Libertarian | Gary Johnson | Jim Gray | 42,202 | 1.35% | 0 | |
| Green | Jill Stein | Cheri Honkala | 20,928 | 0.67% | 0 | |
| Constitution | Virgil Goode | Jim Clymer | 8,851 | 0.28% | 0 | |
| Justice | Rocky Anderson | Luis J. Rodriguez | 4,946 | 0.16% | 0 | |
| Socialism and Liberation | Peta Lindsay | Yari Osorio | 1,318 | 0.04% | 0 | |
| Socialist Workers | James Harris | Alyson Kennedy | 1,205 | 0.04% | 0 | |
| Totals | 3,125,516 | 100.00% | 12 | |||
Results by county
| County | Barack Hussein Obama Democratic |
Willard Mitt Romney Republican |
Gary Earl Johnson Libertarian |
Jill Ellen Stein Green |
Virgil Hamlin Good, Jr. Constitution |
Ross Carl Anderson Justice |
Peta Lindsay Socialism and Liberation |
James Harris Socialist Workers |
Margin | Total | |||||||||
|---|---|---|---|---|---|---|---|---|---|---|---|---|---|---|---|---|---|---|---|
| Votes | % | Votes | % | Votes | % | Votes | % | Votes | % | Votes | % | Votes | % | Votes | % | Votes | % | ||
| Adams | 1,540 | 32.13% | 3,171 | 66.16% | 40 | 0.83% | 20 | 0.42% | 15 | 0.31% | 6 | 0.13% | 1 | 0.02% | 0 | 0.00% | 1,631 | 34.03% | 4,793 |
| Asotin | 4,003 | 40.43% | 5,654 | 57.11% | 151 | 1.53% | 34 | 0.34% | 31 | 0.31% | 21 | 0.21% | 3 | 0.03% | 4 | 0.04% | 1,651 | 16.68% | 9,901 |
| Benton | 28,145 | 35.38% | 49,461 | 62.17% | 1,148 | 1.44% | 360 | 0.45% | 303 | 0.38% | 105 | 0.13% | 19 | 0.02% | 18 | 0.02% | 21,316 | 26.79% | 79,559 |
| Chelan | 13,112 | 40.66% | 18,402 | 57.06% | 426 | 1.32% | 154 | 0.48% | 91 | 0.28% | 36 | 0.11% | 9 | 0.03% | 20 | 0.06% | 5,290 | 16.40% | 32,250 |
| Clallam | 18,580 | 48.81% | 18,437 | 48.43% | 522 | 1.37% | 293 | 0.77% | 135 | 0.35% | 52 | 0.14% | 26 | 0.07% | 21 | 0.06% | 143 | 0.38% | 38,066 |
| Clark | 93,382 | 48.94% | 92,951 | 48.72% | 2,523 | 1.32% | 984 | 0.52% | 591 | 0.31% | 255 | 0.13% | 58 | 0.03% | 61 | 0.03% | 431 | 0.22% | 190,805 |
| Columbia | 645 | 28.55% | 1,568 | 69.41% | 26 | 1.15% | 7 | 0.31% | 6 | 0.27% | 5 | 0.22% | 0 | 0.00% | 2 | 0.09% | 923 | 40.86% | 2,259 |
| Cowlitz | 22,726 | 50.93% | 20,746 | 46.49% | 553 | 1.24% | 261 | 0.58% | 221 | 0.50% | 72 | 0.16% | 15 | 0.03% | 26 | 0.06% | 1,980 | 4.44% | 44,620 |
| Douglas | 5,166 | 34.57% | 9,425 | 63.08% | 204 | 1.37% | 53 | 0.35% | 60 | 0.40% | 20 | 0.13% | 8 | 0.05% | 6 | 0.04% | 4,259 | 28.51% | 14,942 |
| Ferry | 1,294 | 37.62% | 1,995 | 57.99% | 73 | 2.12% | 30 | 0.87% | 31 | 0.90% | 13 | 0.38% | 2 | 0.06% | 2 | 0.06% | 701 | 20.37% | 3,440 |
| Franklin | 8,398 | 37.09% | 13,748 | 60.72% | 293 | 1.29% | 74 | 0.33% | 83 | 0.37% | 33 | 0.15% | 10 | 0.04% | 4 | 0.02% | 5,350 | 23.63% | 22,643 |
| Garfield | 336 | 26.29% | 913 | 71.44% | 16 | 1.25% | 4 | 0.31% | 2 | 0.16% | 3 | 0.23% | 1 | 0.08% | 3 | 0.23% | 577 | 45.15% | 1,278 |
| Grant | 8,950 | 32.48% | 17,852 | 64.78% | 427 | 1.55% | 125 | 0.45% | 135 | 0.49% | 33 | 0.12% | 19 | 0.07% | 17 | 0.06% | 8,902 | 32.30% | 27,558 |
| Grays Harbor | 15,960 | 55.64% | 11,914 | 41.54% | 425 | 1.48% | 159 | 0.55% | 150 | 0.52% | 47 | 0.16% | 12 | 0.04% | 17 | 0.06% | 4,046 | 14.10% | 28,684 |
| Island | 21,478 | 51.02% | 19,605 | 46.57% | 531 | 1.26% | 265 | 0.63% | 116 | 0.28% | 71 | 0.17% | 22 | 0.05% | 11 | 0.03% | 1,873 | 4.45% | 42,099 |
| Jefferson | 12,739 | 64.24% | 6,405 | 32.30% | 248 | 1.25% | 301 | 1.52% | 54 | 0.27% | 67 | 0.34% | 8 | 0.04% | 7 | 0.04% | 6,334 | 31.94% | 19,829 |
| King | 668,004 | 69.07% | 275,700 | 28.51% | 12,411 | 1.28% | 7,264 | 0.75% | 1,369 | 0.14% | 1,628 | 0.17% | 411 | 0.04% | 367 | 0.04% | 392,304 | 40.56% | 967,154 |
| Kitsap | 67,277 | 54.53% | 52,846 | 42.84% | 1,774 | 1.44% | 799 | 0.65% | 414 | 0.34% | 177 | 0.14% | 37 | 0.03% | 43 | 0.03% | 14,431 | 11.69% | 123,367 |
| Kittitas | 7,949 | 43.75% | 9,782 | 53.83% | 239 | 1.32% | 110 | 0.61% | 39 | 0.21% | 37 | 0.20% | 5 | 0.03% | 10 | 0.06% | 1,833 | 10.08% | 18,171 |
| Klickitat | 4,598 | 44.75% | 5,316 | 51.74% | 147 | 1.43% | 121 | 1.18% | 53 | 0.52% | 27 | 0.26% | 5 | 0.05% | 7 | 0.07% | 718 | 6.99% | 10,274 |
| Lewis | 12,664 | 37.20% | 20,452 | 60.08% | 508 | 1.49% | 172 | 0.51% | 149 | 0.44% | 56 | 0.16% | 18 | 0.05% | 25 | 0.07% | 7,788 | 22.88% | 34,044 |
| Lincoln | 1,673 | 28.49% | 4,063 | 69.19% | 66 | 1.12% | 36 | 0.61% | 24 | 0.41% | 6 | 0.10% | 1 | 0.02% | 3 | 0.05% | 2,390 | 40.70% | 5,872 |
| Mason | 14,764 | 52.29% | 12,761 | 45.20% | 357 | 1.26% | 175 | 0.62% | 104 | 0.37% | 48 | 0.17% | 17 | 0.06% | 9 | 0.03% | 2,003 | 7.09% | 28,235 |
| Okanogan | 7,108 | 42.19% | 9,221 | 54.74% | 237 | 1.41% | 142 | 0.84% | 86 | 0.51% | 34 | 0.20% | 10 | 0.06% | 8 | 0.05% | 2,113 | 12.55% | 16,846 |
| Pacific | 5,711 | 54.27% | 4,499 | 42.75% | 152 | 1.44% | 70 | 0.67% | 49 | 0.47% | 26 | 0.25% | 6 | 0.06% | 11 | 0.10% | 1,212 | 11.52% | 10,524 |
| Pend Oreille | 2,508 | 37.61% | 3,952 | 59.27% | 103 | 1.54% | 42 | 0.63% | 40 | 0.60% | 14 | 0.21% | 4 | 0.06% | 5 | 0.07% | 1,444 | 21.66% | 6,668 |
| Pierce | 186,430 | 54.37% | 148,467 | 43.30% | 4,584 | 1.34% | 1,777 | 0.52% | 1,010 | 0.29% | 394 | 0.11% | 135 | 0.04% | 113 | 0.03% | 37,963 | 11.07% | 342,910 |
| San Juan | 7,125 | 67.26% | 3,111 | 29.37% | 140 | 1.32% | 175 | 1.65% | 8 | 0.08% | 26 | 0.25% | 7 | 0.07% | 2 | 0.02% | 4,014 | 37.89% | 10,594 |
| Skagit | 28,688 | 51.91% | 25,071 | 45.36% | 785 | 1.42% | 431 | 0.78% | 165 | 0.30% | 92 | 0.17% | 21 | 0.04% | 16 | 0.03% | 3,617 | 6.55% | 55,269 |
| Skamania | 2,628 | 48.08% | 2,687 | 49.16% | 84 | 1.54% | 40 | 0.73% | 13 | 0.24% | 9 | 0.16% | 4 | 0.07% | 1 | 0.02% | 59 | 1.08% | 5,466 |
| Snohomish | 188,516 | 56.16% | 133,016 | 40.33% | 4,788 | 1.45% | 1,753 | 0.53% | 1,002 | 0.30% | 490 | 0.15% | 129 | 0.04% | 123 | 0.04% | 55,500 | 15.83% | 329,817 |
| Spokane | 102,295 | 45.70% | 115,285 | 51.51% | 3,257 | 1.46% | 1,361 | 0.61% | 1,086 | 0.49% | 344 | 0.15% | 118 | 0.05% | 84 | 0.04% | 12,990 | 5.81% | 223,830 |
| Stevens | 7,762 | 35.03% | 13,691 | 61.78% | 329 | 1.48% | 130 | 0.59% | 194 | 0.88% | 31 | 0.14% | 11 | 0.05% | 13 | 0.06% | 5,929 | 26.75% | 22,161 |
| Thurston | 74,037 | 58.27% | 49,287 | 38.79% | 1,737 | 1.37% | 1,333 | 1.05% | 304 | 0.24% | 262 | 0.21% | 59 | 0.05% | 44 | 0.03% | 24,750 | 19.48% | 127,063 |
| Wahkiakum | 1,094 | 47.69% | 1,119 | 48.78% | 34 | 1.48% | 23 | 1.00% | 11 | 0.48% | 10 | 0.44% | 1 | 0.04% | 2 | 0.09% | 25 | 1.09% | 2,294 |
| Walla Walla | 9,768 | 38.90% | 14,648 | 58.34% | 398 | 1.59% | 154 | 0.61% | 71 | 0.28% | 45 | 0.18% | 12 | 0.05% | 12 | 0.05% | 4,880 | 19.44% | 25,108 |
| Whatcom | 57,089 | 55.41% | 42,703 | 41.45% | 1,383 | 1.34% | 1,248 | 1.21% | 287 | 0.28% | 219 | 0.21% | 57 | 0.06% | 43 | 0.04% | 14,386 | 13.96% | 103,029 |
| Whitman | 8,037 | 46.94% | 8,507 | 49.69% | 334 | 1.95% | 118 | 0.69% | 64 | 0.37% | 37 | 0.22% | 9 | 0.05% | 15 | 0.09% | 470 | 2.75% | 17,121 |
| Yakima | 33,217 | 43.15% | 42,239 | 54.88% | 749 | 0.97% | 330 | 0.43% | 285 | 0.37% | 95 | 0.12% | 28 | 0.04% | 30 | 0.04% | 9,022 | 11.73% | 76,973 |
| Totals | 1,755,396 | 56.16% | 1,290,670 | 41.29% | 42,202 | 1.35% | 20,928 | 0.67% | 8,851 | 0.28% | 4,946 | 0.16% | 1,318 | 0.04% | 1,205 | 0.04% | 464,726 | 14.87% | 3,125,516 |
Counties that flipped from Democratic to Republican
- Klickitat (largest city: Goldendale)
- Skamania (largest community: Carson)
- Wahkhiakum (largest community: Puget Island)
- Whitman (largest city: Pulman)
Results by congressional district
President Obama won 7 of 10 congressional districts, including the 9th district, which simultaneously elected a Republican (Dave Reichert) to the House of Representatives.[18] Obama's best performance was in the 7th district, which encompasses most of Seattle and Burien, where he received 79.2% of the vote to Romney's 18.1%. Romney won the 3rd district, located in Southwestern Washington, by a 1.7% margin, as well as the 4th and 5th districts, both of which are located in the rural and conservative parts of Washington east of the Cascade Mountains.
| District | Barack Obama | Mitt Romney | Other[lower-alpha 1] | Representative |
|---|---|---|---|---|
| 1st | 54.1% | 43.3% | 2.6% | Jay Inslee (111th Congress) |
| Suzan DelBene (112th Congress) | ||||
| 2nd | 59.2% | 38.0% | 2.8% | Rick Larsen |
| 3rd | 47.9% | 49.6% | 2.5% | Jaime Herrera Beutler |
| 4th | 37.9% | 59.7% | 2.4% | Doc Hastings |
| 5th | 43.7% | 53.5% | 2.8% | Cathy McMorris Rodgers |
| 6th | 56.1% | 41.2% | 2.7% | Norm Dicks (111th Congress) |
| Derek Kilmer (112th Congress) | ||||
| 7th | 79.2% | 18.1% | 2.7% | Jim McDermott |
| 8th | 49.7% | 48.1% | 2.2% | Dave Reichert |
| 9th | 68.3% | 29.6% | 2.1% | Adam Smith |
| 10th | 56.3% | 41.1% | 2.6% | district created |
| Denny Heck |
See also
- 2012 Democratic Party presidential primaries
- 2012 Republican Party presidential primaries
- Results of the 2012 Republican Party presidential primaries
- 2012 Republican Party presidential debates and forums
- 2012 United States House of Representatives elections in Washington
- 2012 United States Senate election in Washington
- 2012 Washington gubernatorial election
Notes
- calculated by subtracting Obama and Romney's percentages from 100
References
- Secretary of State: Kim Wyman. "November 6, 2012 General Election Results". www.sos.wa.gov. Retrieved 2020-05-25.
- "November 06, 2012 General Election Results: President/Vice President". www.wa.gov. Washington Secretary of State. Retrieved December 5, 2020.
- "November 3, 2020 General Election Results - President/Vice President". www.wa.gov. Washington Secretary of State. Retrieved December 5, 2020.
- Cohen, Micah (September 25, 2012). "Washington State, Women's Rights and Big Cities". FiveThirtyEight. Retrieved December 5, 2020.
- Lipka, Michael; Wormald, Benjamin (February 29, 2016). "Most and least religious U.S. states". Pew Research Center. Retrieved December 5, 2020.
- Savicki, Drew (June 1, 2020). "The Road to 270: Washington". 270toWin. Retrieved December 5, 2020.
- "State Population Totals: 2010-2019". The United States Census Bureau. Retrieved December 5, 2020.
- "County Population Totals: 2010-2019". The United States Census Bureau. Retrieved December 5, 2020.
- Farley, Josh (November 7, 2020). "What does Clallam County know? Voters just chose a winner for the tenth straight election". Kitsap Sun. Retrieved December 5, 2020.
- "Washington Democratic Delegation 2012". The Green Papers. Retrieved December 5, 2020.
- Grygiel, Chris (September 27, 2011). "Washington state GOP to hold presidential caucus March 3". Seattle Post-Intelligencer. Hearst Corporation. ISSN 0745-970X. OCLC 3734418. Retrieved January 10, 2011.
- "GOP candidates vie for delegates in Washington, feet planted in Ohio". Fox News. March 3, 2012. Retrieved March 3, 2012.
- "Elections & Voting". Washington Secretary of State - Elections Division. Retrieved March 4, 2012.
- Washington Republican - The Green Papers
- "Archived copy". Archived from the original on 2012-06-10. Retrieved 2012-07-19.CS1 maint: archived copy as title (link)
- "Washington Republican Delegation 2012".
- https://twitter.com/FHQ/status/209025914649067520
- Nir, David (November 19, 2020). "Daily Kos Elections' presidential results by congressional district for 2020, 2016, and 2012". Daily Kos. Retrieved December 5, 2020.
External links
- The Green Papers: for Washington
- The Green Papers: Major state elections in chronological order