2012 United States presidential election in Mississippi
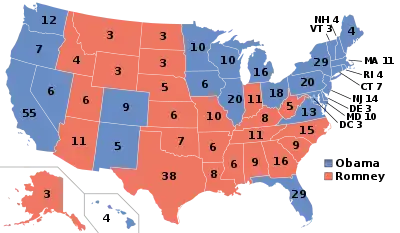
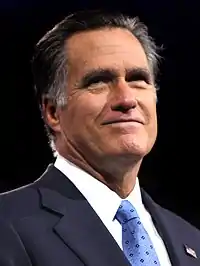
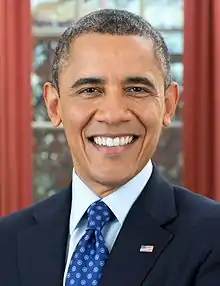
The 2012 United States presidential election in Mississippi took place on November 6, 2012, as part of the 2012 General Election in which all 50 states plus the District of Columbia participated. Mississippi voters chose six electors to represent them in the Electoral College via a popular vote pitting incumbent Democratic President Barack Obama and his running mate, Vice President Joe Biden, against Republican challenger and former Massachusetts Governor Mitt Romney and his running mate, Congressman Paul Ryan.
| ||||||||||||||||||||||||||
| ||||||||||||||||||||||||||
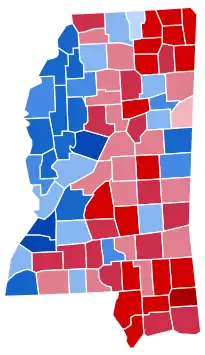 County Results
| ||||||||||||||||||||||||||
| ||||||||||||||||||||||||||
Romney and Ryan won Mississippi with 55.29% of the popular vote to Obama's and Biden's 43.79%, thus winning the state's six electoral votes by an 11.50% margin.[1] Mississippi was one of just six states where Obama improved on his 2008 performance. According to exit polls, the black vote share in Mississippi increased from 33% in 2008 to 36% in 2012, likely explaining Obama's gains.[2] This was the strongest showing for a Democratic presidential candidate in Mississippi since native Southerner Bill Clinton's 44.08% in 1996. Obama carried Warren County, becoming the first Democrat to do so since John F. Kennedy in 1960.[3] He also managed to flip Benton County, and already Democratic counties improved their margins further.
Democratic primary
Obama ran unopposed in the Mississippi primary and therefore received 100% of the vote.[4]
Republican primary
| |||||||||||||||||||||||||
| |||||||||||||||||||||||||
 Mississippi results by county
Rick Santorum
Newt Gingrich
Mitt Romney
Tie | |||||||||||||||||||||||||
.jpg.webp)
| Elections in Mississippi |
|---|
.svg.png.webp) |
2012 U.S. presidential election | |
|---|---|
| Democratic Party | |
| Republican Party | |
| Related races | |
| |
The Republican primary took place on March 13, 2012, the same day as the Alabama Republican primary and the Hawaii Republican caucuses.[5][6] After the open election, 37 bound delegates and three unbound delegates will go to the Republican National Convention.[7]
| Mississippi Republican primary, 2012[8][9] | |||
|---|---|---|---|
| Candidate | Votes | Percentage | Delegates |
| 96,258 | 32.73% | 13 | |
| Newt Gingrich | 91,612 | 31.15% | 12 |
| Mitt Romney | 90,161 | 30.66% | 14 |
| Ron Paul | 12,955 | 4.40% | 0 |
| Rick Perry | 1,350 | 0.46% | 0 |
| Michele Bachmann | 971 | 0.33% | 0 |
| Jon Huntsman, Jr. | 413 | 0.14% | 0 |
| Gary Johnson | 392 | 0.13% | 0 |
| Unprojected delegates: | 3 | ||
| Total: | 294,112 | 100% | 40 |
General election
Results
| 2012 United States presidential election in Mississippi | ||||||
|---|---|---|---|---|---|---|
| Party | Candidate | Running mate | Votes | Percentage | Electoral votes | |
| Republican | Mitt Romney | Paul Ryan | 710,746 | 55.29% | 6 | |
| Democratic | Barack Obama | Joe Biden | 562,949 | 43.79% | 0 | |
| Libertarian | Gary Johnson | Jim Gray | 6,676 | 0.52% | 0 | |
| Constitution | Virgil Goode | Jim Clymer | 2,609 | 0.20% | 0 | |
| Green | Jill Stein | Cheri Honkala | 1,588 | 0.12% | 0 | |
| Reform | Barbara Dale Washer | Cathy L. Toole | 1,016 | 0.08% | 0 | |
| Totals | 1,285,584 | 100.00% | 6 | |||
By county
| County | Obama% | Obama# | Romney% | Romney# | Others% | Others# | Total |
|---|---|---|---|---|---|---|---|
| Adams | 58.66% | 9,061 | 40.74% | 6,293 | 0.60% | 93 | 15,447 |
| Alcorn | 23.67% | 3,511 | 74.92% | 11,111 | 1.40% | 208 | 14,830 |
| Amite | 42.07% | 3,242 | 57.28% | 4,414 | 0.65% | 50 | 7,706 |
| Attala | 43.19% | 3,927 | 56.38% | 5,126 | 0.43% | 39 | 9,092 |
| Benton | 49.83% | 2,051 | 49.59% | 2,041 | 0.58% | 24 | 4,116 |
| Bolivar | 68.59% | 10,582 | 30.47% | 4,701 | 0.94% | 145 | 15,428 |
| Calhoun | 36.59% | 2,586 | 62.42% | 4,412 | 0.99% | 70 | 7,068 |
| Carroll | 33.49% | 2,007 | 66.09% | 3,960 | 0.42% | 25 | 5,992 |
| Chickasaw | 51.49% | 4,378 | 46.97% | 3,994 | 1.54% | 131 | 8,503 |
| Choctaw | 33.42% | 1,428 | 65.81% | 2,812 | 0.77% | 33 | 4,273 |
| Claiborne | 88.22% | 4,838 | 11.40% | 625 | 0.38% | 21 | 5,484 |
| Clarke | 37.70% | 3,111 | 61.18% | 5,049 | 1.13% | 93 | 8,253 |
| Clay | 60.62% | 6,712 | 38.76% | 4,291 | 0.62% | 69 | 11,072 |
| Coahoma | 73.86% | 7,792 | 25.71% | 2,712 | 0.43% | 45 | 10,549 |
| Copiah | 54.87% | 7,749 | 44.48% | 6,282 | 0.65% | 92 | 14,123 |
| Covington | 41.48% | 3,878 | 57.82% | 5,405 | 0.70% | 65 | 9,348 |
| DeSoto | 32.79% | 21,575 | 66.21% | 43,559 | 1.00% | 660 | 65,794 |
| Forrest | 43.89% | 13,272 | 54.82% | 16,574 | 1.29% | 390 | 30,236 |
| Franklin | 38.42% | 1,726 | 60.87% | 2,735 | 0.71% | 32 | 4,493 |
| George | 13.79% | 1,359 | 84.98% | 8,376 | 1.23% | 121 | 9,856 |
| Greene | 22.37% | 1,325 | 76.51% | 4,531 | 1.11% | 66 | 5,922 |
| Grenada | 46.65% | 5,288 | 52.81% | 5,986 | 0.54% | 61 | 11,335 |
| Hancock | 22.82% | 3,917 | 75.52% | 12,964 | 1.67% | 286 | 17,167 |
| Harrison | 36.51% | 23,119 | 62.33% | 39,470 | 1.17% | 739 | 63,328 |
| Hinds | 71.47% | 76,112 | 27.86% | 29,664 | 0.67% | 715 | 106,491 |
| Holmes | 84.11% | 7,812 | 15.45% | 1,435 | 0.44% | 41 | 9,288 |
| Humphreys | 74.88% | 3,903 | 24.81% | 1,293 | 0.31% | 16 | 5,212 |
| Issaquena | 60.86% | 479 | 38.37% | 302 | 0.76% | 6 | 787 |
| Itawamba | 18.31% | 1,706 | 79.34% | 7,393 | 2.35% | 219 | 9,318 |
| Jackson | 32.24% | 17,299 | 66.62% | 35,747 | 1.14% | 609 | 53,655 |
| Jasper | 54.57% | 5,097 | 44.89% | 4,193 | 0.54% | 50 | 9,340 |
| Jefferson | 89.13% | 3,951 | 10.56% | 468 | 0.32% | 14 | 4,433 |
| Jefferson Davis | 62.16% | 4,267 | 36.52% | 2,507 | 1.31% | 90 | 6,864 |
| Jones | 30.54% | 9,211 | 68.59% | 20,687 | 0.87% | 261 | 30,159 |
| Kemper | 64.11% | 3,239 | 35.41% | 1,789 | 0.48% | 24 | 5,052 |
| Lafayette | 41.48% | 8,091 | 56.78% | 11,075 | 1.74% | 339 | 19,505 |
| Lamar | 22.07% | 5,494 | 76.74% | 19,101 | 1.18% | 294 | 24,889 |
| Lauderdale | 42.15% | 13,814 | 57.05% | 18,700 | 0.80% | 263 | 32,777 |
| Lawrence | 36.85% | 2,468 | 62.59% | 4,192 | 0.57% | 38 | 6,698 |
| Leake | 45.41% | 4,079 | 54.14% | 4,863 | 0.46% | 41 | 8,983 |
| Lee | 35.58% | 12,563 | 63.49% | 22,415 | 0.93% | 328 | 35,306 |
| Leflore | 71.39% | 9,119 | 28.08% | 3,587 | 0.52% | 67 | 12,773 |
| Lincoln | 33.33% | 5,471 | 66.04% | 10,839 | 0.63% | 104 | 16,414 |
| Lowndes | 49.30% | 13,388 | 49.78% | 13,518 | 0.93% | 252 | 27,158 |
| Madison | 41.80% | 20,722 | 57.51% | 28,507 | 0.69% | 342 | 49,571 |
| Marion | 34.51% | 4,393 | 64.71% | 8,237 | 0.78% | 99 | 12,729 |
| Marshall | 59.42% | 9,650 | 39.86% | 6,473 | 0.72% | 117 | 16,240 |
| Monroe | 41.71% | 7,056 | 57.47% | 9,723 | 0.82% | 139 | 16,918 |
| Montgomery | 47.39% | 2,675 | 52.21% | 2,947 | 0.41% | 23 | 5,645 |
| Neshoba | 28.04% | 3,089 | 71.15% | 7,837 | 0.81% | 89 | 11,015 |
| Newton | 33.95% | 3,319 | 65.40% | 6,394 | 0.65% | 64 | 9,777 |
| Noxubee | 78.54% | 4,920 | 21.15% | 1,325 | 0.30% | 19 | 6,264 |
| Oktibbeha | 50.20% | 9,095 | 48.36% | 8,761 | 1.44% | 261 | 18,117 |
| Panola | 53.96% | 9,079 | 45.34% | 7,629 | 0.70% | 118 | 16,826 |
| Pearl River | 19.65% | 4,366 | 78.96% | 17,549 | 1.39% | 309 | 22,224 |
| Perry | 26.69% | 1,527 | 72.30% | 4,137 | 1.01% | 58 | 5,722 |
| Pike | 53.69% | 9,650 | 45.52% | 8,181 | 0.80% | 143 | 17,974 |
| Pontotoc | 22.59% | 2,804 | 76.13% | 9,448 | 1.28% | 159 | 12,411 |
| Prentiss | 28.08% | 2,817 | 70.52% | 7,075 | 1.41% | 141 | 10,033 |
| Quitman | 71.30% | 2,837 | 28.05% | 1,116 | 0.65% | 26 | 3,979 |
| Rankin | 23.37% | 14,988 | 75.52% | 48,444 | 1.11% | 713 | 64,145 |
| Scott | 44.91% | 5,031 | 54.36% | 6,089 | 0.73% | 82 | 11,202 |
| Sharkey | 70.38% | 1,782 | 29.11% | 737 | 0.51% | 13 | 2,532 |
| Simpson | 38.56% | 4,723 | 60.61% | 7,424 | 0.83% | 102 | 12,249 |
| Smith | 24.44% | 1,979 | 74.69% | 6,049 | 0.88% | 71 | 8,099 |
| Stone | 26.59% | 2,003 | 71.96% | 5,420 | 1.45% | 109 | 7,532 |
| Sunflower | 73.02% | 8,199 | 26.09% | 2,929 | 0.89% | 100 | 11,228 |
| Tallahatchie | 60.88% | 3,959 | 38.43% | 2,499 | 0.69% | 45 | 6,503 |
| Tate | 39.76% | 4,933 | 59.10% | 7,332 | 1.14% | 141 | 12,406 |
| Tippah | 25.28% | 2,317 | 73.30% | 6,717 | 1.42% | 130 | 9,164 |
| Tishomingo | 20.70% | 1,643 | 77.28% | 6,133 | 2.02% | 160 | 7,936 |
| Tunica | 79.30% | 3,475 | 20.15% | 883 | 0.55% | 24 | 4,382 |
| Union | 24.13% | 2,742 | 74.77% | 8,498 | 1.10% | 125 | 11,365 |
| Walthall | 45.32% | 3,422 | 53.65% | 4,051 | 1.03% | 78 | 7,551 |
| Warren | 50.42% | 10,786 | 48.89% | 10,457 | 0.69% | 148 | 21,391 |
| Washington | 70.92% | 13,981 | 28.66% | 5,651 | 0.42% | 83 | 19,715 |
| Wayne | 40.15% | 4,148 | 59.15% | 6,111 | 0.71% | 73 | 10,332 |
| Webster | 22.74% | 1,190 | 76.27% | 3,992 | 0.99% | 52 | 5,234 |
| Wilkinson | 70.31% | 3,412 | 29.16% | 1,415 | 0.54% | 26 | 4,853 |
| Winston | 46.87% | 4,607 | 52.58% | 5,168 | 0.55% | 54 | 9,829 |
| Yalobusha | 47.69% | 3,030 | 51.56% | 3,276 | 0.76% | 48 | 6,354 |
| Yazoo | 56.82% | 6,603 | 42.52% | 4,941 | 0.65% | 76 | 11,620 |
Counties that flipped from Republican to Democratic
- Benton (largest town: Hickory Flat)
- Warren (largest city: Vicksburg)
See also
References
- "2012 Presidential Election Results - Mississippi". Retrieved 5 January 2013.
- "2012 Exit Polls - Mississippi". Retrieved 5 January 2013.
- The Political Graveyard; Warren County, Mississippi
- "Mississippi Democratic Delegation 2012". The Green Papers. Retrieved 2019-08-01.
- "Primary and Caucus Printable Calendar". CNN. Retrieved January 11, 2012.
- "Presidential Primary Dates" (PDF). Federal Election Commission. Retrieved January 23, 2012.
- Mississippi Republican – The Green Papers
- http://www.sos.ms.gov/elections/electionresults/Republican%20Certification_2012%20Primary.pdf
- "Mississippi Republican Primary - Election Results - Election 2012". The New York Times.
External links
- The Green Papers: for Mississippi
- The Green Papers: Major state elections in chronological order