2012 United States presidential election in Ohio
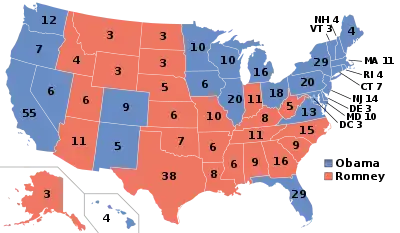
The 2012 United States presidential election in Ohio took place on November 6, 2012, as part of the 2012 United States presidential election in which all 50 states plus the District of Columbia participated. Ohio voters chose 18 electors to represent them in the Electoral College via a popular vote pitting incumbent Democratic President Barack Obama and his running mate, Vice President Joe Biden, against Republican challenger and former Massachusetts Governor Mitt Romney and his running mate, Congressman Paul Ryan. This election continued Ohio's bellwether streak, as the state voted for the winner of the presidential election every time after it voted for Richard Nixon in 1960 until 2020.
| ||||||||||||||||||||||||||
| Turnout | 70.54%[1] | |||||||||||||||||||||||||
|---|---|---|---|---|---|---|---|---|---|---|---|---|---|---|---|---|---|---|---|---|---|---|---|---|---|---|
| ||||||||||||||||||||||||||
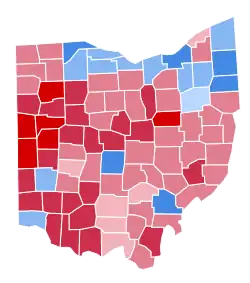 County Results
| ||||||||||||||||||||||||||
| ||||||||||||||||||||||||||
| Elections in Ohio |
|---|
.svg.png.webp) |
2012 U.S. presidential election | |
|---|---|
| Democratic Party | |
| Republican Party | |
| Related races | |
| |
President Obama won the popular vote in Ohio with 50.67% of the vote over Mitt Romney in second place at 47.69%, a Democratic victory margin of 2.98%.[2] Obama's performance was a decline from 2008 when he won the state by a 4.57% margin over U.S. Senator John McCain, and he narrowly lost five counties that he won in 2008.[3] However, he narrowly improved his margins in Cuyahoga County and Franklin County, home to the second largest city, Cleveland, and the state's capital and largest city, Columbus, respectively, allowing him to carry the state.
As of 2020, this is the last time the Democratic presidential nominee won Ohio, as well as the last time Wood County, Ottawa County, Sandusky County, Erie County, Stark County, Portage County, Trumbull County, and Ashtabula County have voted Democratic.
Democratic primary
The Democratic primary was held on March 6, 2012, the same day as the Republican primary. Incumbent President Barack Obama ran unopposed, and thus won all 151 of the state's delegates.
Republican primary
| |||||||||||||||||||||||||||||||||||||||||
| |||||||||||||||||||||||||||||||||||||||||
 Ohio results by county
Mitt Romney
Rick Santorum | |||||||||||||||||||||||||||||||||||||||||
.jpg.webp)
.jpg.webp)
The 2012 Ohio Republican presidential primary took place on March 6, 2012.[4]
Ohio has 66 delegates to the Republican National Convention. Three party officials (also known as "superdelegates") are not bound by the primary result. Forty-eight delegates are generally awarded winner-take-all by Congressional district. Another 15 delegates are awarded to the candidate who gets an outright majority statewide, or are allocated proportionately among candidates winning at least 20% of the vote if no candidate wins a majority.[5]
| 2012 Ohio Republican presidential primary[6] | |||
|---|---|---|---|
| Candidate | Votes | Percentage | Estimated national delegates |
| Mitt Romney | 460,831 | 37.9% | 38 |
| Rick Santorum | 448,580 | 37.1% | 25 |
| Newt Gingrich | 177,183 | 14.6% | 0 |
| Ron Paul | 113,256 | 9.3% | 0 |
| Rick Perry | 7,539 | 0.6% | 0 |
| Jon Huntsman, Jr. | 6,490 | 0.5% | 0 |
| Unprojected delegates | 7 | ||
| Totals | 1,213,879 | 100.0% | 66 |
Despite an early lead in the vote count and having won most counties, Santorum's lead was reduced and overcome by Romney as Hamilton and Cuyahoga County results came in.[7] Romney also won areas such as Akron, Youngstown, Dayton and Columbus. These and other highly populated counties would eventually go to Obama in November.
| Key: | Withdrew prior to contest |
Notes:
1. In the six congressional districts where Rick Santorum submitted only a partial slate of district delegates and district alternates by the late December 2011 deadline, he will be automatically awarded only the number of delegates he submitted, assuming he wins the particular district. The Ohio Republican Party said on March 2, 2012, that the remaining delegates in such districts will be "considered unbound" until a panel composed of three members of the Ohio GOP's central committee decides which campaign (if any) is permitted to appoint such delegates.[8]
2. In three congressional districts (OH-6, OH-9 and OH-13), Rick Santorum did not make the district-specific portion of the ballot.
3. In every district, each of the 6 candidates listed above appears on the "at-large" portion of the ballot. The results of the at-large ballot will determine the allocation of fifteen national convention delegates.
General election
Throughout the general election campaign Ohio was considered a key battleground state and Barack Obama and Mitt Romney campaigned extensively in the state.[9] Some experts believe that the popularity of the auto industry bailout put in place under President Obama helped him take the state.[9][10] In February 2013, nineteen cases of voter fraud were being investigated in Hamilton County;[11] in March 2013, three individuals were charged with voter fraud, with one individual alleged to have voted six times.[12] However, minus these questionable votes, even if they went to Obama,the outcome of the Ohio race is not affected as President Obama still wins Ohio by 166,272 votes.
Results
| 2012 United States presidential election in Ohio[13] | ||||||
|---|---|---|---|---|---|---|
| Party | Candidate | Running mate | Votes | Percentage | Electoral votes | |
| Democratic | Barack Obama | Joe Biden | 2,827,709 | 50.67% | 18 | |
| Republican | Mitt Romney | Paul Ryan | 2,661,437 | 47.69% | 0 | |
| Libertarian | Gary Johnson | Jim Gray | 49,493 | 0.89% | 0 | |
| Green | Jill Stein | Cheri Honkala | 18,573 | 0.33% | 0 | |
| Independent | Richard Duncan | Ricky Johnson | 12,502 | 0.22% | 0 | |
| Constitution | Virgil Goode | Jim Clymer | 8,152 | 0.15% | 0 | |
| Socialist | Stewart Alexander | Alex Mendoza | 2,944 | 0.05% | 0 | |
| Others | 37 | 0.00% | 0 | |||
| Totals | 5,580,847 | 100.00% | 18 | |||
| Voter turnout (registered voters) | 70.54% | |||||
Results by county
| County[14] | Barack Hussein Obama Democratic |
Willard Mitt Romney Republican |
Gary Earl Johnson[15] Libertarian |
Jill Ellen Stein[15] Green |
Various candidates Other parties |
Margin | Total votes cast | ||||||
|---|---|---|---|---|---|---|---|---|---|---|---|---|---|
| # | % | # | % | # | % | # | % | # | % | # | % | ||
| Adams | 3,976 | 36.14% | 6,865 | 62.40% | 98 | 0.89% | 55 | 0.50% | 8 | 0.07% | -2,889 | -26.26% | 11,002 |
| Allen | 17,913 | 37.27% | 29,502 | 61.38% | 464 | 0.97% | 164 | 0.34% | 22 | 0.05% | -11,589 | -24.11% | 48,065 |
| Ashland | 8,281 | 34.28% | 15,519 | 64.25% | 221 | 0.91% | 115 | 0.48% | 19 | 0.08% | -7,238 | -29.96% | 24,155 |
| Ashtabula | 23,803 | 55.62% | 18,298 | 42.76% | 433 | 1.01% | 224 | 0.52% | 36 | 0.08% | 5,505 | 12.86% | 42,794 |
| Athens | 18,307 | 66.59% | 8,543 | 31.07% | 434 | 1.58% | 188 | 0.68% | 21 | 0.08% | 9,764 | 35.51% | 27,493 |
| Auglaize | 5,831 | 25.02% | 17,169 | 73.68% | 209 | 0.90% | 83 | 0.36% | 9 | 0.04% | -11,338 | -48.66% | 23,301 |
| Belmont | 14,156 | 45.17% | 16,758 | 53.47% | 232 | 0.74% | 178 | 0.57% | 15 | 0.05% | -2,602 | -8.30% | 31,339 |
| Brown | 7,107 | 36.83% | 11,916 | 61.75% | 191 | 0.99% | 68 | 0.35% | 14 | 0.07% | -4,809 | -24.92% | 19,296 |
| Butler | 62,388 | 36.76% | 105,176 | 61.98% | 1,654 | 0.97% | 413 | 0.24% | 72 | 0.04% | -42,788 | -25.21% | 169,703 |
| Carroll | 5,543 | 42.26% | 7,315 | 55.77% | 173 | 1.32% | 71 | 0.54% | 15 | 0.11% | -1,772 | -13.51% | 13,117 |
| Champaign | 7,044 | 38.44% | 11,045 | 60.28% | 159 | 0.87% | 66 | 0.36% | 10 | 0.05% | -4,001 | -21.83% | 18,324 |
| Clark | 31,298 | 49.00% | 31,816 | 49.82% | 509 | 0.80% | 215 | 0.34% | 29 | 0.05% | -518 | -0.81% | 63,867 |
| Clermont | 30,458 | 31.72% | 64,208 | 66.88% | 1,069 | 1.11% | 248 | 0.26% | 27 | 0.03% | -33,750 | -35.15% | 96,010 |
| Clinton | 5,791 | 32.06% | 12,009 | 66.48% | 195 | 1.08% | 56 | 0.31% | 14 | 0.08% | -6,218 | -34.42% | 18,065 |
| Columbiana | 19,821 | 43.32% | 25,251 | 55.19% | 434 | 0.95% | 216 | 0.47% | 28 | 0.06% | -5,430 | -11.87% | 45,750 |
| Coshocton | 6,940 | 44.48% | 8,390 | 53.78% | 157 | 1.01% | 96 | 0.62% | 19 | 0.12% | -1,450 | -9.29% | 15,602 |
| Crawford | 7,507 | 37.91% | 11,852 | 59.85% | 186 | 0.67% | 108 | 0.39% | 13 | 0.05% | -4,345 | -21.94% | 19,847 |
| Cuyahoga | 447,232 | 69.54% | 190,651 | 29.64% | 3,448 | 0.54% | 1,564 | 0.24% | 231 | 0.04% | 256,581 | 39.90% | 643,126 |
| Darke | 6,826 | 27.03% | 18,108 | 71.72% | 212 | 0.84% | 86 | 0.34% | 17 | 0.07% | -11,282 | -44.68% | 25,249 |
| Defiance | 7,732 | 42.55% | 10,176 | 56.00% | 187 | 1.03% | 64 | 0.35% | 12 | 0.07% | -2,444 | -13.45% | 18,171 |
| Delaware | 37,292 | 37.84% | 60,194 | 61.07% | 851 | 0.86% | 205 | 0.21% | 20 | 0.02% | -22,902 | -23.24% | 98,562 |
| Erie | 21,793 | 55.57% | 16,952 | 43.23% | 300 | 0.77% | 158 | 0.40% | 12 | 0.03% | 4,841 | 12.34% | 39,215 |
| Fairfield | 29,890 | 41.64% | 41,034 | 57.17% | 624 | 0.87% | 210 | 0.29% | 23 | 0.03% | -11,144 | -15.52% | 71,781 |
| Fayette | 4,249 | 38.70% | 6,620 | 60.30% | 87 | 0.79% | 18 | 0.16% | 4 | 0.04% | -2,371 | -21.60% | 10,978 |
| Franklin | 346,336 | 60.79% | 215,987 | 37.91% | 5,535 | 0.97% | 1,659 | 0.29% | 201 | 0.04% | 130,349 | 22.88% | 569,718 |
| Fulton | 9,073 | 42.90% | 11,738 | 55.50% | 248 | 1.17% | 82 | 0.39% | 9 | 0.04% | -2,665 | -12.60% | 21,150 |
| Gallia | 4,557 | 36.56% | 7,750 | 62.17% | 79 | 0.63% | 69 | 0.55% | 11 | 0.09% | -3,193 | -25.61% | 12,466 |
| Geauga | 19,659 | 38.67% | 30,589 | 60.18% | 386 | 0.76% | 182 | 0.36% | 17 | 0.03% | -10,930 | -21.50% | 50,833 |
| Greene | 32,256 | 38.73% | 49,819 | 59.81% | 933 | 1.12% | 245 | 0.29% | 36 | 0.04% | -17,563 | -21.09% | 83,289 |
| Guernsey | 7,450 | 44.60% | 8,993 | 53.84% | 174 | 1.04% | 70 | 0.42% | 16 | 0.10% | -1,543 | -9.24% | 16,703 |
| Hamilton | 219,927 | 52.60% | 193,326 | 46.23% | 3,756 | 0.90% | 1,012 | 0.24% | 121 | 0.03% | 26,601 | 6.36% | 418,142 |
| Hancock | 12,564 | 35.37% | 22,443 | 63.19% | 352 | 0.99% | 130 | 0.37% | 30 | 0.08% | -9,879 | -27.81% | 35,519 |
| Hardin | 4,619 | 37.37% | 7,489 | 60.59% | 172 | 1.39% | 68 | 0.55% | 13 | 0.11% | -2,870 | -23.22% | 12,361 |
| Harrison | 2,950 | 41.62% | 4,019 | 56.70% | 62 | 0.87% | 47 | 0.66% | 10 | 0.14% | -1,069 | -15.08% | 7,088 |
| Henry | 5,658 | 39.98% | 8,257 | 58.35% | 169 | 1.19% | 55 | 0.39% | 13 | 0.09% | -2,599 | -18.36% | 14,152 |
| Highland | 6,049 | 34.14% | 11,410 | 64.40% | 176 | 0.99% | 67 | 0.38% | 15 | 0.08% | -5,361 | -30.26% | 17,717 |
| Hocking | 6,157 | 48.69% | 6,285 | 49.70% | 133 | 1.05% | 57 | 0.45% | 13 | 0.10% | -128 | -1.01% | 12,645 |
| Holmes | 2,608 | 22.76% | 8,702 | 75.95% | 93 | 0.81% | 43 | 0.38% | 12 | 0.10% | -6,094 | -53.19% | 11,458 |
| Huron | 11,006 | 44.97% | 13,060 | 53.37% | 260 | 1.06% | 115 | 0.47% | 31 | 0.13% | -2,054 | -8.39% | 24,472 |
| Jackson | 5,166 | 38.89% | 7,904 | 59.50% | 94 | 0.71% | 101 | 0.76% | 18 | 0.14% | -2,738 | -20.61% | 13,283 |
| Jefferson | 15,385 | 46.82% | 17,034 | 51.83% | 248 | 0.75% | 157 | 0.48% | 39 | 0.12% | -1,649 | -5.02% | 32,863 |
| Knox | 10,470 | 37.11% | 17,266 | 61.20% | 306 | 1.08% | 114 | 0.40% | 57 | 0.20% | -6,796 | -24.09% | 28,213 |
| Lake | 57,680 | 48.89% | 58,744 | 49.79% | 1,073 | 0.91% | 436 | 0.37% | 47 | 0.04% | -1,064 | -0.90% | 117,980 |
| Lawrence | 10,744 | 41.84% | 14,651 | 57.06% | 171 | 0.67% | 93 | 0.36% | 18 | 0.07% | -3,907 | -15.22% | 25,677 |
| Licking | 34,201 | 42.27% | 45,503 | 56.24% | 817 | 1.01% | 311 | 0.38% | 71 | 0.09% | -11,302 | -13.97% | 80,903 |
| Logan | 7,062 | 33.62% | 13,633 | 64.91% | 214 | 1.02% | 80 | 0.38% | 14 | 0.07% | -6,571 | -31.29% | 21,003 |
| Lorain | 81,464 | 57.06% | 59,405 | 41.61% | 1,275 | 0.89% | 554 | 0.39% | 72 | 0.05% | 22,059 | 15.45% | 142,770 |
| Lucas | 136,616 | 65.16% | 69,940 | 33.36% | 2,318 | 1.11% | 652 | 0.31% | 129 | 0.06% | 66,676 | 31.80% | 209,655 |
| Madison | 6,845 | 39.28% | 10,342 | 59.35% | 167 | 0.96% | 67 | 0.38% | 4 | 0.02% | -3,497 | -20.07% | 17,425 |
| Mahoning | 77,059 | 63.75% | 42,641 | 35.28% | 744 | 0.62% | 370 | 0.31% | 57 | 0.05% | 34,418 | 28.47% | 120,871 |
| Marion | 12,504 | 45.95% | 14,265 | 52.42% | 285 | 1.05% | 132 | 0.49% | 29 | 0.11% | -1,761 | -6.47% | 27,215 |
| Medina | 38,785 | 42.90% | 50,418 | 55.77% | 838 | 0.93% | 326 | 0.36% | 44 | 0.05% | -11,633 | -12.87% | 90,411 |
| Meigs | 4,027 | 39.81% | 5,895 | 58.27% | 111 | 1.10% | 70 | 0.69% | 13 | 0.13% | -1,868 | -18.47% | 10,116 |
| Mercer | 4,745 | 22.01% | 16,561 | 76.83% | 142 | 0.66% | 83 | 0.39% | 23 | 0.11% | -11,816 | -54.82% | 21,554 |
| Miami | 16,383 | 31.67% | 34,606 | 66.90% | 554 | 1.07% | 144 | 0.28% | 39 | 0.08% | -18,223 | -35.23% | 51,726 |
| Monroe | 3,035 | 45.37% | 3,548 | 53.04% | 48 | 0.72% | 47 | 0.70% | 11 | 0.16% | -513 | -7.67% | 6,689 |
| Montgomery | 137,139 | 51.66% | 124,841 | 47.03% | 2,548 | 0.96% | 775 | 0.29% | 172 | 0.06% | 12,298 | 4.63% | 265,475 |
| Morgan | 2,814 | 46.33% | 3,179 | 52.34% | 42 | 0.69% | 27 | 0.44% | 12 | 0.20% | -365 | -6.01% | 6,074 |
| Morrow | 5,933 | 36.91% | 9,865 | 61.37% | 174 | 1.08% | 79 | 0.49% | 24 | 0.15% | -3,932 | -24.46% | 16,075 |
| Muskingum | 17,001 | 46.15% | 19,264 | 52.29% | 352 | 0.96% | 185 | 0.50% | 36 | 0.10% | -2,263 | -6.14% | 36,838 |
| Noble | 2,131 | 36.72% | 3,563 | 61.39% | 62 | 1.07% | 44 | 0.76% | 4 | 0.07% | -1,432 | -24.67% | 5,804 |
| Ottawa | 11,503 | 51.43% | 10,538 | 47.11% | 220 | 0.98% | 97 | 0.43% | 10 | 0.04% | 965 | 4.31% | 22,368 |
| Paulding | 3,538 | 39.10% | 5,354 | 59.17% | 101 | 1.12% | 48 | 0.53% | 7 | 0.08% | -1,816 | -20.07% | 9,048 |
| Perry | 7,033 | 47.29% | 7,627 | 51.28% | 120 | 0.81% | 76 | 0.51% | 16 | 0.11% | -594 | -3.99% | 14,872 |
| Pickaway | 9,684 | 40.32% | 14,037 | 58.44% | 206 | 0.86% | 74 | 0.31% | 18 | 0.07% | -4,353 | -18.12% | 24,019 |
| Pike | 5,684 | 49.42% | 5,685 | 49.43% | 77 | 0.67% | 44 | 0.38% | 12 | 0.10% | -1 | -0.01% | 11,502 |
| Portage | 39,453 | 51.97% | 35,242 | 46.42% | 844 | 1.11% | 316 | 0.42% | 63 | 0.08% | 4,211 | 5.55% | 75,918 |
| Preble | 6,211 | 30.95% | 13,535 | 67.44% | 230 | 1.15% | 82 | 0.41% | 12 | 0.06% | -7,324 | -36.49% | 20,070 |
| Putnam | 4,318 | 23.62% | 13,721 | 75.04% | 160 | 0.88% | 71 | 0.39% | 14 | 0.08% | -9,403 | -51.43% | 18,284 |
| Richland | 22,687 | 39.55% | 33,867 | 59.04% | 503 | 0.88% | 245 | 0.43% | 60 | 0.10% | -11,180 | -19.49% | 57,362 |
| Ross | 14,569 | 48.69% | 15,008 | 50.16% | 223 | 0.75% | 105 | 0.35% | 18 | 0.06% | -439 | -1.47% | 29,923 |
| Sandusky | 14,541 | 50.47% | 13,755 | 47.74% | 324 | 1.12% | 162 | 0.56% | 29 | 0.10% | 786 | 2.73% | 28,811 |
| Scioto | 15,077 | 48.70% | 15,492 | 50.04% | 211 | 0.68% | 154 | 0.50% | 23 | 0.07% | -415 | -1.34% | 30,957 |
| Seneca | 11,353 | 45.28% | 13,243 | 52.81% | 316 | 1.26% | 136 | 0.54% | 27 | 0.11% | -1,890 | -7.54% | 25,075 |
| Shelby | 6,343 | 26.70% | 17,142 | 72.16% | 178 | 0.75% | 75 | 0.32% | 16 | 0.07% | -10,799 | -45.46% | 23,754 |
| Stark | 89,432 | 49.54% | 88,581 | 49.07% | 1,588 | 0.88% | 732 | 0.41% | 181 | 0.10% | 851 | 0.47% | 180,514 |
| Summit | 153,037 | 57.33% | 111,000 | 41.58% | 2,059 | 0.77% | 764 | 0.29% | 83 | 0.03% | 42,037 | 15.75% | 266,943 |
| Trumbull | 61,672 | 60.94% | 38,279 | 37.82% | 739 | 0.73% | 432 | 0.43% | 84 | 0.08% | 23,393 | 23.11% | 101,206 |
| Tuscarawas | 18,407 | 44.56% | 22,242 | 53.84% | 435 | 1.05% | 175 | 0.42% | 51 | 0.12% | -3,835 | -9.28% | 41,310 |
| Union | 8,805 | 34.58% | 16,289 | 63.97% | 280 | 1.10% | 83 | 0.33% | 6 | 0.02% | -7,484 | -29.39% | 25,463 |
| Van Wert | 4,029 | 29.20% | 9,585 | 69.47% | 95 | 0.69% | 65 | 0.47% | 23 | 0.17% | -5,556 | -40.27% | 13,797 |
| Vinton | 2,436 | 45.13% | 2,856 | 52.91% | 62 | 1.15% | 41 | 0.76% | 3 | 0.06% | -420 | -7.78% | 5,398 |
| Warren | 32,909 | 29.72% | 76,561 | 69.15% | 1,011 | 0.91% | 220 | 0.20% | 23 | 0.02% | -43,652 | -39.42% | 110,724 |
| Washington | 11,651 | 39.74% | 17,284 | 58.95% | 235 | 0.80% | 134 | 0.46% | 14 | 0.05% | -5,633 | -19.21% | 29,318 |
| Wayne | 19,808 | 39.04% | 30,251 | 59.62% | 451 | 0.89% | 184 | 0.36% | 45 | 0.09% | -10,443 | -20.58% | 50,739 |
| Williams | 7,266 | 41.37% | 10,047 | 57.20% | 148 | 0.84% | 95 | 0.54% | 9 | 0.05% | -2,781 | -15.83% | 17,565 |
| Wood | 32,802 | 51.44% | 29,704 | 46.58% | 940 | 1.47% | 279 | 0.44% | 44 | 0.07% | 3,098 | 4.86% | 63,769 |
| Wyandot | 4,137 | 39.42% | 6,180 | 58.88% | 99 | 0.94% | 68 | 0.65% | 12 | 0.11% | -2,043 | -19.46% | 10,496 |
| Totals | 2,827,627 | 50.86% | 2,661,407 | 47.87% | 49,493 | 0.89% | 18,574 | 0.33% | 3,074 | 0.06% | 166,220 | 2.99% | 5,560,175 |
Counties that flipped from Democratic to Republican
- Belmont (largest city: Martins Ferry)
- Jefferson (largest city: Steubenville)
- Lake (largest city: Mentor)
- Monroe (largest city: Woodsfield)
- Tuscarawas (largest city: New Philadelphia)
Analysis
President Obama won Ohio over Governor Mitt Romney. Ohio was too close to call for a decent portion of the night. At 11:12 P.M. EST, MSNBC called Ohio for Obama. All major news networks soon followed suit. Obama's victory in Ohio was enough to push him over the 270 electoral vote line allowing him to win the election. At first the Romney campaign contested the call, but conceded at about 1:00 A.M. Obama's victory in Ohio can be attributed to several factors. Obama only won 17 out of Ohio's 88 counties. However, those 17 counties combined account for 56.56% of the state's total population.[16] Romney did do well in most rural areas of the state, particularly in western Ohio. Romney also won all but one county in the Appalachia region, becoming the first Republican since Richard Nixon’s 2,900-plus-county landslide in 1972 to carry Belmont, Jefferson and Monroe Counties, and losing only Athens County, home of Ohio University. He also managed to flip the swing counties of Lake and Tuscawaras. Romney also did well in the northern Columbus suburbs. For Romney, most of his wins came from smaller populated counties. Obama won by comfortable margins in Franklin, Hamilton, and Lucas counties, home to the cities of Columbus, Cincinnati, and Toledo, respectively. Obama's greatest support came from northeast Ohio, centered in Cuyahoga and Summit counties, home to the cities of Cleveland and Akron, respectively, the second and fourth largest cities in the state. The surrounding Cleveland–Akron–Canton metropolitan area and the Lake Erie shore went mostly to Obama, allowing him to carry the state as a whole. Obama won statewide by 2.98%.
See also
- United States presidential elections in Ohio
- Presidency of Barack Obama
- 2012 United States presidential debates
- 2012 Republican Party presidential debates and forums
- 2012 Republican Party presidential primaries
- Results of the 2012 Republican Party presidential primaries
- Ohio Democratic Party
- Ohio Republican Party
References
- [sos.state.oh.us/elections/election-results-and-data/2012-elections-results/ "2012 ELECTIONS RESULTS"] Check
|url=value (help). Ohio Secretary of State. Retrieved 25 June 2020. - "Ohio Decides 2012 – Candidates for President". Ohio Secretary of State.
- "Ohio - Election Results 2008 - The New York Times". www.nytimes.com. Retrieved 2020-09-27.
- "Primary and Caucus Printable Calendar". CNN. Retrieved January 12, 2012.
- Nate Silver (March 4, 2012). "Romney Could Win Majority of Super Tuesday Delegates". FiveThirtyEight. Retrieved March 5, 2012.
- "Secretary of State results". Archived from the original on 2012-07-29. Retrieved 2012-09-21.
- Exclusive Super Tuesday Numbers from Hamilton County, CNN, 2012-03-06, retrieved 2016-04-26
- "Ohio delegates". ABC News. Retrieved March 2, 2012.
- "Ohio Working Class May Offer Key to Obama's Re-election". The New York Times.
- "How Obama Took The Battleground States". NPR.
- Emily Maxwell (6 February 2013). "Poll worker accused of voter fraud in Hamilton County speaks out". WCPO. Archived from the original on 8 February 2013. Retrieved 8 February 2013.
"Possible Ohio voter fraud investigation heats up". San Francisco Chronicle. Associated Press. 6 February 2013. Retrieved 8 February 2013. - Eric Shawn (11 March 2013). "Cincinnati poll worker charged with voting half dozen times in November". Fox News. Retrieved 12 March 2013.
"Nun, Poll Worker, Widower Charged With Voter Fraud". WKRC. Sinclair Broadcast Group. 11 March 2013. Archived from the original on 21 October 2013. Retrieved 12 March 2013. - "2012 Elections Results - Ohio Secretary of State". www.ohiosos.gov. Retrieved 2020-09-27.
- "Archived copy". Archived from the original on 2016-11-07. Retrieved 2016-11-06.CS1 maint: archived copy as title (link)
- "OH US President November 06, 2012". Our Campaigns.
- Bureau, US Census. "County Population Totals: 2010-2019". The United States Census Bureau. Retrieved 2020-09-27.
External links
- The Green Papers: for Ohio
- The Green Papers: Major state elections in chronological order