Jammu district
Jammu is the most populous of the districts of Jammu and Kashmir in India, and is home to the winter capital (Jammu) of Jammu and Kashmir. The capital moves to Srinagar city in the summer.[3]
Jammu district | |
|---|---|
District of Jammu and Kashmir | |
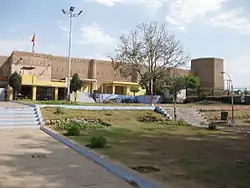 Bahu Fort, Jammu, India | |
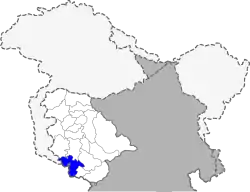 Location of Jammu district in Jammu and Kashmir | |
| Coordinates (Jammu): 32.73°N 74.87°E | |
| Country | India |
| Union territory | Jammu and Kashmir |
| Division | Jammu Division |
| Headquarters | Jammu |
| Tehsils | 1. Akhnoor, 2. Bishnah, 3. Jammu, 4. Ranbir Singh Pora |
| Government | |
| • Lok Sabha constituencies | Jammu (Lok Sabha constituency) |
| • Vidhan Sabha constituencies | 20 |
| Area | |
| • Total | 2,342 km2 (904 sq mi) |
| • Urban | 252.13 km2 (97.35 sq mi) |
| • Rural | 2,089.87 km2 (806.90 sq mi) |
| Population (2011)[2] | |
| • Total | 1,529,958 |
| • Density | 650/km2 (1,700/sq mi) |
| • Urban | 765,013 |
| • Rural | 764,945 |
| Demographics | |
| • Literacy | 83.45% |
| • Sex ratio | 880 |
| Time zone | UTC+05:30 (IST) |
| Vehicle registration | JK-02 |
| Website | http://jammu.nic.in/ |
Administrative divisions
Jammu District has 7 Sub-Divisions:
- Jammu South
- Jammu North
- R.S. Pura
- Marh
- Akhnoor
- Chowki Choura
- Khour
There are 21 Tehsils:
- Akhnoor
- Arnia
- Bahu
- Bhalwal
- Bishnah
- Chowki Choura
- Dansal
- Jammu
- Jammu North
- Jammu South
- Jammu West
- Jourian
- Kharah Balli
- Khour
- Maira Mandrian
- Mandal
- Marh
- Nagrota
- Pargwal
- Ranbir Singh Pura
- Suchetgarh
There are 20 Blocks:
- Akhnoor
- Arnia
- Bhalwal
- Bhalwal Brahmana
- Bishnah
- Chowki Choura
- Dansal
- Khour
- Kharah Balli
- Maira Mandrian
- Mandal
- Marh
- Mathwar
- Miran Sahib
- Nagrota
- Pargwal
- R.S. Pura
- Samwan
- Satwari
- Suchetgarh
Demographics
|
Jammu district: mother-tongue of population, according to the 2011 Census.[5] Dogri (70.85%) Ponchi (0.75%) Gojri (3.86%) Hindi (5.88%) Kashmiri (6.00%) Punjabi (8.10%) Others (4.56%)
| ||||||||||||||||||||||||||||||||||||||||||||||||||||||||||||||
| Jammu district: religion, gender ratio, and % urban of population, according to the 2011 Census.[2] | |||||||||
|---|---|---|---|---|---|---|---|---|---|
| Hindu | Muslim | Christian | Sikh | Buddhist | Jain | Other | Not stated | Total | |
| Total | 1,289,240 | 107,489 | 12,104 | 114,272 | 470 | 1,987 | 321 | 4,075 | 1,529,958 |
| 84.27% | 7.03% | 0.79% | 7.47% | 0.03% | 0.13% | 0.02% | 0.27% | 100.00% | |
| Male | 685,679 | 56,927 | 6,455 | 61,098 | 266 | 1,038 | 171 | 2,187 | 813,821 |
| Female | 603,561 | 50,562 | 5,649 | 53,174 | 204 | 949 | 150 | 1,888 | 716,137 |
| Gender ratio (% female) | 46.8% | 47.0% | 46.7% | 46.5% | 43.4% | 47.8% | 46.7% | 46.3% | 46.8% |
| Sex ratio (no. of females per 1,000 males) |
880 | 888 | 875 | 870 | – | 914 | – | 863 | 880 |
| Urban | 621,495 | 54,157 | 9,599 | 75,307 | 361 | 1,949 | 156 | 1,989 | 765,013 |
| Rural | 667,745 | 53,332 | 2,505 | 38,965 | 109 | 38 | 165 | 2,086 | 764,945 |
| % Urban | 48.2% | 50.4% | 79.3% | 65.9% | 76.8% | 98.1% | 48.6% | 48.8% | 50.0% |
| Jammu district: mother-tongue of population, according to the 2011 Census.[5] | |||
|---|---|---|---|
| Mother tongue code | Mother tongue | People | Percentage |
| 001002 | Assamese | 1,123 | 0.07% |
| 002007 | Bengali | 3,879 | 0.25% |
| 004001 | Dogri | 1,084,040 | 70.85% |
| 005018 | Gujarati | 975 | 0.06% |
| 005054 | Ponchi | 11,402 | 0.75% |
| 006086 | Bhadrawahi | 4,490 | 0.29% |
| 006096 | Bharmauri/Gaddi | 116 | 0.01% |
| 006102 | Bhojpuri | 3,878 | 0.25% |
| 006125 | Bundeli/Bundel khandi | 893 | 0.06% |
| 006142 | Chhattisgarhi | 6,057 | 0.40% |
| 006195 | Garhwali | 411 | 0.03% |
| 006207 | Gojri/Gujjari/Gujar | 59,048 | 3.86% |
| 006235 | Haryanvi | 964 | 0.06% |
| 006240 | Hindi | 90,037 | 5.88% |
| 006340 | Kumauni | 179 | 0.01% |
| 006376 | Magadhi/Magahi | 84 | 0.01% |
| 006439 | Pahari | 5,738 | 0.38% |
| 006489 | Rajasthani | 1,384 | 0.09% |
| 007016 | Kannada | 1,087 | 0.07% |
| 008005 | Kashmiri | 91,733 | 6.00% |
| 008010 | Kishtwari | 841 | 0.05% |
| 008018 | Siraji | 196 | 0.01% |
| 008019 | Dardi | 1,703 | 0.11% |
| 010008 | Maithili | 341 | 0.02% |
| 011016 | Malayalam | 2,056 | 0.13% |
| 012003 | Manipuri | 247 | 0.02% |
| 013071 | Marathi | 3,843 | 0.25% |
| 014011 | Nepali | 3,061 | 0.20% |
| 015043 | Odia | 2,504 | 0.16% |
| 016038 | Punjabi | 123,867 | 8.10% |
| 020027 | Tamil | 2,463 | 0.16% |
| 021046 | Telugu | 2,422 | 0.16% |
| 022015 | Urdu | 4,696 | 0.31% |
| 040001 | English | 193 | 0.01% |
| 053005 | Gujari | 1,090 | 0.07% |
| 073003 | Ladakhi | 290 | 0.02% |
| 115011 | Purkhi | 90 | 0.01% |
| – | Others | 12,537 | 0.82% |
| Total | 1,529,958 | 100.00% | |
References
- District Census Handbook Jammu, Part A (PDF). Census of India 2011 (Report). 18 June 2014. pp. 13, 51, 116. Retrieved 21 November 2020.
District Census Handbook Jammu, Part B (PDF). Census of India 2011 (Report). 16 June 2014. pp. 13, 24. Retrieved 21 November 2020. - C-1 Population By Religious Community – Jammu & Kashmir (Report). Office of the Registrar General & Census Commissioner, India. Retrieved 28 July 2020.
- 2011 census J&K
- "A-2 Decadal Variation In Population Since 1901". Censusindia.gov.in. Retrieved 9 August 2019.
- C-16 Population By Mother Tongue – Jammu & Kashmir (Report). Office of the Registrar General & Census Commissioner, India. Retrieved 18 July 2020.
External links
Places adjacent to Jammu district | ||||||||||
|---|---|---|---|---|---|---|---|---|---|---|
| ||||||||||
This article is issued from Wikipedia. The text is licensed under Creative Commons - Attribution - Sharealike. Additional terms may apply for the media files.