Clarion County, Pennsylvania
Clarion County is a county located in the U.S. state of Pennsylvania. As of the 2010 census, the population was 39,988.[2] Its county seat is Clarion.[3] The county was formed on March 11, 1839, from parts of Venango and Armstrong counties. Clarion County is entirely defined as part of the Pittsburgh media market.
Clarion County | |
|---|---|
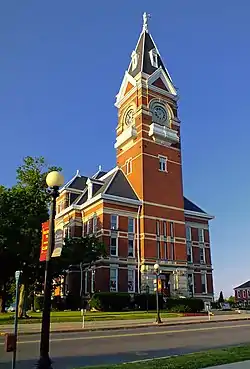 Clarion County Courthouse | |
 Seal | |
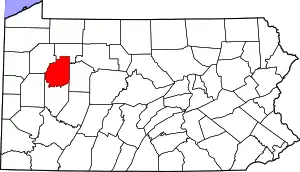 Location within the U.S. state of Pennsylvania | |
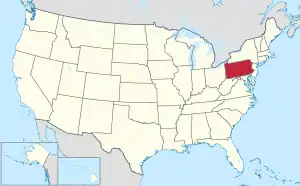 Pennsylvania's location within the U.S. | |
| Coordinates: 41°11′N 79°25′W | |
| Country | |
| State | |
| Founded | March 11, 1839 |
| Named for | Clarion River |
| Seat | Clarion |
| Largest borough | Clarion |
| Area | |
| • Total | 610 sq mi (1,600 km2) |
| • Land | 601 sq mi (1,560 km2) |
| • Water | 9.0 sq mi (23 km2) 1.5%% |
| Population | |
| • Estimate (2018) | 38,779 |
| • Density | 66/sq mi (25/km2) |
| Time zone | UTC−5 (Eastern) |
| • Summer (DST) | UTC−4 (EDT) |
| Congressional district | 15th |
| Website | www |
| Designated | April 26, 1982[1] |
Geography
According to the U.S. Census Bureau, the county has a total area of 610 square miles (1,600 km2), of which 601 square miles (1,560 km2) is land and 9.0 square miles (23 km2) (1.5%) is water.[4] It has a warm-summer humid continental climate (Dfb), and average temperatures in Clarion borough range from 24.5 °F in January to 82 °F in July.[5]
Adjacent counties
- Forest County (north)
- Jefferson County (east)
- Armstrong County (south)
- Butler County (west)
- Venango County (west)
Parks
Part of Cook Forest State Park is in Clarion County.
The Clarion County Park is located in Paint Township. Clarion County Veterans Memorial Park is located directly across Main Street (Route 322) from the Clarion County Courthouse in the center of the Borough of Clarion.
Demographics
| Historical population | |||
|---|---|---|---|
| Census | Pop. | %± | |
| 1850 | 23,565 | — | |
| 1860 | 24,988 | 6.0% | |
| 1870 | 26,537 | 6.2% | |
| 1880 | 40,328 | 52.0% | |
| 1890 | 36,802 | −8.7% | |
| 1900 | 34,283 | −6.8% | |
| 1910 | 36,683 | 7.0% | |
| 1920 | 36,170 | −1.4% | |
| 1930 | 34,531 | −4.5% | |
| 1940 | 38,410 | 11.2% | |
| 1950 | 38,334 | −0.2% | |
| 1960 | 37,480 | −2.2% | |
| 1970 | 38,414 | 2.5% | |
| 1980 | 43,362 | 12.9% | |
| 1990 | 41,699 | −3.8% | |
| 2000 | 41,765 | 0.2% | |
| 2010 | 39,988 | −4.3% | |
| 2018 (est.) | 38,779 | [6] | −3.0% |
| U.S. Decennial Census[7] 1790-1960[8] 1900-1990[9] 1990-2000[10] 2010-2017[2] | |||
As of the census[11] of 2000, there were 41,765 people, 16,052 households, and 10,738 families residing in the county. The population density was 69 people per square mile (27/km2). There were 19,426 housing units at an average density of 32 per square mile (12/km2). The racial makeup of the county was 98.16% White, 0.79% Black or African American, 0.11% Native American, 0.34% Asian, 0.08% from other races, and 0.52% from two or more races. 0.41% of the population were Hispanic or Latino of any race. 43.9% were English or Welsh, 12.9% American, 10.5% German, 8.0% Irish, 6.3% Scotch-Irish, 5.5% Italian and 2.6% Dutch, and 2.0% French ancestry.
There were 16,052 households, out of which 28.60% had children under the age of 18 living with them, 54.90% were married couples living together, 8.40% had a female householder with no husband present, and 33.10% were non-families. 26.00% of all households were made up of individuals, and 11.30% had someone living alone who was 65 years of age or older. The average household size was 2.46 and the average family size was 2.95.
In the county, the population was spread out, with 21.60% under the age of 18, 15.40% from 18 to 24, 25.20% from 25 to 44, 22.70% from 45 to 64, and 15.20% who were 65 years of age or older. The median age was 36 years. For every 100 females there were 93.30 males. For every 100 females age 18 and over, there were 90.40 males.
Government
| Year | Republican | Democratic | Third parties |
|---|---|---|---|
| 2020 | 74.8% 14,578 | 24.0% 4,678 | 1.2% 237 |
| 2016 | 71.2% 12,576 | 24.2% 4,273 | 4.6% 811 |
| 2012 | 66.6% 10,828 | 31.1% 5,056 | 2.4% 386 |
| 2008 | 60.1% 10,737 | 37.8% 6,756 | 2.2% 384 |
| 2004 | 64.4% 11,063 | 35.2% 6,049 | 0.4% 72 |
| 2000 | 61.8% 9,796 | 35.4% 5,605 | 2.8% 448 |
| 1996 | 45.9% 6,916 | 39.5% 5,954 | 14.6% 2,201 |
| 1992 | 41.2% 6,477 | 35.5% 5,584 | 23.3% 3,657 |
| 1988 | 58.4% 8,026 | 40.8% 5,616 | 0.8% 109 |
| 1984 | 64.3% 9,836 | 35.3% 5,407 | 0.4% 61 |
| 1980 | 58.4% 8,812 | 36.2% 5,472 | 5.4% 817 |
| 1976 | 55.0% 8,360 | 43.3% 6,585 | 1.7% 265 |
| 1972 | 68.0% 10,073 | 30.4% 4,509 | 1.6% 239 |
| 1968 | 56.0% 8,077 | 37.0% 5,341 | 7.0% 1,005 |
| 1964 | 39.9% 6,143 | 60.0% 9,235 | 0.1% 11 |
| 1960 | 65.0% 10,307 | 34.7% 5,506 | 0.2% 34 |
| 1956 | 66.9% 10,048 | 33.0% 4,955 | 0.1% 8 |
| 1952 | 63.8% 9,340 | 35.6% 5,212 | 0.7% 97 |
| 1948 | 57.9% 6,866 | 42.1% 4,984 | |
| 1944 | 60.2% 8,098 | 39.1% 5,263 | 0.7% 99 |
| 1940 | 57.8% 9,035 | 42.0% 6,564 | 0.3% 44 |
| 1936 | 49.3% 8,477 | 48.9% 8,412 | 1.8% 300 |
| 1932 | 46.0% 5,991 | 51.1% 6,651 | 2.9% 373 |
| 1928 | 70.4% 9,183 | 28.7% 3,746 | 0.8% 109 |
| 1924 | 55.3% 5,913 | 34.0% 3,642 | 10.7% 1,143 |
| 1920 | 53.3% 4,615 | 40.3% 3,487 | 6.5% 560 |
| 1916 | 41.1% 2,595 | 51.7% 3,269 | 7.2% 454 |
| 1912 | 14.6% 916 | 49.2% 3,079 | 36.2% 2,267 |
| 1908 | 42.9% 2,915 | 48.5% 3,291 | 8.6% 585 |
| 1904 | 51.0% 2,978 | 42.2% 2,466 | 6.9% 401 |
| 1900 | 44.7% 3,002 | 51.7% 3,472 | 3.6% 244 |
| 1896 | 43.6% 3,338 | 53.5% 4,097 | 3.0% 227 |
| 1892 | 39.2% 2,543 | 57.8% 3,746 | 3.0% 193 |
| 1888 | 41.7% 2,950 | 54.9% 3,880 | 3.4% 243 |
County Commissioners
- Wayne Brosius; Republican
- Ted Tharan; Republican
- Ed Heasley; Democrat
Other county officials
- Hon. James G. Arner, senior judge, Pennsylvania Courts of Common Pleas
- Hon. Sara Seidle-Patton, president judge, Pennsylvania Courts of Common Pleas
- Duane L. Quinn (18-3-01), district judge
- Timothy P. Schill (18-3-02), district judge
- Jarah L Heeter (18-3-03), district judge
- Jeffery C. Miller (18-3-04), district judge
- Drew Welsh; Republican, District Attorney
- Rex Munsee; Republican, sheriff
- Karyn Montana; Republican, treasurer
State Senate
| District | Senator | Party |
|---|---|---|
| 21 | Scott E. Hutchinson | Republican |
State House of Representatives
| District | Representative | Party |
|---|---|---|
| 63 | Donna Oberlander | Republican |
United States House of Representatives
| District | Representative | Party |
|---|---|---|
| 15 | Glenn Thompson | Republican |
United States Senate
| Senator | Party |
|---|---|
| Pat Toomey | Republican |
| Bob Casey | Democrat |
Education
Colleges and universities
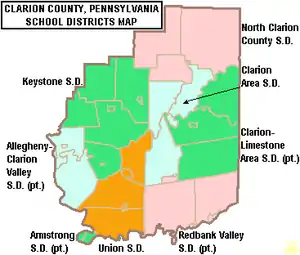
Public school districts
- Allegheny-Clarion Valley School District
- Clarion Area School District
- Clarion-Limestone Area School District
- Karns City Area School District
- Keystone School District
- North Clarion County School District
- Redbank Valley School District
- Union School District
The eight school districts of Clarion County have low enrollment. The Pennsylvania Department of Education projects that they will continue to experience steadily declining enrollment through 2019. A new school district composed of Clarion Area School District, Clarion-Limestone Area School District and North Clarion County School District would have a student population of 2500 with declining enrollment projected in all three former districts through 2019. A new district composed of Union School District (Pennsylvania), Keystone School District and adding Perry Township and Richland Township would have a student population under 2000 pupils. Consolidation would bring the elimination of costly main office, administrator positions. This would assist the district residents with the rising school administrator, employee and teachers' pension costs by controlling the need to raise taxes.
Over the next 10 years, rural Pennsylvania school enrollment is projected to decrease 8 percent. The most significant enrollment decline is projected to be in western Pennsylvania, where rural school districts may have a 16 percent decline. More than 40 percent of elementary schools and more than 60 percent of secondary schools in western Pennsylvania are projected to experience significant enrollment decreases (15 percent or greater).[13] As the enrollment declines, per pupil administrative costs of the schools will continue to rise.
Pennsylvania has one of the highest numbers of school districts in the nation. In Pennsylvania, 80% of the school districts serve student populations under 5,000, and 40% serve less than 2,000. Less than 95 of Pennsylvania's 501 school districts had enrollment below 1250 students in 2007.[14] This results in excessive school administration bureaucracy and not enough course diversity.[15] In a survey of 88 superintendents of small districts, 42% of the 49 respondents stated that they thought consolidation would save money without closing any schools.[16]
Property taxes in Pennsylvania are relatively high on a national scale. According to the Tax Foundation, Pennsylvania ranked 11th in the U.S. in 2008 in terms of property taxes paid as a percentage of home value (1.34%) and 12th in the country in terms of property taxes as a percentage of income (3.55%).[17]
Intermediate unit
Public school districts and private schools in the county are served by Riverview Intermediate Unit IU6 which provides special education and professional development services.
Technical school
Clarion County Career Center is located along State Route 66 in Marianne (Shippenville address).
Private schools
- Alexander Amish School - Venus
- Bear Run School - Knox
- Christs Dominion Academy - Summerville
- Clarion Center School - Clarion
- County Corner - Knox
- Deer View School - Mayport
- Immaculate Conception School - Clarion
- Little Bird Preschool - New Bethlehem
- Meadow View Amish School - Knox
- New Bethlehem Mennonite School - New Bethlehem
- Shady Nook Amish School - Sligo
- St Josephs School - Lucinda
- Zacheral Amish School - Venus
Communities
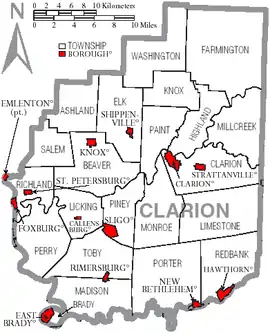
Under Pennsylvania law, there are four types of incorporated municipalities: cities, boroughs, townships, and, in at most two cases, towns. The following boroughs and townships are located in Clarion County:
Boroughs
Townships
Census-designated places
Population ranking
The population ranking of the following table is based on the 2010 census of Clarion County.[18]
† county seat
| Rank | City/town/etc. | Municipal type | Population (2010 Census) |
|---|---|---|---|
| 1 | † Clarion | Borough | 5,276 |
| 2 | Marianne | CDP | 1,167 |
| 3 | Knox | Borough | 1,146 |
| 4 | New Bethlehem | Borough | 989 |
| 5 | Rimersburg | Borough | 951 |
| 6 | East Brady | Borough | 942 |
| 7 | Sligo | Borough | 720 |
| 8 | Strattanville | Borough | 550 |
| 9 | Hawthorn | Borough | 494 |
| 10 | Shippenville | Borough | 480 |
| 11 | St. Petersburg | Borough | 400 |
| 12 | Callensburg | Borough | 207 |
| 13 | Tylersburg | CDP | 196 |
| T-14 | Foxburg | Borough | 183 |
| T-14 | Crown | CDP | 183 |
| 15 | Leeper | CDP | 158 |
| 16 | Vowinckel | CDP | 139 |
Notable people
- Marietta Bones (1842–1901) - suffragist, social reformer, philanthropist
- Fred Caligiuri (1918–2018) - Major League Baseball pitcher (Philadelphia Athletics, 1941, 1942); as of 2018 was the oldest living major-league player; born in Forest County; former resident of Knox and Rimersburg
- Hunter Corbett - pioneer American Presbyterian missionary to China, ministered in China for 56 years
- Jim Kelly - NFL athlete (Buffalo Bills); grew up in East Brady
- Chris Kirkpatrick - musician ('N Sync); born in Clarion
- Dominick Labino - glass artist; born in Fairmount City (Redbank Township); managed the Owens-Illinois glass plant in Clarion
- Ossee Schreckengost - Major League Baseball player; born in New Bethlehem
- Randall Silvis - author and screenwriter; born in Madison Township
- Ernest M. Skinner - pipe organ builder, inventor; born in Clarion
- Grace McCalmont Sloan - first woman to be elected Treasurer of the Commonwealth of Pennsylvania and Auditor General of the Commonwealth of Pennsylvania; resident of Clarion Borough[19]
- Jane Wolfe - silent film actress and thelemite; born in St. Petersburg
- Chad Jack - Jefferson County Tire Toss Champion; born in Emlenton
See also
References
- "PHMC Historical Markers Search" (Searchable database). Pennsylvania Historical and Museum Commission. Commonwealth of Pennsylvania. Retrieved 2014-01-25.
- "State & County QuickFacts". United States Census Bureau. Archived from the original on July 8, 2011. Retrieved November 16, 2013.
- "Find a County". National Association of Counties. Archived from the original on 2011-05-31. Retrieved 2011-06-07.
- "2010 Census Gazetteer Files". United States Census Bureau. August 22, 2012. Retrieved March 6, 2015.
- "Population and Housing Unit Estimates". Retrieved October 9, 2018.
- "U.S. Decennial Census". United States Census Bureau. Retrieved March 6, 2015.
- "Historical Census Browser". University of Virginia Library. Retrieved March 6, 2015.
- Forstall, Richard L., ed. (March 24, 1995). "Population of Counties by Decennial Census: 1900 to 1990". United States Census Bureau. Retrieved March 6, 2015.
- "Census 2000 PHC-T-4. Ranking Tables for Counties: 1990 and 2000" (PDF). United States Census Bureau. April 2, 2001. Retrieved March 6, 2015.
- "U.S. Census website". United States Census Bureau. Retrieved 2008-01-31.
- Leip, David. "Dave Leip's Atlas of U.S. Presidential Elections". uselectionatlas.org. Retrieved 22 November 2018.
- "Research Analyzes Rural School District Enrollment and Building Capacity", The Center for Rural Pennsylvania. October 2009
- Pennsylvania Legislative Budget and Finance Committee, Study of the Cost Effectiveness of Consolidating Pennsylvania School Districts, 2007.
- Rendell, E. & Soderberg, M. (2009). Pennsylvania school district consolidation. 2009-10 Executive Budget Fast Facts. Pennsylvania Office of the Governor.
- Study of the cost-effectiveness of consolidating Pennsylvania districts. New York: Standard & Poor’s School Evaluation Services. 2007, p. 6.
- New Census Data on Property Taxes on Homeowners, Tax Foundation, September 22, 2009.
- "2010 U.S. Census website". United States Census Bureau. Retrieved 2013-02-10.
- The Pennsylvania Manual 1963-1964
| Wikimedia Commons has media related to Clarion County, Pennsylvania. |
Municipalities and communities of Clarion County, Pennsylvania, United States | ||
|---|---|---|
| Boroughs | | |
| Townships | ||
| CDPs | ||
| Unincorporated communities | ||
| Footnotes | ‡This populated place also has portions in an adjacent county or counties | |
| ||
| Authority control |
|---|