Beaver County, Pennsylvania
Beaver County is a county in the U.S. state of Pennsylvania. As of the 2010 census, the population was 170,539.[2] Its county seat is Beaver.[3] The county was created on March 12, 1800, from parts of Allegheny and Washington Counties.[4] It took its name from the Beaver River.[5]
Beaver County | |
|---|---|
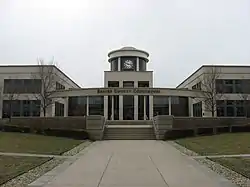 Beaver County Courthouse | |
 Seal | |
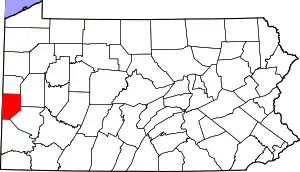 Location within the U.S. state of Pennsylvania | |
 Pennsylvania's location within the U.S. | |
| Coordinates: 40°41′N 80°21′W | |
| Country | |
| State | |
| Founded | March 12, 1800 |
| Named for | Beaver River |
| Seat | Beaver |
| Largest city | Aliquippa |
| Area | |
| • Total | 444 sq mi (1,150 km2) |
| • Land | 435 sq mi (1,130 km2) |
| • Water | 9.3 sq mi (24 km2) 2.1%% |
| Population | |
| • Estimate (2019) | 163,929 |
| • Density | 379/sq mi (146/km2) |
| Time zone | UTC−5 (Eastern) |
| • Summer (DST) | UTC−4 (EDT) |
| Congressional district | 17th |
| Website | www |
| Designated | July 5, 1982[1] |
Beaver County is part of the Pittsburgh, PA Metropolitan Statistical Area.
History
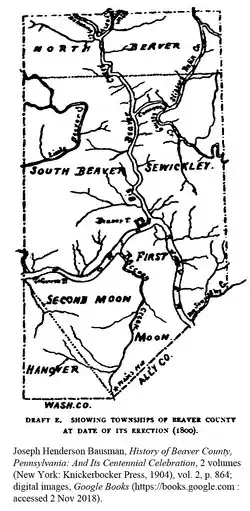
The original townships at the date of the erection of Beaver County (1800) were North Beaver, east and west of the Big Beaver Creek; South Beaver, west of the Big Beaver; and Sewickley, east of the Big Beaver—all north of the Ohio River; and Hanover, First Moon, and Second Moon, south of the Ohio.[6]
Geography
According to the U.S. Census Bureau, the county has a total area of 444 square miles (1,150 km2), of which 435 square miles (1,130 km2) is land and 9.3 square miles (24 km2) (2.1%) is water.[7] It has a humid continental climate (Dfa/Dfb) and average monthly temperatures in the Beaver/Rochester vicinity range from 29.4 °F in January to 73.2 °F in July.[8]
Bodies of water
- The Ohio River flows north through Beaver County from a point near Ambridge, then turns west near Beaver and on to the Ohio and West Virginia borders. It divides the southern third of the county from the northern two-thirds.
- The Beaver River flows south from Lawrence County entering Beaver County near Koppel and continuing south to its confluence with the Ohio near Beaver.
Adjacent counties
- Lawrence County (north)
- Butler County (east)
- Allegheny County (southeast)
- Washington County (south)
- Hancock County, West Virginia (west)
- Columbiana County, Ohio (west)
Demographics
| Historical population | |||
|---|---|---|---|
| Census | Pop. | %± | |
| 1800 | 5,776 | — | |
| 1810 | 12,168 | 110.7% | |
| 1820 | 15,340 | 26.1% | |
| 1830 | 24,183 | 57.6% | |
| 1840 | 29,368 | 21.4% | |
| 1850 | 26,689 | −9.1% | |
| 1860 | 29,140 | 9.2% | |
| 1870 | 36,148 | 24.0% | |
| 1880 | 39,605 | 9.6% | |
| 1890 | 50,077 | 26.4% | |
| 1900 | 56,432 | 12.7% | |
| 1910 | 78,253 | 38.7% | |
| 1920 | 111,621 | 42.6% | |
| 1930 | 149,062 | 33.5% | |
| 1940 | 156,754 | 5.2% | |
| 1950 | 175,192 | 11.8% | |
| 1960 | 206,948 | 18.1% | |
| 1970 | 208,418 | 0.7% | |
| 1980 | 204,441 | −1.9% | |
| 1990 | 186,093 | −9.0% | |
| 2000 | 181,412 | −2.5% | |
| 2010 | 170,539 | −6.0% | |
| 2019 (est.) | 163,929 | [9] | −3.9% |
| U.S. Decennial Census[10] 1790–1960[11] 1900–1990[12] 1990–2000[13] 2010–2019[2] | |||
As of the census[14] of 2000, there were 181,412 people, 72,576 households, and 50,512 families residing in the county. The population density was 418 people per square mile (161/km2). There were 77,765 housing units at an average density of 179 per square mile (69/km2). The racial makeup of the county was 92.55% White, 5.96% Black or African American, 0.10% Native American, 0.25% Asian, 0.01% Pacific Islander, 0.20% from other races, and 0.92% from two or more races. 0.72% of the population were Hispanic or Latino of any race. 23.0% were of German, 17.4% Italian, 9.9% Irish, 6.5% English, 6.4% Polish and 5.8% American ancestry.
There were 72,576 households, out of which 28.60% had children under the age of 18 living with them, 54.50% were married couples living together, 11.40% had a female householder with no husband present, and 30.40% were non-families. Of all households 26.90% were made up of individuals, and 13.10% had someone living alone who was 65 years of age or older. The average household size was 2.44 and the average family size was 2.96.
In the county, the age distribution of the population shows 22.60% under the age of 18, 7.40% from 18 to 24, 27.30% from 25 to 44, 24.20% from 45 to 64, and 18.40% who were 65 years of age or older. The median age was 41 years. For every 100 females, there were 91.90 males. For every 100 females age 18 and over, there were 88.20 males.
- Birth rate
Beaver County's live birth rate was 2,437 births in 1990. Beaver County's live birth rate in 2000 was 1,891 births, while in 2011 it had declined to 1,690 babies.[15] Over the past 50 years (1960 to 2010), rural Pennsylvania saw a steady decline in both the number and proportion of residents under 18 years old. In 1960, 1.06 million rural residents, or 35 percent of the rural population, were children.
- Teen pregnancy rate
Beaver County reported 1,069 babies born to teens (age 15–19) in 2011. In 2015, the number of teen births in Beaver County was 1,025.[16]
- County poverty demographics
According to research by The Center for Rural Pennsylvania, which is a legislative Agency of the Pennsylvania General Assembly, the poverty rate for Beaver County was 11.7% in 2014.[17] The statewide poverty rate was 13.6% in 2014. The 2012 childhood poverty rate by school district was: Ambridge Area School District: 40.6% living at 185% or below than the Federal Poverty Level; Aliquippa School District: 82.7%; Beaver Area School District: 17.4%; Big Beaver Falls Area School District: 71.3%; Blackhawk School District: 27.9%; Central Valley School District: 30.8%; Freedom Area School District: 40.8%, Hopewell Area School District: 24.9%; Midland Borough School District: 64.9%; New Brighton Area School District: 54.4%; Riverside Beaver County School District: 31.9%; Rochester Area High School: 66.3%; South Side Area School District: 31.5%; and Western Beaver County School District: 36.5%.[18] The child poverty rate is collected by the school districts as part of the federal free school lunch program.
Government and politics
| Year | Republican | Democratic | Third parties |
|---|---|---|---|
| 2020 | 58.2% 54,759 | 40.5% 38,122 | 1.3% 1,516 |
| 2016 | 57.0% 48,167 | 38.5% 32,531 | 4.5% 3,764 |
| 2012 | 52.4% 42,344 | 45.9% 37,055 | 1.7% 1,394 |
| 2008 | 50.5% 42,895 | 47.6% 40,499 | 1.9% 1,638 |
| 2004 | 48.4% 39,916 | 51.1% 42,146 | 0.6% 481 |
| 2000 | 44.1% 32,491 | 52.9% 38,925 | 3.0% 2,233 |
| 1996 | 35.1% 26,048 | 53.3% 39,578 | 11.7% 8,653 |
| 1992 | 25.9% 21,361 | 54.5% 44,877 | 19.6% 16,102 |
| 1988 | 33.7% 25,764 | 65.8% 50,327 | 0.5% 378 |
| 1984 | 36.8% 32,052 | 62.9% 54,765 | 0.3% 300 |
| 1980 | 38.2% 30,496 | 55.1% 43,955 | 6.7% 5,314 |
| 1976 | 41.4% 33,593 | 56.8% 46,117 | 1.8% 1,440 |
| 1972 | 56.4% 43,637 | 40.8% 31,570 | 2.8% 2,130 |
| 1968 | 34.5% 28,264 | 55.3% 45,396 | 10.2% 8,368 |
| 1964 | 27.6% 23,174 | 72.0% 60,492 | 0.4% 327 |
| 1960 | 43.7% 36,796 | 56.0% 47,182 | 0.3% 212 |
| 1956 | 51.2% 38,263 | 48.7% 36,373 | 0.1% 79 |
| 1952 | 45.2% 31,700 | 54.4% 38,136 | 0.5% 334 |
| 1948 | 43.8% 22,324 | 52.3% 26,629 | 3.9% 1,983 |
| 1944 | 41.6% 23,555 | 57.8% 32,743 | 0.6% 360 |
| 1940 | 41.8% 24,324 | 57.7% 33,609 | 0.5% 282 |
| 1936 | 34.7% 20,223 | 63.8% 37,205 | 1.5% 884 |
| 1932 | 47.9% 19,751 | 48.0% 19,805 | 4.1% 1,704 |
| 1928 | 69.5% 27,949 | 29.5% 11,868 | 1.0% 400 |
| 1924 | 64.1% 16,768 | 12.3% 3,220 | 23.5% 6,153 |
| 1920 | 62.9% 11,691 | 25.7% 4,771 | 11.4% 2,124 |
| 1916 | 48.7% 6,864 | 41.2% 5,805 | 10.2% 1,434 |
| 1912 | 21.9% 2,759 | 24.1% 3,037 | 54.0% 6,806 |
| 1908 | 56.0% 7,008 | 33.5% 4,200 | 10.5% 1,318 |
| 1904 | 68.9% 7,122 | 22.7% 2,342 | 8.5% 876 |
| 1900 | 60.1% 6,759 | 36.3% 4,076 | 3.6% 409 |
| 1896 | 60.0% 6,842 | 37.9% 4,322 | 2.2% 248 |
| 1892 | 52.0% 4,890 | 40.7% 3,822 | 7.3% 684 |
| 1888 | 58.2% 5,552 | 38.9% 3,706 | 2.9% 276 |
| 1884 | 56.5% 5,075 | 39.5% 3,546 | 4.0% 360 |
| 1880 | 56.4% 4,700 | 42.0% 3,498 | 1.6% 136 |
Voter registration
In November 2008, there were 118,269 registered voters in Beaver County.[21]
- Democratic: 70,819 (59.88%)
- Republican: 36,239 (30.64%)
- Other parties/non-partisan: 11,211 (9.48%)
By April 2016, there were 109,091 registered voters, a decrease of 7.7% since 2008.
The county is divided into 129 precincts.[22]
- Democratic: 58,828 (53.93%)
- Republican: 38,015 (34.85%)
- Other parties/non-partisan: 12,248 (11.23%)
As of November 7, 2017 there were 108,931 registered voters in the county. Democrats had a majority of the voters. There were 55,600 registered Democrats, 40,101 registered Republicans, 12,581 voters registered to other parties, 568 to the Libertarian Party and 81 voters registered to the Green Party.[23]
Voter registration
| Voter registration and party enrollment | |||||
|---|---|---|---|---|---|
| Party | Number of voters | Percentage | |||
| Democratic | 55,600 | 51.04 | |||
| Republican | 40,101 | 36.81 | |||
| Others | 12,581 | 11.55 | |||
| Libertarian | 568 | 0.52 | |||
| Green | 81 | 0.07 | |||
| Total | 108,931 | 100% | |||
Political history
Beaver County used to be a Democratic stronghold, and still has a large Democratic edge in registration. In 2015, however, the GOP took majority status in the Commissioners' Office for the first time since 1955. Multiple Democratic seats in both houses of the Pennsylvania Legislature have been lost to Republicans over the past few years. In statewide and federal elections it has been moving rightward as well. In 2004 Democrat John Kerry won Beaver County over Republican George Bush 51% to 48%. In 2008 Republican John McCain defeated Democrat Barack Obama 50% to 47%, becoming the first Republican to win there since 1972 and only the third since 1928. Mitt Romney and Donald Trump (twice) carried the county in the next three elections, cementing its status as a "red county" in presidential politics.
Each of the three state row office winners carried Beaver. In 2010 Republican Governor Tom Corbett and Republican Senator Pat Toomey both carried Beaver in their successful statewide bids. However, Beaver County voted for Bob Casey Jr. in his reelection bid in 2012 50% to 47%.
County commissioners
- Tony Amadio, Democrat
- Jack Manning, Republican [24]
- Daniel C. Camp III, Chairman, Republican
Other county offices
- Clerk of Courts, Judy Enslen, Democrat
- Controller, Maria Longo, Republican [25]
- Coroner, David Gabauer, Republican
- District Attorney, David Lozier, Republican
- Prothonotary, Michael Rossi, Democrat [26]
- Recorder of Deeds, Ronald Alberti, Republican [27]
- Register of Wills, Tracey Antoline Patton, Democrat
- Sheriff, Tony Guy, Republican
- Treasurer, Sandie Egley, Republican [28]
State senators
- Camera Bartolotta, Republican, Pennsylvania's 46th Senatorial District
- Elder Vogel, Jr., Republican, Pennsylvania's 47th Senatorial District
State representatives
- Aaron Bernstine, Republican, Pennsylvania's 10th Representative District
- Jim Marshall, Republican, Pennsylvania's 14th Representative District
- Josh Kail, Republican, Pennsylvania's 15th Representative District
- Robert F. Matzie, Democrat, Pennsylvania's 16th Representative District
United States House of Representatives
United States Senators
- Patrick Toomey, Republican, Pennsylvania
- Robert Casey Jr., Democrat, Pennsylvania
Attractions
Beaver County offers many shops and places to eat. Beaver County is home to the Beaver Valley Mall in Center Township which is home to hundreds of shops and restaurants.
Near Koppel there is Buttermilk Falls,[29] a naturally occurring waterfall.
Transportation
Major roads and highways
Public transit
Public transit is provided by the Beaver County Transit Authority.
Education
Colleges and universities
Community, junior, and technical colleges
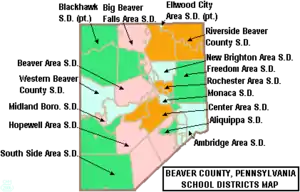
Public school districts
- Aliquippa School District
- Ambridge Area School District
- Beaver Area School District
- Big Beaver Falls Area School District
- Blackhawk School District (part)
- Central Valley School District
- Freedom Area School District
- Hopewell Area School District
- Midland Borough School District
- New Brighton Area School District
- Riverside Beaver County School District
- Rochester Area School District
- South Side Area School District
- Western Beaver County School District
The 498 school districts of Pennsylvania that have high schools were ranked for student academic achievement as demonstrated by three years of math and reading PSSA results by the Pittsburgh Business Times[30] in 2008.
High schools
- Aliquippa High School
- Ambridge Area High School
- Beaver Area High School
- Beaver County Christian High School
- Beaver Falls High School
- Big Beaver Area High School
- Blackhawk High School
- Central Valley High School
- Freedom Area High School
- Hopewell High School
- Lincoln Park Performing Arts Charter School
- New Brighton High School
- Quigley Catholic High School
- Riverside High School
- Rochester Area High School
- South Side Beaver High School
- Western Beaver High School
Charter schools
As reported by the Pennsylvania Department of Education – EdNA, as of April 2010.
- Baden Academy Charter School[31]
- Lincoln Park Performing Arts Charter School
- Pennsylvania Cyber Charter School
Private schools
As reported by the Pennsylvania Department of Education – EdNA, as of April 2010.
- Agapeland Children Garden – Beaver
- Beaver County Christian School -Upper – Beaver Falls
- Beaver Co Christian -West Park Elementary – Beaver Falls
- Bethel Christian School – Aliquippa
- Deliverance Temple Ministries ROOTS Inc Christian Academy – Aliquippa
- Divine Mercy Academy – Beaver Falls
- Hope Christian Academy – Aliquippa
- North Hills Christian School – Baden
- Our Lady of Fatima School – Aliquippa
- Pleasant Hill Wesleyan Academy – Hookstown
- Quigley Catholic High School – Baden
- St John the Baptist School – Monaca
- Sts Peter & Paul School – Beaver
- Sylvania Hills Christian – Rochester
Former school districts
In 2009, Center Area School District and Monaca School District merged to form Central Valley School District.
Communities
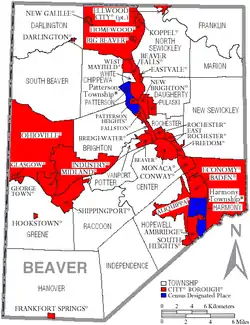
Under Pennsylvania law, there are four types of incorporated municipalities: cities, boroughs, townships, and, in at most two cases, towns. The following cities, boroughs and townships are in Beaver County:
Cities
Boroughs
- Ambridge
- Baden
- Beaver (county seat)
- Big Beaver
- Bridgewater
- Conway
- Darlington
- East Rochester
- Eastvale
- Economy
- Ellwood City (mostly in Lawrence County)
- Fallston
- Frankfort Springs
- Freedom
- Georgetown
- Glasgow
- Homewood
- Hookstown
- Industry
- Koppel
- Midland
- Monaca
- New Brighton
- New Galilee
- Ohioville
- Patterson Heights
- Rochester
- Shippingport
- South Heights
- West Mayfield
Townships
- Brighton
- Center
- Chippewa
- Darlington
- Daugherty
- First Moon (extinct)
- Franklin
- Greene
- Hanover
- Harmony
- Hopewell
- Independence
- Marion
- Moon (extinct)
- New Sewickley
- North Sewickley
- Patterson
- Potter
- Pulaski
- Raccoon
- Rochester
- Second Moon (extinct)
- Sewickley (extinct)
- South Beaver
- Vanport
- White
Census-designated places
Former community
- Borough Township – established in 1804 from the small southeast corner of South Beaver Township. In 1970, it was renamed Vanport Township.[32]
Population ranking
The population ranking of the following table is based on the 2010 census of Beaver County.[33]
† county seat
| Rank | City/town/etc. | Population (2010 Census) | Municipal type | Incorporated |
|---|---|---|---|---|
| 1 | Aliquippa | 9,438 | City | 1928 (borough) 1987 (city) |
| 2 | Beaver Falls | 8,987 | City | 1868 (borough) 1928 (city) |
| 3 | Economy | 8,970 | Borough | 1957 |
| 4 | Ellwood City (partially in Lawrence County) | 7,921 | Borough | |
| 5 | Ambridge | 7,050 | Borough | 1905 |
| 6 | New Brighton | 6,025 | Borough | 1838 |
| 7 | Monaca | 5,737 | Borough | 1840 |
| 8 | † Beaver | 4,531 | Borough | 1802 |
| 9 | Baden | 4,135 | Borough | 1868 |
| 10 | Rochester | 3,657 | Borough | 1849 |
| 11 | Ohioville | 3,533 | Borough | 1860 |
| 12 | Harmony Township | 3,197 | CDP and township | 1851 |
| 13 | Patterson Township | 3,029 | CDP and township | 1845 |
| 14 | Midland | 2,635 | Borough | 1906 |
| 15 | Conway | 2,176 | Borough | 1902 |
| 16 | Big Beaver | 1,970 | Borough | 1858 |
| 17 | Industry | 1,835 | Borough | 1960 |
| 18 | Freedom | 1,569 | Borough | 1838 |
| 19 | West Mayfield | 1,239 | Borough | 1923 |
| 20 | Koppel | 762 | Borough | 1910 |
| 21 | Bridgewater | 704 | Borough | 1835 |
| 22 | Patterson Heights | 636 | Borough | 1899 |
| 23 | East Rochester | 567 | Borough | 1908 |
| 24 | South Heights | 475 | Borough | 1910 |
| 25 | New Galilee | 379 | Borough | 1854 |
| 26 | Fallston | 266 | Borough | 1829 |
| 27 | Darlington | 254 | Borough | 1820 |
| 28 | Eastvale | 225 | Borough | 1892 |
| 29 | Shippingport | 214 | Borough | 1910 |
| 30 | Georgetown | 174 | Borough | 1850 |
| 31 | Hookstown | 147 | Borough | 1843 |
| 32 | Frankfort Springs | 130 | Borough | 1844 |
| 33 | Homewood | 109 | Borough | 1910 |
| 34 | Glasgow | 60 | Borough | 1854 |
Notable people
- Sam Adams – early explorer of the American west
- Gust Avrakotos – CIA operative active in Operation Cyclone
- Julian Michael Carver – science fiction novelist known for his usage of dinosaurs in fiction[34]
- Jim Covert – former NFL offensive tackle for the Chicago Bears, inducted into the College Football Hall of Fame in 2003
- Ed DeChellis – head men's basketball coach for The Naval Academy
- Mike Ditka – former NFL tight end for the Chicago Bears, Philadelphia Eagles and Dallas Cowboys, and head coach for the Chicago Bears and New Orleans Saints, inducted into the Pro Football Hall of Fame in 1988 (as a tight end)
- Tony Dorsett – former NFL running back for the Dallas Cowboys and Denver Broncos, inducted into both the Pro and College Football Hall of Fame in 1994
- Shane Douglas – born Troy Martin, professional wrestler, best known with Extreme Championship Wrestling, having also wrestled for World Championship Wrestling, Total Nonstop Action Wrestling, and (briefly) with the World Wrestling Federation
- Terry Francona – former Major League Baseball first baseman and outfielder for the Montreal Expos, Chicago Cubs, Cincinnati Reds, Cleveland Indians and Milwaukee Brewers, and former manager for the Philadelphia Phillies and Boston Red Sox
- Sean Gilbert – former NFL defensive lineman for the Los Angeles/St. Louis Rams, Washington Redskins, Carolina Panthers and Oakland Raiders
- Donnie Iris – musician, former member of The Jaggerz and Wild Cherry, also notable for his solo performances
- Ty Law – former NFL cornerback for the New England Patriots, New York Jets, Kansas City Chiefs and Denver Broncos
- Joe Letteri – three-time Academy Award-winning visual imaging artist, and visual effects supervisor of the movie Avatar
- Henry Mancini – music composer, including "Moon River" and "The Pink Panther Theme", among many others
- "Pistol" Pete Maravich – former NBA guard for the Atlanta Hawks, New Orleans/Utah Jazz and Boston Celtics, inducted into the Basketball Hall of Fame in 1987
- Press Maravich – former NCAA Basketball coach
- Doc Medich – former Major League Baseball pitcher for the New York Yankees, Pittsburgh Pirates, Oakland Athletics, Seattle Mariners, New York Mets, Texas Rangers and Milwaukee Brewers
- Joe Namath – former NFL and AFL quarterback for the New York Jets and Los Angeles Rams, inducted into the Pro Football Hall of Fame in 1985
- Babe Parilli – former NFL and AFL quarterback for the Green Bay Packers, Cleveland Browns, Oakland Raiders, Boston Patriots and New York Jets, former CFL quarterback for the Ottawa Rough Riders, and All-American quarterback for the University of Kentucky
- Paul Posluszny – NFL linebacker for the Jacksonville Jaguars
- Dan Radakovich – Athletics Director for the Georgia Tech Yellow Jackets
- Darrelle Revis – NFL cornerback for the New York Jets
- Jesse Steinfeld – former Surgeon General of the United States
- Pete Suder – former Major League Baseball infielder for the Philadelphia Athletics/Kansas City Athletics
- Mark Vlasic – former NFL quarterback for the San Diego Chargers, Kansas City Chiefs and Tampa Bay Buccaneers
- William Ziegler – industrialist and co-founder of the Royal Baking Powder Company
See also
References
- "PHMC Historical Markers Search" (Searchable database). Pennsylvania Historical and Museum Commission. Commonwealth of Pennsylvania. Retrieved January 25, 2014.
- "State & County QuickFacts". United States Census Bureau. Archived from the original on July 7, 2011. Retrieved November 16, 2013.
- "Find a County". National Association of Counties. Archived from the original on 2012-07-12. Retrieved 2011-06-07.
- Laws of the Commonwealth of Pennsylvania, 4 vols. (Philadelphia: John Bioren, 1810), vol. 3, pages 421–422, Chapter MMCXIX, Section 1, "An Act to erect certain parts of Allegheny, Westmoreland, Washington and Lycoming counties, into separate counties," 12 March 1800, creation of Beaver County, digital images, Google Books (https://books.google.com : 22 July 2018).
- Hoover, Gladys L. (September 18, 1974). "County Got its Name From Stream". Beaver County Times. pp. C11. Retrieved 28 April 2015.
- Joseph Henderson Bausman, History of Beaver County, Pennsylvania: And Its Centennial Celebration, 2 volumes (New York: Knickerbocker Press, 1904), vol. 2, pp. 863–864; digital images, Google Books (https://books.google.com : accessed 2 Nov 2018).
- "2010 Census Gazetteer Files". United States Census Bureau. August 22, 2012. Retrieved March 4, 2015.
- "Population and Housing Unit Estimates". Retrieved May 21, 2020.
- "U.S. Decennial Census". United States Census Bureau. Retrieved March 4, 2015.
- "Historical Census Browser". University of Virginia Library. Retrieved March 4, 2015.
- Forstall, Richard L., ed. (March 27, 1995). "Population of Counties by Decennial Census: 1900 to 1990". United States Census Bureau. Retrieved March 4, 2015.
- "Census 2000 PHC-T-4. Ranking Tables for Counties: 1990 and 2000" (PDF). United States Census Bureau. April 2, 2001. Retrieved March 4, 2015.
- "U.S. Census website". United States Census Bureau. Retrieved 2008-01-31.
- Pennsylvania Department of Health, Birth Age County Reports 1990 and 2011, 2011
- Robert Wood Johnson Foundation (2016). "Pennsylvania Teen Births 2015".
- US Census Bureau (2015). "Poverty Rates by County Small Area Income and Poverty Estimates".
- Pennsylvania Budget and Policy Center (2012). "Student Poverty Concentration 2012". Archived from the original on 2015-12-22. Retrieved 2015-12-13.
- Leip, David. "Dave Leip's Atlas of U.S. Presidential Elections". uselectionatlas.org. Retrieved 20 November 2018.
- http://geoelections.free.fr/. Retrieved January 13, 2021. Missing or empty
|title=(help) - Running for Office Archived November 26, 2008, at the Wayback Machine. Dos.state.pa.us. Retrieved on July 23, 2013.
- "2016 General Primary Results". Beaver County, Pennsylvania. May 10, 2016. Archived from the original on May 31, 2016. Retrieved May 23, 2016.
- http://www.dos.pa.gov/VotingElections/CandidatesCommittees/RunningforOffice/Documents/2017%20Election%20VR%20Stats.pdf
- "Board of Commissioners". www.beavercountypa.gov. Retrieved 2 July 2020.
- "Welcome to the Office of the Controller". www.beavercountypa.gov. Retrieved 2 July 2020.
- "Welcome to the Prothonotary Office". www.beavercountypa.gov.
- "Welcome to the Recorder of Deeds". www.beavercountypa.gov.
- "Welcome to the Treasurer's Office". www.beavercountypa.gov.
- Buttermilk Falls
- Pittsburgh Business Times
- "Baden Academy Charter School". badenacademy.org. Retrieved 20 November 2018.
- "Archived copy". Archived from the original on 2014-11-20. Retrieved 2014-12-19.CS1 maint: archived copy as title (link)
- "2010 U.S. Census website". United States Census Bureau. Retrieved February 13, 2016.
- Kelly, Joey. "Page Turners: Profiles of Beaver Valley authors". The Times. Retrieved 31 March 2020.
External links
| Wikimedia Commons has media related to Beaver County, Pennsylvania. |
Places adjacent to Beaver County, Pennsylvania | ||||||||||
|---|---|---|---|---|---|---|---|---|---|---|
| ||||||||||
Municipalities and communities of Beaver County, Pennsylvania, United States | ||
|---|---|---|
| Cities | | |
| Boroughs |
| |
| Townships | ||
| Census-designated places | ||
| Other unincorporated communities | ||
| Footnotes | ‡This populated place also has portions in an adjacent county or counties. | |
| ||
| Counties | 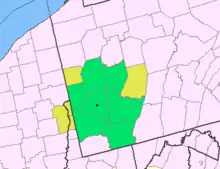 Map of the Pittsburgh Tri-State with green counties in the metropolitan area and yellow counties in the combined area | |
|---|---|---|
| Major cities | ||
| Cities and towns 15k–50k (in 2010) | ||
| Airports | ||
| Topics | ||
| ||
| Authority control |
|---|