Pulaski County, Indiana
Pulaski County (/pʊˈlæskaɪ/ pəˈlæ.ski) is a county located in the U.S. state of Indiana. According to the 2010 U.S. census, the population was 13,402.[3] The county seat is Winamac.[4]
Pulaski County, Indiana | |
|---|---|
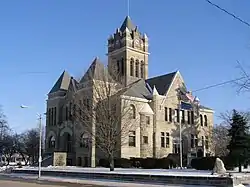 Pulaski County Courthouse in Winamac | |
 Location in the state of Indiana | |
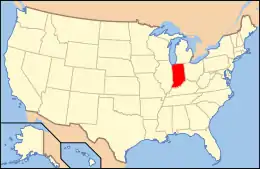 Indiana's location in the U.S. | |
| Coordinates: 41°02′N 86°41′W | |
| Country | |
| State | |
| Established | February 7, 1835 |
| Named for | Count Casimir Pulaski |
| County seat | Winamac |
| Largest town | Winamac (population and total area) |
| Incorporated Municipalities | Four towns
|
| Government | |
| • Type | County |
| • Body | Board of Commissioners |
| • Commissioner | Kenneth R. “Kenny” Becker |
| • Commissioner | Jerome C. “Jerry” Locke |
| • Commissioner | John M. “Mike” McClure |
| Area | |
| • Total | 434.53 sq mi (1,125.4 km2) |
| • Land | 433.65 sq mi (1,123.1 km2) |
| • Water | 0.88 sq mi (2.3 km2) |
| Area rank | 25th largest county in Indiana |
| Elevation | 705 ft (215 m) |
| Population (2010) | |
| • Total | 13,402 |
| • Estimate (2018) | 12,469 |
| • Rank | 84th largest county in Indiana 2,237th largest county in U.S.[1] |
| • Density | 30.9/sq mi (11.9/km2) |
| Time zone | UTC-5 (Eastern) |
| • Summer (DST) | UTC-4 (Eastern) |
| ZIP Codes | 46366, 46374, 46511, 46939, 46960, 46978, 46985, 46996, 47946, 47957, 47959-60 |
| Area code | 574 |
| Congressional district | 2nd |
| Indiana Senate districts | 5th and 18th |
| Indiana House of Representatives districts | 16th and 20th |
| FIPS code | 18-131 |
| GNIS feature ID | 0446852 |
| U.S. and State Routes | |
| Airport | Arens Field
|
| Waterway | Tippecanoe River |
| Website | www.pulaskionline.org |
| |
| Demographics (2010)[2] | |||
|---|---|---|---|
| White | Black | Asian | |
| 97.2% | 0.7% | 0.2% | |
| Islander | Native | Other | Hispanic (any race) |
| 0.0% | 0.3% | 1.6% | 2.4% |
History
Pulaski County was organized in 1835.[5]
Geography
According to the 2010 census, the county has a total area of 434.53 square miles (1,125.4 km2), of which 433.65 square miles (1,123.1 km2) (or 99.80%) is land and 0.88 square miles (2.3 km2) (or 0.20%) is water.[6]
Major highways
Railroads
Adjacent counties
- Starke County (north)
- Marshall County (northeast)
- Fulton County (east)
- Cass County (southeast)
- White County (south)
- Jasper County (west)
Municipalities
Towns
The municipalities in Pulaski County, and their populations as of the 2010 Census, are:
- Francesville – 879
- Medaryville – 614
- Monterey – 218
- Winamac – 2,490
Census-designated places
- Star City – 377
Other unincorporated places
Townships
The 12 townships of Pulaski County, with their populations as of the 2010 Census, are:
- Beaver – 516
- Cass – 878
- Franklin – 715
- Harrison – 628
- Indian Creek – 691
- Jefferson – 545
- Monroe – 4,019
- Rich Grove – 921
- Salem – 1,399
- Tippecanoe – 1,104
- Van Buren – 911
- White Post – 1,075
Education
Public schools in Pulaski County are administered by four districts:
- Eastern Pulaski Community Schools
- West Central School Corporation
- Culver Community Schools
- North Judson-San Pierre Schools
High Schools
- Winamac Community High School
- West Central High School
Middle Schools
- Winamac Community Middle School
- West Central Middle School
Elementary Schools
- Eastern Pulaski Elementary School
- West Central Elementary School
Hospitals
- Pulaski Memorial Hospital, Winamac – 25 beds
Climate and weather
| Winamac, Indiana | ||||||||||||||||||||||||||||||||||||||||||||||||||||||||||||
|---|---|---|---|---|---|---|---|---|---|---|---|---|---|---|---|---|---|---|---|---|---|---|---|---|---|---|---|---|---|---|---|---|---|---|---|---|---|---|---|---|---|---|---|---|---|---|---|---|---|---|---|---|---|---|---|---|---|---|---|---|
| Climate chart (explanation) | ||||||||||||||||||||||||||||||||||||||||||||||||||||||||||||
| ||||||||||||||||||||||||||||||||||||||||||||||||||||||||||||
| ||||||||||||||||||||||||||||||||||||||||||||||||||||||||||||
In recent years, average temperatures in Winamac have ranged from a low of 14 °F (−10 °C) in January to a high of 84 °F (29 °C) in July, although a record low of −29 °F (−34 °C) was recorded in January 1985 and a record high of 102 °F (39 °C) was recorded in June 1988. Average monthly precipitation ranged from 1.68 inches (43 mm) in February to 4.09 inches (104 mm) in June.[7]
Government
The county government is a constitutional body, and is granted specific powers by the Constitution of Indiana, and by the Indiana Code.
County Council: The county council is the fiscal-legislative branch of the county government and controls all the spending and revenue collection in the county. Four members are elected from county districts, and three are elected at-large. The council members serve four-year terms. They are responsible for setting salaries, the annual budget, and special spending. The council also has limited authority to impose local taxes, in the form of an income and property tax that is subject to state level approval, excise taxes, and service taxes.[8][9]
Board of Commissioners: The executive-legislative body of the county is the board of commissioners. The commissioners represent geographic districts, but are elected county-wide, in staggered terms, and each serves a four-year term. One of the commissioners, typically the most senior, serves as president. The commissioners are charged with adopting and executing legislation, collecting revenue, and managing the day-to-day functions of the county government.[8][9]
Court: The county maintains a small claims court that can handle some civil cases. The judge on the court is elected to a term of four years and must be a member of the Indiana Bar Association. In some cases, court decisions can be appealed to the state level circuit court.[9]
County Officials: The county has several other elected offices, including sheriff, coroner, auditor, treasurer, recorder, surveyor, and circuit court clerk Each of these elected officers serves a term of four years and oversees a different part of county government. Members elected to county government positions are required to declare party affiliations and to be residents of the county.[9]
Pulaski County is part of Indiana's 2nd congressional district and in 2016 was represented by Jackie Walorski in the United States Congress.[10]
| Year | Republican | Democratic | Third parties |
|---|---|---|---|
| 2016 | 70.6% 3,854 | 24.3% 1,327 | 5.1% 278 |
| 2012 | 62.3% 3,366 | 35.2% 1,899 | 2.5% 134 |
| 2008 | 56.8% 3,388 | 41.4% 2,466 | 1.8% 110 |
| 2004 | 67.6% 3,797 | 31.2% 1,750 | 1.2% 67 |
| 2000 | 63.4% 3,497 | 34.8% 1,919 | 1.9% 102 |
| 1996 | 50.0% 2,693 | 37.3% 2,010 | 12.8% 688 |
| 1992 | 45.8% 2,712 | 33.0% 1,950 | 21.2% 1,254 |
| 1988 | 62.1% 3,677 | 37.4% 2,213 | 0.5% 27 |
| 1984 | 66.9% 4,167 | 32.3% 2,008 | 0.8% 51 |
| 1980 | 62.1% 3,916 | 33.2% 2,092 | 4.8% 302 |
| 1976 | 54.2% 3,586 | 42.5% 2,813 | 3.3% 216 |
| 1972 | 69.0% 4,243 | 30.3% 1,863 | 0.7% 40 |
| 1968 | 54.8% 3,361 | 33.8% 2,071 | 11.4% 701 |
| 1964 | 48.3% 3,202 | 51.4% 3,408 | 0.4% 24 |
| 1960 | 57.7% 3,905 | 40.6% 2,746 | 1.8% 120 |
| 1956 | 62.1% 4,117 | 36.5% 2,424 | 1.4% 92 |
| 1952 | 63.1% 4,030 | 35.1% 2,244 | 1.8% 113 |
| 1948 | 50.7% 3,039 | 45.7% 2,736 | 3.6% 217 |
| 1944 | 55.0% 3,206 | 43.1% 2,509 | 1.9% 111 |
| 1940 | 52.7% 3,472 | 45.9% 3,021 | 1.4% 95 |
| 1936 | 45.4% 2,780 | 53.5% 3,274 | 1.1% 66 |
| 1932 | 39.5% 2,226 | 58.3% 3,286 | 2.3% 129 |
| 1928 | 56.4% 2,738 | 42.0% 2,040 | 1.5% 74 |
| 1924 | 55.0% 2,725 | 39.4% 1,953 | 5.5% 274 |
| 1920 | 53.9% 2,740 | 43.8% 2,228 | 2.3% 117 |
| 1916 | 46.8% 1,474 | 44.0% 1,387 | 9.2% 289 |
| 1912 | 24.8% 729 | 42.6% 1,250 | 32.6% 957 |
| 1908 | 44.3% 1,561 | 52.0% 1,832 | 3.7% 130 |
| 1904 | 48.6% 1,729 | 46.3% 1,648 | 5.1% 180 |
| 1900 | 42.5% 1,501 | 54.1% 1,909 | 3.4% 119 |
| 1896 | 40.0% 1,345 | 58.4% 1,964 | 1.7% 56 |
| 1892 | 36.8% 986 | 50.5% 1,352 | 12.7% 341 |
| 1888 | 45.0% 1,223 | 53.1% 1,446 | 1.9% 52 |
Demographics
| Historical population | |||
|---|---|---|---|
| Census | Pop. | %± | |
| 1840 | 561 | — | |
| 1850 | 2,595 | 362.6% | |
| 1860 | 5,711 | 120.1% | |
| 1870 | 7,801 | 36.6% | |
| 1880 | 9,851 | 26.3% | |
| 1890 | 11,233 | 14.0% | |
| 1900 | 14,033 | 24.9% | |
| 1910 | 13,312 | −5.1% | |
| 1920 | 12,385 | −7.0% | |
| 1930 | 11,195 | −9.6% | |
| 1940 | 12,056 | 7.7% | |
| 1950 | 12,493 | 3.6% | |
| 1960 | 12,837 | 2.8% | |
| 1970 | 12,534 | −2.4% | |
| 1980 | 13,258 | 5.8% | |
| 1990 | 12,643 | −4.6% | |
| 2000 | 13,755 | 8.8% | |
| 2010 | 13,402 | −2.6% | |
| 2018 (est.) | 12,469 | [12] | −7.0% |
| U.S. Decennial Census[13] 1790-1960[14] 1900-1990[15] 1990-2000[16] 2010-2013[3] | |||
As of the 2010 United States Census, there were 13,402 people, 5,282 households, and 3,707 families residing in the county.[17] The population density was 30.9 inhabitants per square mile (11.9/km2). There were 6,060 housing units at an average density of 14.0 per square mile (5.4/km2).[6] The racial makeup of the county was 97.2% white, 0.7% black or African American, 0.3% American Indian, 0.2% Asian, 0.6% from other races, and 1.0% from two or more races. Those of Hispanic or Latino origin made up 2.4% of the population.[17] In terms of ancestry, 32.4% were German, 12.2% were Irish, 8.6% were English, and 8.2% were American.[18]
Of the 5,282 households, 31.5% had children under the age of 18 living with them, 55.6% were married couples living together, 9.0% had a female householder with no husband present, 29.8% were non-families, and 25.6% of all households were made up of individuals. The average household size was 2.50 and the average family size was 2.97. The median age was 41.7 years.[17]
The median income for a household in the county was $47,697 and the median income for a family was $50,903. Males had a median income of $43,624 versus $27,131 for females. The per capita income for the county was $20,491. About 13.4% of families and 17.2% of the population were below the poverty line, including 28.5% of those under age 18 and 8.3% of those age 65 or over.[19]
See also
References
- "USA Counties in Profile". STATS Indiana. Retrieved 2014-06-29.
- U.S. Census Bureau. American Community Survey, Profile of General Population and Housing Characteristics 2010, Table DP-1, 2010 Demographic Profile Data. U.S. Census website. Retrieved 2014-06-29.
- "Pulaski County QuickFacts". United States Census Bureau. Archived from the original on 2015-09-05. Retrieved 2011-09-25.
- "Find a County". National Association of Counties. Retrieved 2011-06-07.
- "Pulaski County, Indiana". Find a County. National Association of Counties. Retrieved 2014-07-14.
- "Population, Housing Units, Area, and Density: 2010 - County". United States Census Bureau. Archived from the original on 2020-02-12. Retrieved 2015-07-10.
- "Monthly Averages for Winamac, Indiana". The Weather Channel. Retrieved 2011-01-27.
- Indiana Code. "Title 36, Article 2, Section 3". IN.gov. Retrieved 2008-09-16.
- Indiana Code. "Title 2, Article 10, Section 2" (PDF). IN.gov. Retrieved 2008-09-16.
- walorski.house.gov
- Leip, David. "Dave Leip's Atlas of U.S. Presidential Elections". uselectionatlas.org. Retrieved 2018-05-19.
- "Population and Housing Unit Estimates". Retrieved July 26, 2019.
- "U.S. Decennial Census". United States Census Bureau. Retrieved July 10, 2014.
- "Historical Census Browser". University of Virginia Library. Retrieved July 10, 2014.
- "Population of Counties by Decennial Census: 1900 to 1990". United States Census Bureau. Retrieved July 10, 2014.
- "Census 2000 PHC-T-4. Ranking Tables for Counties: 1990 and 2000" (PDF). United States Census Bureau. Retrieved July 10, 2014.
- "DP-1 Profile of General Population and Housing Characteristics: 2010 Demographic Profile Data". United States Census Bureau. Archived from the original on 2020-02-13. Retrieved 2015-07-10.
- "DP02 SELECTED SOCIAL CHARACTERISTICS IN THE UNITED STATES – 2006-2010 American Community Survey 5-Year Estimates". United States Census Bureau. Archived from the original on 2020-02-14. Retrieved 2015-07-10.
- "DP03 SELECTED ECONOMIC CHARACTERISTICS – 2006-2010 American Community Survey 5-Year Estimates". United States Census Bureau. Archived from the original on 2020-02-14. Retrieved 2015-07-10.
External links
- Pulaski County official website
- Eastern Pulaski Community Schools
- West Central School Corporation
- Culver Community Schools
- North Judson-San Pierre Schools
Places adjacent to Pulaski County, Indiana | ||||||||||
|---|---|---|---|---|---|---|---|---|---|---|
| ||||||||||
Municipalities and communities of Pulaski County, Indiana, United States | ||
|---|---|---|
| Towns | Map of Indiana highlighting Pulaski County | |
| Townships | ||
| CDP | ||
| Other unincorporated communities | ||
| ||

| Authority control |
|---|