Lake County, Indiana
Lake County is a county located in the U.S. state of Indiana. In 2010, its population was 496,005,[10] making it Indiana's second-most populous county. The county seat is Crown Point.[11]
Lake County, Indiana | |
|---|---|
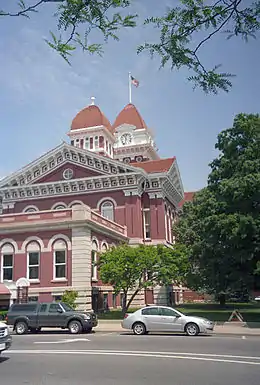 Former Lake County Courthouse in Crown Point, Indiana | |
 Seal | |
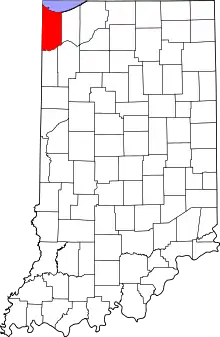 Location in the state of Indiana | |
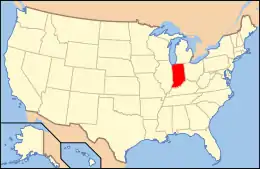 Indiana's location in the U.S. | |
| Coordinates: 41°25′N 87°22′W | |
| Country | |
| State | |
| Region | Northwest Indiana |
| Metro area | Chicago Metropolitan |
| Settled | October 1834[1] |
| Established | February 16, 1837[2] |
| Named for | Lake Michigan |
| County seat | Crown Point |
| Largest city | Gary (total area) |
| Incorporated municipalities | 19 cities and towns
|
| Government | |
| • Type | County |
| • Body | Board of Commissioners |
| • Commissioner | Kyle W. Allen, Sr. (D, 1st) |
| • Commissioner | Jerry J. Tippy (R, 2nd) |
| • Commissioner | Michael C. Repay (D, 3rd) |
| • County Council | |
| Area | |
| • County | 626.5 sq mi (1,623 km2) |
| • Land | 498.9 sq mi (1,292 km2) |
| • Water | 127.6 sq mi (330 km2) |
| • Metro | 10,874 sq mi (28,160 km2) |
| Area rank | 12th largest county in Indiana |
| • Region | 2,726 sq mi (7,060 km2) |
| Dimensions | |
| • Length | 36 mi (58 km) |
| • Width | 16 mi (26 km) |
| Elevation [5] (mean) | 663 ft (202 m) |
| Highest elevation [6] – NE Winfield Twp | 801 ft (244 m) |
| Lowest elevation [7] – at Lake Michigan | 585 ft (178 m) |
| Population (2010) | |
| • County | 496,005 |
| • Estimate (2019) | 485,493 |
| • Rank | 2nd largest county in Indiana 131st largest county in U.S.[8] |
| • Density | 994/sq mi (384/km2) |
| • Metro | 9,522,434 |
| • Region | 819,537 |
| Time zone | UTC−6 (Central) |
| • Summer (DST) | UTC−5 (Central) |
| ZIP Codes | 46303, 46307-08, 46311-12, 46319-25, 46327, 46341-42, 46355-56, 46373, 46375-77, 46394, 46401-11 |
| Area code | 219 |
| Congressional district | 1st |
| Indiana Senate districts | 1st, 2nd, 3rd and 6th |
| Indiana House of Representatives districts | 1st, 2nd, 3rd, 11th, 12th, 14th, 15th and 19th |
| FIPS code | 18-089 |
| GNIS feature ID | 0450495 |
| Interstates | |
| U.S. Routes | |
| State Routes | |
| Airports | Gary/Chicago International Griffith-Merrillville |
| Waterways | Grand Calumet River Indiana Harbor and Ship Canal Kankakee River Lake Michigan |
| Amtrak stations | Dyer – Hammond-Whiting
|
| South Shore Line stations | Hammond – East Chicago Adam Benjamin Metro Center Gary/Chicago Airport – Miller |
| Public transit | East Chicago Transit Gary Public Transportation |
| Website | www.lakecountyin.org |
| |
| Demographics (2010)[9] | |||
|---|---|---|---|
| White | Black | Asian | |
| 64.4% | 25.9% | 1.2% | |
| Islander | Native | Other | Hispanic (any race) |
| 0.0% | 0.3% | 8.2% | 16.7% |
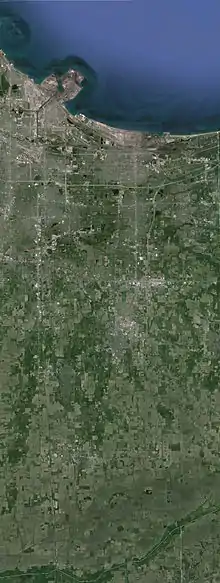
This county is part of Northwest Indiana and the Chicago metropolitan area, and contains a mix of urban, suburban and rural areas.
It is the home to a portion of the Indiana Dunes[12][13] and to Marktown, Clayton Mark's planned worker community in East Chicago.[14]
History
Early settlement
Originally inhabited by Potawatomi tribes, Lake County was established on February 16, 1837.[2] From 1832 to 1836 the area that was to become Lake County was part of La Porte County.[15] From 1836 to 1837 it was part of Porter County.[15] It was named for its location on Lake Michigan.[16] The original county seat was Liverpool until Lake Court House, which later became Crown Point, was chosen in 1840.[17] Lake County's population grew slowly before the 1850s, when the railroads arrived to link Chicago to the rest of the country, and enabled tens of thousands of settlers and immigrants to buy land. Small-scale industrialization began, but was primarily relegated to the northern coast of the county. The 1900 Census gives a population of 37,892 residents.
Industrialization and immigration
The arrival of Inland Steel Company to East Chicago in 1903 and U.S. Steel to Gary in 1906 jump-started the county's population explosion. Immigrants poured into the area from all over Central and Eastern Europe (supplemented by a small Mexican immigrant community) and from many regions of the United States, such as Appalachia and the South. By 1930, Lake County's population surpassed 260,000, with first- and second-generation Americans constituting a majority of the population. Like the rest of Indiana, the Ku Klux Klan gained a large following in the 1920s in response to changing demographics. While the steel industry reigned supreme, other industries also found the county to be an ideal location for cheap land and well-developed transportation networks, such as automobiles, oil, chemicals, consumer goods, food processing, and construction supply companies.[18]
The Great Depression was devastating to Lake County, as it was to any other area that relied on heavy industry. The Depression, combined with industrial strife, changing demographics, and unionization, caused Lake County to become a stronghold of the Democratic Party; Lake County has supported the Democratic nominee for President in every election since 1932 (exceptions occurred in 1956 and 1972), and Indiana's 1st Congressional District has remained in the Democratic column in every election since 1930. World War II restored prosperity, as industry revived to support the war effort, and good economic times continued into the 1970s. More immigrants were attracted by the promise of middle-class industrial jobs, and in addition to refugees and immigrants from Europe, black Americans and Mexicans also arrived in even larger numbers than they had in the 1910-1930 period. As minority populations exploded in industrial cities like East Chicago and Gary, racial tensions surfaced once again, and white flight from the industrial cities took place, aided in large part by the construction of state and federal highways.[18]
Recent history
Lake County's population peaked at 546,000 in 1970. Severe industrial decline took place during the 1973-1991 period, brought on by foreign competition, new management philosophies that called for major workforce reductions, and productivity gains from technology. The decline was particularly intense in the steel industry: steel employment exceeded 60,000 in the 1960s, and declined progressively to just 18,000 by 2015. Lake County's population declined 13% to bottom out at 475,000 in 1990.
The industrial decline of the 1980s cast a long shadow over Lake County: the county did not regain the level of employment it had in 1980 until 1996, after which the employment level roughly flatlined. The county's economic output peaked in 1978, and has not since recovered, remaining 15-20% below the peak after adjusting for inflation. As prosperity declined, so did the immigration that powered the county's explosive population growth before 1950: per the 2000 census, only 5.3% of Lake County's residents were foreign-born, compared to over 11% for the United States as a whole.[19]
The population recovered somewhat during the 1990s and 2000s, as the local economy adjusted. Suburban growth has also been driven by commuter populations of workers who are employed in Chicago and commute via expressways or the South Shore Line. In 2007, it was estimated that 44,000 workers commuted from Lake County, Indiana, to Chicago for work.[19] The decline of industrial cities and growth of suburbs has been so sharp, that by 1990 a majority of the County's population lived outside of the four traditional industrial cities. Lake County still continues to struggle with urban decline and poverty, suburban sprawl and traffic jams, and a stagnating population.[18]
Geography
According to the 2010 census, the county has a total area of 626.56 square miles (1,622.8 km2), of which 498.96 square miles (1,292.3 km2) (or 79.63%) is land and 127.60 square miles (330.5 km2) (or 20.37%) is water.[20]
The northern and southern portions of the county (north of U.S. 30 and south of Lowell) are mainly low and flat, except for a few sand ridges and dunes and were both once very marshy and had to be drained. The lowest point, at 585 feet (178 m),[7] is along the Lake Michigan shoreline.
The central part of the county is higher and hillier. As you travel south from the low and relatively flat lake plain in the northern part of the county, the land gradually rises in elevation until the peak of the Valparaiso Moraine. The highest point, at 801 feet (244 m),[6] is in northeastern Winfield Township near 109th Street and North Lakeshore Drive in Lakes of the Four Seasons. From here the land descends south into the Kankakee Outwash Plain until the Kankakee River is reached.
The geographic center of Lake County is approximately 200 feet (61 m) northwest of Burr Street and West 113th Avenue in Center Township 41°24′53.8″N 87°24′14.3″W.
National protected area
- Indiana Dunes National Park – also in LaPorte and Porter counties
Major highways
Interstate 65 in Lake County is called the Casimir Pulaski Memorial Highway. Interstate 80/94/US 6 is the Frank Borman Expressway from the Illinois state line east to the Indiana Toll Road interchange in the eastern portion of the county. Interstate 94 has been referred to as the Chicago-Detroit Industrial Freeway. US 6 is part of the Grand Army of the Republic Highway. Broadway (Indiana 53) is also the Carolyn Mosby Memorial Highway. Indiana 51 is known for its entire length as the Adam Benjamin Memorial Highway. US 30 is part of the historic Lincoln Highway. US 12 from Gary eastward is part of Dunes Highway. Cline Avenue (Indiana 912) from US 12 north and westward is known as the Highway Construction Workers Memorial Highway.
Railroads
Adjacent counties
- Cook County, Illinois (northwest)
- Will County, Illinois (west)
- Kankakee County, Illinois (southwest)
- Porter County (east)
- Jasper County (southeast)
- Newton County (south)
Municipalities
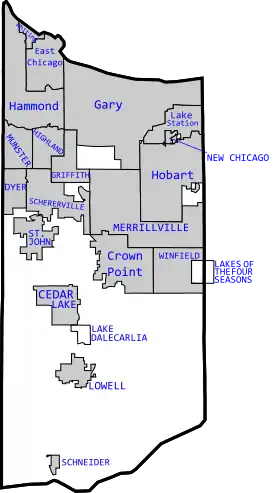
The municipalities in Lake County, and their populations as of the 2010 Census, are:
Cities
- Crown Point – 27,317
- East Chicago – 29,698
- Gary – 80,294
- Hammond – 80,830
- Hobart – 29,059
- Lake Station – 12,572
- Whiting – 4,997
Towns
- Cedar Lake – 11,560
- Dyer – 16,390
- Griffith – 16,893
- Highland – 23,727
- Lowell – 9,276
- Merrillville – 35,246
- Munster – 23,603
- New Chicago – 2,035
- Schererville – 29,243
- Schneider – 277
- St. John – 14,850
- Winfield – 4,383
Census-designated places
- Lake Dalecarlia – 1,355
- Lakes of the Four Seasons – 3,936
(7,033 including portion in Porter County) - Shelby – 539
Unincorporated communities
Townships
The 11 townships of Lake County, with their populations as of the 2010 Census, are:
- Calumet – 104,258
- Cedar Creek – 12,097
- Center – 31,756
- Eagle Creek – 1,668
- Hanover – 12,443
- Hobart – 39,417
- North – 162,855
- Ross – 47,890
- St. John – 66,741
- West Creek – 6,826
- Winfield – 10,054
Economy
Despite the decline of heavy industry, manufacturing was still the largest employment sector in Lake County in 2010 with over 45,000 workers employed, followed closely by healthcare and social assistance at 44,000 workers, public administration at 40,000 workers, retail trade at 37,000 workers, accommodation and food services at 25,000 workers, and construction at 15,000 workers.[19]
Lake County's GDP in 2010 was measured at nearly $25 billion. Manufacturing was also the largest sector of the economy in economic terms, contributing over $5.8 billion to the county's GDP in 2010. It was followed by healthcare and social assistance at $2.6 billion, public administration at $2.5 billion, and retail trade at $1.9 billion. While Lake County's average income was approximately 24% higher than the national average in 1978, in 2010 Lake County had fallen significantly behind the United States as a whole, with average income being approximately 12.9% lower. The national average surpassed Lake County sometime around 1986.
Businesses with the largest number of employees in the county are: [21]
- Americall Group, Inc. – Hobart
- Ameristar Casino – East Chicago
- ArcelorMittal – East Chicago
- BP Whiting Refinery – Whiting
- Canadian National Railway – Whiting
- Cargill – Hammond
- Community Hospital – Munster
- Franciscan Alliance, Inc. – locations throughout the region
- Franciscan Health Hammond – Hammond
- Horseshoe Casino – Hammond
- Majestic Star Casino – Gary
- Methodist Hospitals Northlake Campus – Merrillville
- NiSource – Merrillville
- Radisson Hotel at Star Plaza – Merrillville (closed)
- St. Catherine Hospital – East Chicago
- St. Mary Medical Center – Hobart
- Times Media Company – Munster
- Unilever – Whiting
- U.S. Steel Gary Works – Gary
Education
Public school districts
The administration of public schools in Lake County is divided among 16 corporations and governing bodies, more than any other Indiana county.[22]
- Crown Point Community School Corporation – Center and Winfield townships
- Gary Community School Corporation – City of Gary
- Griffith Public Schools – Town of Griffith
- Hanover Community School Corporation – Hanover Township
- Lake Central School Corporation – St. John Township
- Lake Ridge Schools Corporation – unincorporated Calumet Township
- Lake Station Community Schools – City of Lake Station
- Merrillville Community School Corporation – Ross Township
- River Forest Community School Corporation – Town of New Chicago and some portions of adjacent communities
- School City of East Chicago – City of East Chicago
- School City of Hammond – City of Hammond
- School City of Hobart – City of Hobart within Hobart Township
- School City of Whiting – City of Whiting
- School Town of Highland – Town of Highland
- School Town of Munster – Town of Munster
- Tri-Creek School Corporation – Cedar Creek, Eagle Creek and West Creek townships
Private schools
Elementary and secondary schools operated by the Diocese of Gary:
- Andrean High School, Merrillville (9–12)
- Aquinas School at St. Andrew's, Merrillville (PK–8)
- Bishop Noll Institute, Hammond (9–12)
- Our Lady of Grace, Highland (PK–8)
- St. Casimir, Hammond (PK–8)
- St. John Bosco, Hammond (PK–8)
- St. John the Baptist, Whiting (PK–8)
- St. John the Evangelist, St. John (PK–8)
- St. Mary, Crown Point (PK–8)
- St. Mary, Griffith (PK–8)
- St. Michael, Schererville (PK–8)
- St. Stanislaus, East Chicago (PK–8)
- St. Thomas More, Munster (PK–8)
Other parochial and private schools:
- St. Paul's Lutheran School, Munster (PK–8)
- Trinity Lutheran School, Crown Point (PK–8)
- Trinity Lutheran School, Hobart (PK–8)
Public libraries
The county is served by seven different public library systems:
- Crown Point Community Library has its main location with a branch in Winfield.[24]
- East Chicago Public Library has its main location and the Robart A. Pastrick branch.[25]
- Gary Public Library has its main location, the Du Bois Library, as well as the Brunswick, Kennedy and Woodson branches.[26]
- Hammond Public Library[27]
- Lake County Public Library has its main location in Merrillville as well as Cedar Lake, Dyer-Schererville, Griffith-Calumet Township, Highland, Hobart, Lake Station-New Chicago, Munster and St. John branches.[28]
- Lowell Public Library has its main location with branches in Schneider and Shelby.[29]
- Whiting Public Library[30]
Hospitals
- Community Hospital, Munster – 458 beds[31]
- Franciscan Health Crown Point, Crown Point – 236 beds (Level III adult trauma center)[31][32][33][34][35]
- Franciscan Health Dyer, Dyer – 198 beds[31][32]
- Franciscan Health Hammond, Hammond – 215 beds[31][32]
- Franciscan Health Munster, Munster – 63 beds[31][32]
- Methodist Hospitals – 536 beds[31]
- St. Catherine Hospital, East Chicago – 189 beds[31]
- St. Mary Medical Center, Hobart – 215 beds[31]
Media
The Times, based in Munster, is the largest daily newspaper in Lake County and Northwest Indiana and the second largest in the state. Lake County is also served by the Post-Tribune, a daily newspaper based in Merrillville.
Lakeshore Public Television operates WYIN-TV Gary on channel 56 and is the local PBS station in the Chicago television market.
These eight broadcast radio stations serve Lake County and are part of the Chicago market:
Climate and weather
| Climate data for Lowell, Indiana (1981-2010 normals, extremes 1963-present) | |||||||||||||
|---|---|---|---|---|---|---|---|---|---|---|---|---|---|
| Month | Jan | Feb | Mar | Apr | May | Jun | Jul | Aug | Sep | Oct | Nov | Dec | Year |
| Record high °F (°C) | 66 (19) |
73 (23) |
85 (29) |
91 (33) |
95 (35) |
104 (40) |
101 (38) |
104 (40) |
98 (37) |
92 (33) |
77 (25) |
70 (21) |
104 (40) |
| Average high °F (°C) | 31.2 (−0.4) |
35.8 (2.1) |
47.5 (8.6) |
60.8 (16.0) |
71.3 (21.8) |
80.7 (27.1) |
83.8 (28.8) |
82.0 (27.8) |
76.4 (24.7) |
63.6 (17.6) |
49.4 (9.7) |
35.1 (1.7) |
59.8 (15.5) |
| Daily mean °F (°C) | 22.8 (−5.1) |
26.7 (−2.9) |
37.4 (3.0) |
49.3 (9.6) |
59.8 (15.4) |
69.7 (20.9) |
73.1 (22.8) |
71.1 (21.7) |
64.2 (17.9) |
51.9 (11.1) |
40.2 (4.6) |
27.1 (−2.7) |
49.4 (9.7) |
| Average low °F (°C) | 14.4 (−9.8) |
17.7 (−7.9) |
27.4 (−2.6) |
37.9 (3.3) |
48.2 (9.0) |
58.7 (14.8) |
62.4 (16.9) |
60.3 (15.7) |
52.0 (11.1) |
40.2 (4.6) |
31.0 (−0.6) |
19.1 (−7.2) |
39.1 (3.9) |
| Record low °F (°C) | −28 (−33) |
−23 (−31) |
−9 (−23) |
7 (−14) |
26 (−3) |
33 (1) |
41 (5) |
38 (3) |
28 (−2) |
18 (−8) |
2 (−17) |
−29 (−34) |
−29 (−34) |
| Average precipitation inches (mm) | 1.96 (50) |
1.75 (44) |
2.57 (65) |
3.78 (96) |
4.38 (111) |
4.69 (119) |
4 (100) |
3.98 (101) |
3.14 (80) |
3.44 (87) |
3.43 (87) |
2.34 (59) |
39.46 (999) |
| Average snowfall inches (cm) | 8.8 (22) |
8.2 (21) |
3.4 (8.6) |
0.3 (0.76) |
0 (0) |
0 (0) |
0 (0) |
0 (0) |
0 (0) |
0.2 (0.51) |
0.7 (1.8) |
7.7 (20) |
29.3 (74.67) |
| Source: NOAA (normals, 1981–2010)[37] | |||||||||||||
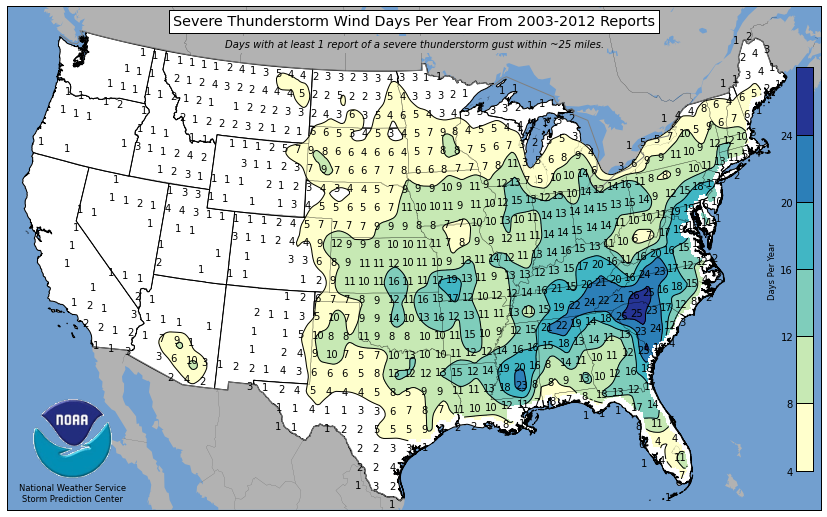
In recent years, average temperatures in Lowell have ranged from a low of 14.4 °F (−9.8 °C) in January to a high of 83.8 °F (28.8 °C) in July, although a record low of −29 °F (−34 °C) was recorded in December 1989 and a record high of 104 °F (40 °C) was recorded in June 1988. Average monthly precipitation ranged from 1.75 inches (44 mm) in February to 4.69 inches (119 mm) in June. Temperatures at or below 0 °F (−18 °C) occur on average 11 days annually and exceed 90 °F (32 °C) degrees on 14 days.[37] In winter, lake-effect snow increases snowfall totals compared to the areas to the west.[38] In spring and early summer, the immediate shoreline areas sometimes experience lake-breeze that can drop temperatures by several degrees compared to areas further inland.[39] In summer, thunderstorms are common, occurring an average 40–50 days every year,[40] and on about 13 days, these thunderstorms produce severe winds.[41]
Government
The county government is a constitutional body, and is granted specific powers by the Constitution of Indiana, and by the Indiana Code.
County Council: The county council is the legislative branch of the county government and controls all the spending and revenue collection in the county. Representatives are elected from county districts. The council members serve four-year terms. They are responsible for setting salaries, the annual budget, and special spending. The council also has limited authority to impose local taxes, in the form of an income and property tax that is subject to state level approval, excise taxes, and service taxes.[42][43]
Board of Commissioners: The executive body of the county is made of a board of commissioners. The commissioners are elected county-wide, in staggered terms, and each serves a four-year term. One of the commissioners, typically the most senior, serves as president. The commissioners are charged with executing the acts legislated by the council, collecting revenue, and managing the day-to-day functions of the county government.[42][43]
Court: The county maintains a small claims court that can handle some civil cases. The judge on the court is elected to a term of four years and must be a member of the Indiana Bar Association. The judge is assisted by a constable who is also elected to a four-year term. In some cases, court decisions can be appealed to the state level circuit court.[43]
County Officials: The county has several other elected offices, including sheriff, coroner, auditor, treasurer, recorder, surveyor, and circuit court clerk Each of these elected officers serves a term of four years and oversees a different part of county government. Members elected to county government positions are required to declare party affiliations and to be residents of the county.[43]
County elected officials
|
† President |
Politics
While the state of Indiana is strongly Republican having voting Republican in every election since 1964 (except in 2008) Lake County has long been a Democratic stronghold, giving pluralities or majorities to Democrats in every Presidential election since 1932 with the exceptions of 1956 and 1972.
Lake is part of Indiana's 1st congressional district, which is held by Democrat Frank J. Mrvan.[45] In the State Senate, Lake is part of the 1st, 2nd, 3rd and 6th districts, which are held by three Democrats and one Republican. In the Indiana House of Representatives, Lake is part of the 1st, 2nd, 3rd, 11th, 12th, 14th, 15th and 19th districts, which are held by four Democrats and four Republicans.
| Year | Republican | Democratic | Third parties |
|---|---|---|---|
| 2020 | 41.7% 91,760 | 56.7% 124,870 | 1.5% 3,326 |
| 2016 | 37.3% 75,625 | 57.7% 116,935 | 5.1% 10,241 |
| 2012 | 33.9% 68,431 | 64.8% 130,897 | 1.4% 2,819 |
| 2008 | 32.4% 67,742 | 66.6% 139,301 | 1.0% 1,996 |
| 2004 | 38.2% 71,903 | 61.0% 114,743 | 0.7% 1,376 |
| 2000 | 36.0% 63,389 | 62.0% 109,078 | 2.0% 3,527 |
| 1996 | 29.2% 47,873 | 61.2% 100,198 | 9.6% 15,789 |
| 1992 | 28.9% 53,867 | 55.2% 102,778 | 15.9% 29,653 |
| 1988 | 43.0% 79,929 | 56.6% 105,026 | 0.4% 780 |
| 1984 | 44.3% 94,870 | 55.1% 117,984 | 0.6% 1,289 |
| 1980 | 46.0% 95,408 | 48.8% 101,145 | 5.2% 10,786 |
| 1976 | 42.4% 90,119 | 56.7% 120,700 | 0.9% 1,922 |
| 1972 | 56.2% 115,480 | 43.1% 88,510 | 0.7% 1,352 |
| 1968 | 36.5% 77,911 | 46.8% 99,897 | 16.7% 35,766 |
| 1964 | 35.2% 73,722 | 64.4% 134,978 | 0.4% 823 |
| 1960 | 37.0% 78,278 | 62.7% 132,554 | 0.3% 526 |
| 1956 | 52.0% 92,803 | 47.6% 85,000 | 0.4% 657 |
| 1952 | 44.7% 74,073 | 54.7% 90,721 | 0.6% 1,051 |
| 1948 | 38.8% 51,413 | 58.1% 77,025 | 3.1% 4,157 |
| 1944 | 38.8% 48,147 | 60.6% 75,066 | 0.6% 737 |
| 1940 | 38.8% 45,898 | 60.8% 71,985 | 0.4% 447 |
| 1936 | 32.5% 33,689 | 66.1% 68,551 | 1.5% 1,510 |
| 1932 | 46.6% 42,596 | 50.3% 46,060 | 3.1% 2,836 |
| 1928 | 59.7% 48,768 | 39.6% 32,321 | 0.8% 630 |
| 1924 | 64.6% 30,990 | 22.8% 10,918 | 12.6% 6,060 |
| 1920 | 69.2% 26,296 | 18.8% 7,136 | 12.1% 4,596 |
| 1916 | 55.0% 13,262 | 41.3% 9,946 | 3.8% 903 |
| 1912 | 29.6% 5,176 | 29.4% 5,136 | 41.0% 7,171 |
| 1908 | 61.0% 9,499 | 35.3% 5,502 | 3.7% 578 |
| 1904 | 64.1% 6,429 | 29.3% 2,933 | 6.6% 666 |
| 1900 | 58.0% 5,337 | 40.6% 3,733 | 1.4% 131 |
| 1896 | 58.1% 4,883 | 40.7% 3,418 | 1.2% 102 |
| 1892 | 48.0% 2,958 | 48.9% 3,010 | 3.1% 192 |
| 1888 | 54.2% 2,543 | 44.1% 2,068 | 1.7% 80 |
2008 presidential primary
In the 2008 Democratic presidential primary on May 6, 2008, Lake County was one of the last counties to report results.[47] Lake County had reported no results at 11 p.m. ET,[48] and at midnight ET, only 28% of Lake County's vote had been reported.[49] A large number of absentee ballots and a record turnout delayed the tallies, and polls closed an hour later than much of the state because Lake County is in the Central Time Zone.[48] Early returns showed Senator Barack Obama leading by a potentially lead-changing margin, leaving the race between Senator Hillary Clinton and Obama "too close to call" until final tallies were reported.
Culture and contemporary life
Entertainment and the arts
- Northwest Indiana Symphony Orchestra, concerts held at Living Hope Church – Merrillville
- Theatre at the Center, located at the Center for Visual and Performing Arts – Munster
- Towle Theater located in Hammond offering live theater performances as well as youth workshops under the name TYTE
Major attractions
- Ameristar Casino – East Chicago
- Horseshoe Casino – Hammond
- Majestic Star Casino – Gary
- Majestic Star Casino II – Gary
- Pierogi Fest – Whiting
- Southlake Mall – Hobart
- Three Floyds Brewing – Munster
Professional sports teams
- Gary SouthShore RailCats, an American Association professional baseball team, play their games at U.S. Steel Yard in Gary.
- Gary Splash, an Independent Basketball Association professional basketball team, play their games at the Genesis Convention Center in Gary.
Recreation
- List of parks and recreational facilities – Lake County Parks and Recreation
- Bellaboo's Play and Discovery Center – Lake Station
- Buckley Homestead – Lowell
- Cedar Creek Family Golf Center – Cedar Lake
- Deep River County Park – Hobart
- Deep River Waterpark – Crown Point
- Gibson Woods Nature Preserve – Hammond
- Grand Kankakee Marsh – Hebron
- Lake Etta – Gary
- Lemon Lake – Crown Point
- Oak Ridge Prairie & Oak Savannah Trail – Griffith
- Stoney Run County Park – Hebron
- Three Rivers County Park – Lake Station
- Turkey Creek Golf Course – Merrillville
- Whihala Beach – Whiting
- List of recreational facilities – Indiana Dunes National Park
- Calumet Prairie State Nature Preserve – Lake Station
- Hobart Prairie Grove – Hobart
- Hoosier Prairie State Nature Preserve – Griffith
- Paul H. Douglas Center for Environmental Education – Gary
Demographics
| Historical population | |||
|---|---|---|---|
| Census | Pop. | %± | |
| 1840 | 1,468 | — | |
| 1850 | 3,991 | 171.9% | |
| 1860 | 9,145 | 129.1% | |
| 1870 | 12,339 | 34.9% | |
| 1880 | 15,091 | 22.3% | |
| 1890 | 23,886 | 58.3% | |
| 1900 | 37,892 | 58.6% | |
| 1910 | 82,864 | 118.7% | |
| 1920 | 159,957 | 93.0% | |
| 1930 | 261,310 | 63.4% | |
| 1940 | 293,195 | 12.2% | |
| 1950 | 368,152 | 25.6% | |
| 1960 | 513,269 | 39.4% | |
| 1970 | 546,253 | 6.4% | |
| 1980 | 522,965 | −4.3% | |
| 1990 | 475,594 | −9.1% | |
| 2000 | 484,564 | 1.9% | |
| 2010 | 496,005 | 2.4% | |
| 2019 (est.) | 485,493 | [50] | −2.1% |
| U.S. Decennial Census[51] 1790-1960[52] 1900-1990[53] 1990-2000[54] 2010-2019[10] | |||
As of the 2010 United States Census, there were 496,005 people, 188,157 households, and 127,647 families residing in the county.[55] The population density was 994.1 inhabitants per square mile (383.8/km2). There were 208,750 housing units at an average density of 418.4 per square mile (161.5/km2).[20] The racial makeup of the county was 64.4% white, 25.9% black or African American, 1.2% Asian, 0.3% American Indian, 5.8% from other races, and 2.4% from two or more races. Those of Hispanic or Latino origin made up 16.7% of the population.[55] In terms of ancestry, 16.1% were German, 11.1% were Irish, 9.6% were Polish, 5.4% were English, and 3.7% were American.[56]
Of the 188,157 households, 34.3% had children under the age of 18 living with them, 44.7% were married couples living together, 17.4% had a female householder with no husband present, 32.2% were non-families, and 27.4% of all households were made up of individuals. The average household size was 2.60 and the average family size was 3.19. The median age was 37.4 years.[55]
The median income for a household in the county was $47,697 and the median income for a family was $58,931. Males had a median income of $50,137 versus $33,264 for females. The per capita income for the county was $23,142. About 12.2% of families and 16.1% of the population were below the poverty line, including 25.3% of those under age 18 and 8.4% of those age 65 or over.[57]
| Place | Population (2010) | White | Black or African American |
Asian | Other [note 1] |
Hispanic or Latino (of any race) |
|---|---|---|---|---|---|---|
| Lake County | 496,005 | 64.4% | 25.9% | 1.2% | 8.5% | 16.7% |
| Cedar Lake, town | 11,560 | 94.9% | 0.5% | 0.4% | 4.2% | 6.5% |
| Crown Point, city | 27,317 | 88.2% | 6.3% | 1.8% | 3.7% | 8.1% |
| Dyer, town | 16,390 | 90.1% | 2.5% | 2.9% | 4.5% | 9.3% |
| East Chicago, city | 29,698 | 35.5% | 42.9% | 0.1% | 21.5% | 50.9% |
| Gary, city | 80,294 | 10.7% | 84.8% | 0.2% | 4.3% | 5.1% |
| Griffith, town | 16,893 | 75.8% | 16.9% | 0.8% | 6.5% | 13.3% |
| Hammond, city | 80,830 | 59.4% | 22.5% | 1.0% | 17.1% | 34.1% |
| Highland, town | 23,727 | 88.6% | 4.2% | 1.6% | 5.6% | 12.8% |
| Hobart, city | 29,059 | 85.3% | 7.0% | 1.0% | 6.7% | 13.9% |
| Lake Dalecarlia, CDP | 1,355 | 97.3% | 0.2% | 0.1% | 2.4% | 3.4% |
| Lake Station, city | 12,572 | 79.7% | 3.6% | 0.3% | 16.4% | 28.0% |
| Lakes of the Four Seasons, CDP[note 2] | 7,033 | 93.4% | 1.2% | 1.0% | 4.4% | 8.5% |
| Lowell, town | 9,276 | 95.9% | 0.5% | 0.3% | 3.3% | 6.9% |
| Merrillville, town | 35,246 | 46.4% | 44.5% | 1.2% | 7.9% | 12.9% |
| Munster, town | 23,603 | 85.6% | 3.5% | 5.8% | 5.1% | 10.2% |
| New Chicago, town | 2,035 | 81.0% | 2.2% | 0.7% | 16.1% | 27.4% |
| St. John, town | 14,850 | 93.5% | 1.3% | 1.3% | 3.9% | 8.2% |
| Schererville, town | 29,243 | 86.8% | 5.4% | 2.8% | 5.0% | 10.6% |
| Schneider, town | 277 | 97.1% | 0.0% | 1.1% | 1.8% | 2.5% |
| Shelby, CDP | 539 | 95.5% | 1.7% | 0.2% | 2.6% | 0.9% |
| Whiting, city | 4,997 | 76.3% | 3.5% | 0.7% | 19.5% | 40.7% |
| Winfield, town | 4,383 | 88.5% | 3.7% | 3.5% | 4.3% | 8.9% |
| Place | Population (2010) | Per capita income |
Median household income |
Median home value |
|---|---|---|---|---|
| Lake County | 496,005 | $23,792 | $49,315 | $137,400 |
| Cedar Lake, town | 11,560 | $25,477 | $59,090 | $151,400 |
| Crown Point, city | 27,317 | $31,454 | $64,876 | $174,900 |
| Dyer, town | 16,390 | $35,020 | $78,881 | $197,500 |
| East Chicago, city | 29,698 | $13,457 | $27,171 | $86,800 |
| Gary, city | 80,294 | $15,764 | $26,956 | $66,900 |
| Griffith, town | 16,893 | $26,548 | $53,225 | $141,600 |
| Hammond, city | 80,830 | $18,148 | $38,677 | $94,800 |
| Highland, town | 23,727 | $30,036 | $61,930 | $155,200 |
| Hobart, city | 29,059 | $24,740 | $54,468 | $134,400 |
| Lake Dalecarlia, CDP | 1,355 | $25,035 | $52,321 | $165,400 |
| Lake Station, city | 12,572 | $16,953 | $36,955 | $82,400 |
| Lakes of the Four Seasons, CDP[note 2] | 7,033 | $32,908 | $84,242 | $182,600 |
| Lowell, town | 9,276 | $23,619 | $60,549 | $146,500 |
| Merrillville, town | 35,246 | $23,605 | $53,470 | $132,600 |
| Munster, town | 23,603 | $34,735 | $70,708 | $197,600 |
| New Chicago, town | 2,035 | $18,083 | $38,672 | $97,700 |
| St. John, town | 14,850 | $36,490 | $97,868 | $254,600 |
| Schererville, town | 29,243 | $33,984 | $68,004 | $204,300 |
| Schneider, town | 277 | $18,774 | $50,972 | $89,500 |
| Shelby, CDP | 539 | $29,700 | $61,667 | $89,700 |
| Whiting, city | 4,997 | $21,427 | $44,368 | $111,500 |
| Winfield, town | 4,383 | $23,792 | $49,315 | $137,400 |
See also
- Lake County Indiana Sheriff's Department
- List of public art in Lake County, Indiana
- National Register of Historic Places listings in Lake County, Indiana
| Wikimedia Commons has media related to Lake County, Indiana. |
Bibliography
- Forstall, Richard L. (editor) (1995). U. S. Population of States and Counties - 1790 Through 1990. National Technical Information Services (NTIS). ISBN 0-934213-48-8.CS1 maint: extra text: authors list (link)
- Schoon, Kenneth J. (2003). Calumet Beginnings: Ancient Shorelines and Settlements at the South End of Lake Michigan. Indiana University Press. ISBN 0-253-34218-X.
Notes
- Other = Combined percentages for American Indian or Alaska Native; Native Hawaiian or Pacific Islander; other races; and two or more races
- Population is 3,936 within Lake County; 3,097 reside in Porter County
References
- "Lake County History". Lake County Historical Museum. Archived from the original on June 2, 2014. Retrieved June 1, 2014.
- William Frederick Howat (1915). A Standard History of Lake County, Indiana, and the Calumet Region, Volume 1. Chicago: Lewis Publishing Company. p. 100.
- "2016 Public Officials Directory". Lake County Board of Elections and Voter's Registration. Archived from the original on June 8, 2014. Retrieved October 11, 2016.
- Timothy Horton Ball (1873). Lake County, Indiana, from 1834 to 1872. Chicago: J.W. Goodspeed. p. 5
- "Lake County". Geographic Names Information System. United States Geological Survey.
- Palmer Quadrangle – Indiana – Lake Co (Map). 1:24,000. 7.5-Minute Series (Topographic). United States Geological Survey. 2013.
- Whiting Quadrangle – Indiana – Lake Co (Map). 1:24,000. 7.5-Minute Series (Topographic). United States Geological Survey. 2013.
- "USA Counties in Profile". STATS Indiana. Archived from the original on July 30, 2012. Retrieved June 16, 2014.
- U.S. Census Bureau. American Community Survey, Profile of General Population and Housing Characteristics 2010, Table DP-1, 2010 Demographic Profile Data. U.S. Census website . Retrieved 2014-06-14.
- "Lake County QuickFacts". United States Census Bureau. Archived from the original on June 7, 2011. Retrieved June 12, 2014.
- "Find a County". National Association of Counties. Archived from the original on May 31, 2011. Retrieved June 7, 2011.
- Smith, S. & Mark, S. (2006). Alice Gray, Dorothy Buell, and Naomi Svihla: Preservationists of Ogden Dunes. The South Shore Journal, 1. "Archived copy". Archived from the original on September 13, 2012. Retrieved June 11, 2012.CS1 maint: archived copy as title (link)
- Smith, S. & Mark, S. (2009). The Historical Roots of the Nature Conservancy in the Northwest Indiana/Chicagoland Region: From Science to Preservation. The South Shore Journal, 3. "Archived copy". Archived from the original on January 1, 2016. Retrieved November 22, 2015.CS1 maint: archived copy as title (link)
- Smith, S. & Mark, S. (2011). Marktown: Clayton Mark's Planned Worker Community in Northwest Indiana. South Shore Journal, 4. "Archived copy". Archived from the original on September 13, 2012. Retrieved August 29, 2012.CS1 maint: archived copy as title (link)
- Kenneth J. Schoon (2003). Calumet Beginnings: Ancient Shorelines and Settlements at the South End of Lake Michigan. Indiana: Indiana University Press. pps. 20-23.
- De Witt Clinton Goodrich & Charles Richard Tuttle (1875). An Illustrated History of the State of Indiana. Indiana: R. S. Peale & Co. p. 565.
- William Frederick Howat (1915). A Standard History of Lake County, Indiana, and the Calumet Region, Volume 1. Chicago: Lewis Publishing Company. p. 44.
- "Lake County, IN". Encyclopedia of Chicago. Chicago History Museum. Retrieved October 3, 2018.
- "Northwest Indiana Regional Analysis: Demographics, Economy, Entrepreneurship and Innovation" (PDF). Cleveland State University. Archived from the original (PDF) on March 25, 2016. Retrieved October 5, 2018.
- "Population, Housing Units, Area, and Density: 2010 - County". United States Census Bureau. Archived from the original on February 12, 2020. Retrieved July 10, 2015.
- "Largest Employers in Lake County, Indiana". Lake County Economic Alliance. Archived from the original on October 9, 2017. Retrieved December 31, 2017.
- "Page Not Found: STATS Indiana". www.stats.indiana.edu. Archived from the original on December 8, 2016. Retrieved September 5, 2017. Cite uses generic title (help)
- Joseph S. Pete (March 5, 2016). "Purdue University Northwest now officially exists". The Times of Northwest Indiana. Archived from the original on March 7, 2016. Retrieved March 5, 2016.
- "Crown Point Community Library". Archived from the original on July 11, 2014. Retrieved June 19, 2014.
- "East Chicago Public Library". Archived from the original on June 1, 2014. Retrieved June 19, 2014.
- "Gary Public Library". Archived from the original on July 14, 2014. Retrieved June 19, 2014.
- "Hammond Public Library". Archived from the original on July 14, 2014. Retrieved June 19, 2014.
- "Lake County Public Library". Archived from the original on July 1, 2014. Retrieved June 19, 2014.
- "Lowell Public Library". Archived from the original on April 3, 2014. Retrieved June 19, 2014.
- "Whiting Public Library". Archived from the original on July 14, 2014. Retrieved June 19, 2014.
- "Hospital Facility Directory for Lake County". Indiana State Department of Health. Archived from the original on February 15, 2016. Retrieved February 11, 2016.
- "Franciscan Health is New Name for Leading Hospital System". Franciscan Alliance, Inc. September 6, 2016. Archived from the original on September 20, 2016. Retrieved September 11, 2016.
- Giles Bruce (December 18, 2015). "Crown Point hospital becomes Region's 2nd trauma center". The Times of Northwest Indiana. Archived from the original on December 22, 2015. Retrieved December 18, 2015.
- "Indiana Trauma Centers". Indiana State Department of Health. Archived from the original on April 6, 2015. Retrieved April 5, 2015.
- Times Staff (February 3, 2018). "Franciscan Health Crown Point designated Level 3 trauma center". The Times of Northwest Indiana. Archived from the original on February 2, 2018. Retrieved February 3, 2018.
- Giles Bruce (August 17, 2017). "Gary hospital becomes first in Northwest Indiana to earn trauma center designation". The Times of Northwest Indiana. Archived from the original on August 18, 2017. Retrieved August 17, 2017.
- "NCDC: U.S. Climate Normals". National Oceanic and Atmospheric Administration. Archived from the original on July 14, 2014.
- "Archived copy". Archived from the original on July 25, 2015. Retrieved July 25, 2015.CS1 maint: archived copy as title (link)
- Laird, Neil F.; Kristovich, David A. R.; Liang, Xin-Zhong; Arritt, Raymond W.; Labas, Kenneth (March 1, 2001). "Lake Michigan Lake Breezes: Climatology, Local Forcing, and Synoptic Environment". Journal of Applied Meteorology. 40 (3): 409–424. doi:10.1175/1520-0450(2001)040<0409:lmlbcl>2.0.co;2.
- Service, National Weather. "NWS JetStream - Thunderstorms". www.srh.noaa.gov. Archived from the original on March 23, 2016. Retrieved September 5, 2017.
- "Archived copy". Archived from the original on September 20, 2015. Retrieved July 25, 2015.CS1 maint: archived copy as title (link)
- Indiana Code. "Title 36, Article 2, Section 3". IN.gov. Archived from the original on October 5, 2008. Retrieved September 16, 2008.
- Indiana Code. "Title 2, Article 10, Section 2" (PDF). IN.gov. Archived (PDF) from the original on October 29, 2008. Retrieved September 16, 2008.
- Bill Dolan (September 16, 2017). "New Lake County Sheriff Martinez credited experience, Hammond support for victory". The Times of Northwest Indiana. Archived from the original on September 16, 2017. Retrieved September 16, 2017.
- "US Congressman Pete Visclosky". US Congress. Archived from the original on October 9, 2008. Retrieved July 13, 2014.
- Leip, David. "Dave Leip's Atlas of U.S. Presidential Elections". uselectionatlas.org. Archived from the original on March 23, 2018. Retrieved September 5, 2017.
- "Awaiting one county". CNN. May 6, 2008. Archived from the original on November 19, 2009. Retrieved May 7, 2010.
- Indiana's Lake County has tradition of late vote tallies
- "Clinton's Indiana win keeps Democratic race alive - CNN.com". www.cnn.com. Archived from the original on May 6, 2008. Retrieved September 5, 2017.
- "Population and Housing Unit Estimates". Retrieved March 26, 2020.
- "U.S. Decennial Census". United States Census Bureau. Retrieved July 10, 2014.
- "Historical Census Browser". University of Virginia Library. Archived from the original on August 11, 2012. Retrieved July 10, 2014.
- "Population of Counties by Decennial Census: 1900 to 1990". United States Census Bureau. Archived from the original on October 4, 2014. Retrieved July 10, 2014.
- "Census 2000 PHC-T-4. Ranking Tables for Counties: 1990 and 2000" (PDF). United States Census Bureau. Archived (PDF) from the original on December 18, 2014. Retrieved July 10, 2014.
- "DP-1 Profile of General Population and Housing Characteristics: 2010 Demographic Profile Data". United States Census Bureau. Archived from the original on February 13, 2020. Retrieved July 10, 2015.
- "DP02 SELECTED SOCIAL CHARACTERISTICS IN THE UNITED STATES – 2006-2010 American Community Survey 5-Year Estimates". United States Census Bureau. Archived from the original on February 14, 2020. Retrieved July 10, 2015.
- "DP03 SELECTED ECONOMIC CHARACTERISTICS – 2006-2010 American Community Survey 5-Year Estimates". United States Census Bureau. Archived from the original on February 14, 2020. Retrieved July 10, 2015.
- U.S. Census Bureau. 2008-2012 American Community Survey 5-Year Estimates, Table DP03, Selected Economic Characteristics. U.S. Census website . Retrieved 2014-06-14.
- U.S. Census Bureau. 2008-2012 American Community Survey 5-Year Estimates, Table DP04, Selected Housing Characteristics. U.S. Census website . Retrieved 2014-06-14.
External links
Places adjacent to Lake County, Indiana | |
|---|---|
Municipalities and communities of Lake County, Indiana, United States | ||
|---|---|---|
| Cities | Map of Indiana highlighting Lake County | |
| Towns | ||
| Townships | ||
| CDPs | ||
| Other unincorporated communities | ||
| Ghost town | ||
| Footnotes | ‡This populated place also has portions in an adjacent county or counties. | |
| ||
| Major city |  | |
|---|---|---|
| Cities (over 30,000 in 2010) | ||
| Towns and villages (over 30,000 in 2010) |
| |
| Counties | ||
| Regions | ||
| Sub-regions | ||

| Authority control |
|---|