List of countries by English-speaking population
The following is a list of English-speaking population by country, including information on both native speakers and second-language speakers.
}
List
| Country | Eligible population | Total English speakers | As first language | As an additional language[1] | Notes | |||
|---|---|---|---|---|---|---|---|---|
| No. | % | No. | % | No. | % | |||
| 296,603,003 | 283,160,411 | 95.45 | 234,171,556 | 78.95 | 48,988,855 | 16.5 | Figures are from the 2011–2015 American Community Survey 5-year estimates by the U.S. Census Bureau for persons age 5 and older. Total English speakers are those who either spoke English at home (i.e. as first language), or reported speaking another language at home but could speak English "very well" or "well" (i.e. as an additional language).[2] | |
| 1,028,737,436 | 125,344,737 | 12.18 | 226,449 | 0.02 | 125,118,287 | 12.16 | 2001 Census figures for population and first, second, and third languages. English as a first language is only spoken by 226,449 people, as a second language by 86,125,221, and as a third language by 38,993,066.[3][4] | |
| 188,400,100 | 108,036,049 | 57.34 | 8,642 | 0.045 | 92,316,049 | 49 | Official Language, lingua franca and spoken amongst a wide proportion of the Pakistani Population – 49% as a second language (other estimates).[5][6][7][8][9] | |
| 156,493,000 | 79,000,000 | 53.34 | 79,000,000 | 53.34 | Euromonitor International report (2009) | |||
| 110,000,000 | 64,025,890 | 58.2 | 36,935 | 0.04 | 63,988,955 | 63.72 | Total population: Census 2010. Proportion of total speakers: Census 2000, text above Figure 7. 63.71% of the then 66.7 million people aged 5 years or more could speak English.[10] Proportion of native speakers: Census 1995, as quoted by Andrew Gonzalez in "The Language Planning Situation in the Philippines", Journal of Multilingual and Multicultural Development, 19 (5&6), 487–525, p. 492: .04% of the then 68.4 million people were native speakers of English. (1998).[11] "Six out of 10 people aged 5 and over can speak English (63.71%)."[12] | |
| 64,000,000 | 59,528,000 | 90.6 | 54,400,000 | 85 | 5,128,000 | 5.60 | Source: Data from the 2011 census for England and Wales.[13] Additional English speaker figures are for usual residents aged 3 years and over with a main language other than English who can speak English "very well" or "well". | |
| 80,600,000 | 45,400,000 | 56 | 272,000 | 0.34 | 45,100,000 | 56 | Native speakers: Statistisches Bundesamt (cited here). Non-native speakers: Eurobarometer report 2012 Does not include foreign military personnel based in Germany. | |
| 65,350,000 | 23,000,000 | 39 | 23,000,000 | 39 | Source: Eurobarometer report 2012 | |||
| 37,138,500 | 30,480,750 | 83.06 | 20,193,335 | 54.37 | 10,287,415 | 28.69 | Source: . The 2016 count reported that 23,757,525 people were able to conduct a conversation in English but not French, while 6,216,065 were able to converse in both English and French. The census also asked for the first language learned at home in childhood and still understood by the individual: 52% or 19,460,850 reported English as their sole mother tongue, 165,320 reported both English and French as mother tongues, 533,265 reported English and a non-official language as mother tongues, and 33,900 reported English, French and a non-official language as mother tongues. | |
| 23,401,892 | 21,715,910 | 92.80 | 17,020,421 | 72.73 | 4,695,489 | 20.06 | Source: 2016 Census.[14] The 2016 census data is subject to multiple interpretations. The data noted that 17,020,421 persons out of 23,401,892 total only spoke English, and a further 4,695,489 spoke English either "Very Well", "Well" or "Not Well". A further 193,036 person were listed as speaking English "Not At All". However, 1,492,941 persons provided incomplete information; 1,440,493 provided no language or proficiency details and 52,448 gave no information on proficiency. | |
| 59,619,290 | 17,000,000 | 34 | 17,000,000 | 34 | Source: Eurobarometer report 2012 | |||
| 163,323,100 | 30,108,031 | 18 | 709,873 | 0.43 | 29,398,158 | Source: Euromonitor International report 2009, Euromonitor Dec 2010 [15] | ||
| 83,289,500 | 28,101,325 | 35 | 28,101,325 | 35 | Source: Euromonitor International Report 2011 [16] | |||
| 63,038,247 | 17,121,187 | 27.16 | 17,121,187 | 27.16 | Source: Crystal (2003), p. 109. | |||
| 16,770,000 | 15,250,000 | 90.9 | 15,250,000 | 90.9 | Source: Eurobarometer report 2016 | |||
| 29,890,686 | 10,700,866 | 35.8 | 20,000 | 0.07 | 876,720 | Source: Census. (date not verified) | ||
| 52,981,991 | 16,424,417 | 31 | 4,930,510 | 9.31 | 11,493,907 | 22 | Native speakers from 2011 Census.[17] Non-native speakers: Crystal (2003), p. 109. | |
| 38,501,000 | 14,300,000 | 37 | 100,000 | 0.26 | 14,200,000 | 36.88 | Source: Central Statistical Office,[18] Additional language speakers are people age 18–69, who reported English Language as their first of second best foreign language, Central Statistical Office [19] Native language counted as those who speak English at home. | |
| 80,200,256 | 12,000,000 | 17 | 12,000,000 | 17 | Source: Eurobarometer report 2006 | |||
| 14,439,000 | 11,850,710 | 82.07 | 505,365 | 3.52 | 11,530,710 | 79.86 | [20][21][22] | |
| 31,700,000 | 11,095,000 | 35 | 11,000,000 | Source: Euromonitor International report (2011) | ||||
| 21,803,000 | 13,517,860 | 62 | 3,270,450 | 15 | 10,247,410 | 47 | English being the first language of approximately more than 3 million people. 15% Sri Lankan only spoke English. [23][24] | |
| 47,190,000 | 10,400,000 | 22 | 10,400,000 | 22 | Source: Eurobarometer report 2012 | |||
| 1,210,000,000 | 10,000,000 | 0.9 | 10,000,000 | <1 | Figures are for English users in mainland China only (i.e. excluding Hong Kong where English is an official language and Macau). The often-cited figure of 300 million is for "learners."[25][26] | |||
| 205,000,000 | 10,542,000 | 5 | 292,000 | 0.14 | 10,250,000 | 5 | Source: British council (2012) and EF. Only 5% of Brazilians have a proficient grasp of English as a second or foreign additional language and an additional 6% have a very rudimentary knowledge. Brazil has 240 thousand British descendants and 180 thousand American ancestry citizens including the Confederados cultural sub-group, descendants of the Confederate colonies. | |
| 9,921,541 | 8,200,000 | 86 | 8,200,000 | 86 | Source: Eurobarometer report 2012 | |||
| 43,013,431 | 8,100,000 | 18.83 | 7,900,000 | Source: Crystal (2003), p. 109. | ||||
| 19,740,000 | 7,500,000 | 38 | 7,500,000 | 38 | Euromonitor International Report (2009) | |||
| 27,170,000 | 15,580,000 | 62.57 | 380,000 | 1.4 | 15,200,000 | 61.1 | EF English Proficiency Index[27] | |
| 148,312,535 | 17,574,303 | 11.85 | 101,522 | 0.1 | 17,571,787 | 11.85 | Source: Composition by Nationality and Language Ability, Citizenship, Tables 4.5 and 4.1, Russian Census (2009). The "total" figure is the number of residents who reported English as one of the languages they knew. The "first language" figure is the number of residents who reported "American" or "English" as their nationality. The "additional languages" figure is the difference. More than 17 million schoolgoers studied English as a foreign language in 2008–2009. | |
| 10,584,534 | 6,250,000 | 60 | 6,250,000 | 60 | Source: Eurobarometer report 2006 Note that the Belgian population is divided in two distinct linguistic regions: The Belgian Dutch-speaking Flanders, and the Belgian French-speaking Wallonia (note that the region of Brussels also has a majority of native French speakers). Like in the Netherlands, a high percentage of Flemish people speak English fluently, and in Wallonia, a lower percentage of people speak English (as it is the case in France), which brings down the total percentage. | |||
| 7,303,000 | 6,205,000 | 84.97 | 100,000 | 1.37 | 6,105,000 | 83.6 | Source: Ethnologue (2005)[28] English is widely spoken, both by the Jewish majority and by minority ethnic groups.[29][30] | |
| 8,415,000 | 6,150,000 | 73 | 58,582 | 0.73 | 6,150,000 | 73 | [31][32] | |
| 19,043,767 | 5,900,000 | 31 | 5,900,000 | 31 | Source: Eurobarometer report 2012 | |||
| 10,787,690 | 5,500,000 | 51 | 5,500,000 | 51 | Source: Eurobarometer report 2012 | |||
| 5,866,000 | 4,900,000 | 83.53 | 500,000 | 8.52 | 4,400,000 | 75 | Crystal (2003), p. 109. Note this includes speakers of an English creole. | |
| 120,664,000 | 15,686,262 | 12.9 | 15,686,262 | 12.9 | Consulta Mitofsky-Tracking Poll Roy Campos: Las Lenguas Extranjeras en México, January 2013;[33] and II Conteo de Población y Vivienda, Instituto Nacional de Estadística, Geografía e Informática (INEGI).[34] | |||
| 5,543,000 | 4,770,000 | 86 | 4,770,000 | 86 | Source: Eurobarometer report 2012 | |||
| 7,637,300 | 4,680,000 | 61.28 | 73,400 | 0.96 | 4,606,600 | 60.32 | Figure for speakers of English as "main language", according to Federal Statistical Office, Neuchâtel 2008[35] Source for number of non-native English speakers is 1999 publication by Prof. François Grin cited here: http://switzerland.isyours.com/e/countries/uk/language.html | |
| 32,770,900 | 4,587,926 | 14 | 4,587,926 | 14 | Source: Euromonitor International report 2011 | |||
| 5,136,700 | 4,500,000 | 90 | 4,500,000 | 90 | Source: http://blog.oxforddictionaries.com/2014/03/norwegian-english-fusion-language/ | |||
| 40,044,238 | 7,207,962 | 18 | 7,207,962 | 18 | Source: EF English Proficiency Index | |||
| 4,422,100 | 4,350,000 | 98.37 | 4,122,100 | 93.22 | 237,900 | 5.38 | Source: Eurobarometer report 2006; Central Statistics Office ; Travbla [36] | |
| 5,607,300 | 4,218,737 | 83.1 | 1,873,302 | 33.41 | 2,345,435 | 41.83 | Source: 2015 Census. Second language speaker figure only includes those literate in English aged 15 or more and does not include third language proficiency. General Household Survey 2015 "Language Spoken at Home Among Residents Aged 5 Years and Over" | |
| 27,000,000 | 18,000,000 | 66.67 | 18,000,000 | 66.67 | Source: 2010 Ghanaian Census[37] | |||
| 40,454,000 | 4,000,000 | 9.89 | 4,000,000 | 9.89 | Source: Crystal (2003), p. 109. | |||
| 4,275,100 | 4,181,902 | 97.82 | 3,673,623 | 85.93 | 508,279 | 11.89 | There were 4,027,947 responses to 2006 Census: Language spoken. 3,673,679 gave English as a response, 81,936 had no English but another language. The balance of 272,382 were; no language (too young) 75,195, no response 196,221, response unidentifiable 588, response outside scope 378. Hence it is most meaningful to express the English-speaking per cent without including the figures for these 272,382. This gives 97.8% English-speaking, 2.2% non-English-speaking (3,673,679 and 81,936 divided by 3,755,565) Crystal (2003), p. 109, gives figures of 3,700,000 native speakers and 150,000 second language speakers. | |
| 5,410,000 | 3,800,000 | 70 | 3,800,000 | 70 | Source: Eurobarometer report 2012 | |||
| 10,623,000 | 2,900,000 | 27 | 2,900,000 | 27 | Source: Eurobarometer report 2012 | |||
| 6,331,000 | 3,150,000 | 49.76 | 150,000 | 2.37 | 3,000,000 | 47.38 | Source: Crystal (2003), p. 109. Note this includes speakers of an English creole. | |
| 3,750,000 | 3,100,000 | 82.67 | 600,000 | 16 | 2,500,000 | 66.67 | Source: Crystal (2003), p. 109. Note this includes speakers of an English creole. | |
| 6,598,000 | 2,969,370 | 45 | 2,969,370 | 45 | Source: Euromonitor International report (2011) | |||
| 2,714,000 | 2,650,000 | 97.64 | 45,900 | 1.69 | 50,000 | 45 | Source: Crystal (2003), p. 109. Note this includes speakers of an English creole. | |
| 35,954,000 | 2,516,780 | 7 | 2,516,780 | 7 | Source: Euromonitor International report (2011) | |||
| 30,884,000 | 2,500,000 | 8.09 | 2,500,000 | 8.09 | Source: Crystal (2003), p. 109. | |||
| 6,808,433 | 3,136,784 | 46.07 | 238,288 | 3.5 | 2,898,496 | 42.57 | According to 2011 population census, Hong Kong has approximately 3.1 million speakers, of whom 238,288 regard English as their "usual" language.[38] | |
| 10,562,214 | 2,850,000 | 27 | 2,850,000 | 27 | Source: Eurobarometer report 2012 | |||
| 42,192,500 | 2,752,681 | 6.52 | Source:.[39] Percentage of people who state they have a high level of English. Another 19.49% and 16.23% of people said they had an intermediate and low level, respectively, of English. | |||||
| 24,800,000 | 2,232,000 | 9 | 2,232,000 | 9 | Source: Euromonitor International report 2011 | |||
| 4,555,000 | 2,200,000 | 49 | 2,200,000 | 49 | Source: Eurobarometer report 2006 | |||
| 47,661,368 | 2,012,950 | 4.22 | 75,600 | 0.16 | 1,937,350 | 4.06 | Total was estimated by multiplying projected population for 2014 (DANE) by percentage of Colombian population that speaks English 4.09%[40] then 63,600 was added to that figure which is the total of American and British residents. Figures for native speakers are as follows: 60,000 U.S. citizens that reside in Colombia[41] 12,000 are Colombian Raizal from San Andrés and Isla de Providencia where they speak San Andrés–Providencia Creole[42] 3,600 British expatriates[43] | |
| 9,982,000 | 2,000,000 | 20 | 2,000,000 | 20 | Source: Eurobarometer report 2012 | |||
| 3,991,000 | 1,940,000 | 48.61 | 100,000 | 2.51 | 1,840,000 | 46.1 | Source: Crystal (2003), p. 109. | |
| 11,922,000 | 1,910,000 | 16.02 | 110,000 | 0.92 | 1,800,000 | 15.1 | Source: Crystal (2003), p. 109. | |
| 7,640,238 | 1,900,000 | 25 | 2,605 | 0.03 | 1,902,605 | Source: Eurobarometer report 2012 and 2011 Census[44] | ||
| 12,156,705 | 1,874,583 | 15.4 | 602 | 1,873,981 | 15.42 | Number of those who understand spoken English, from these 1.9 million: 311,435 (2.6%/16.6%) can only read, 931,444 (7.7%/49.6%) can read and write in English. The number of native speakers is the sum of Americans and Englishmen "by nationality". (Census 2009) | ||
| 4,265,600 | 1,706,000 | 40 | 1,706,000 | 40 | Source: Euromonitor International report (2011) | |||
| 16,634,603 | 1,585,027 | 9.53 | Source: 2012 Census.[45] | |||||
| 10,137,400 | 1,520,610 | 15 | 1,520,610 | 15 | Source: Euromonitor International report 2009 | |||
| 5,397,036 | 1,400,000 | 26 | 1,400,000 | 26 | Source: Eurobarometer report 2012 | |||
| 1,305,000 | 1,145,000 | 87.74 | 1,145,000 | Source: Crystal (2003), p. 109. Note this includes speakers of an English creole. | ||||
| 2,050,000 | 1,210,000 | 59 | 1,210,000 | 59 | Source: Eurobarometer report 2012 | |||
| 3,053,800 | 1,160,000 | 38 | 1,160,000 | 38 | Source: Eurobarometer report 2012 | |||
| 2,070,371 | 950,000 | 46 | 950,000 | 46 | Source: Eurobarometer report 2012 | |||
| 751,000 | 680,000 | 90.55 | 650,000 | 86.55 | 30,000 | 4 | Source: Crystal (2003), p. 109. Note this includes speakers of an English creole. | |
| 1,639,833 | 630,000 | 38.42 | 630,000 | 38.42 | Source: Crystal (2003), p. 109. | |||
| 1,294,236 | 650,000 | 50 | 650,000 | 50 | Source: Eurobarometer report 2012 | |||
| 839,000 | 610,000 | 73 | 610,000 | 73 | Source: Eurobarometer report 2012 | |||
| 4,176,869 | 584,762 | 14 | ||||||
| 13,931,831 | 540,209 | 3.88 | 209 | <0.1 | 540,000 | 3.87 | Source: Crystal (2003), p. 109 and Kayambizinthu.[46] | |
| 1,795,000 | 500,000 | 27.86 | 500,000 | 27.86 | Source: Crystal (2003), p. 109. | |||
| 470,784 | 410,000 | 87.09 | 260,000 | 55.23 | 150,000 | 32 | Source: Crystal (2003), p. 109. Note this includes speakers of an English creole. | |
| 453,000 | 400,000 | 89 | 48,000 | 10.6 | 352,000 | 77.7 | Source: Eurobarometer report 2012 | |
| 1,820,916 | 314,000 | 17.24 | 14,000 | 0.77 | 300,000 | 16.48 | Source: Crystal (2003), p. 109. | |
| 509,000 | 290,000 | 56 | 290,000 | 56 | Source: Eurobarometer report 2012 | |||
| 330,549 | 288,000 | 87.13 | 260,000 | 78.66 | 28,000 | 8.47 | Source: Crystal (2003), p. 109. Note this includes speakers of an English creole. | |
| 279,000 | 275,000 | 98.57 | 262,000 | 93.91 | 13,000 | 4.66 | Source: Crystal (2003), p. 109. Note this includes speakers of an English creole. | |
| 301,270 | 246,000 | 81.65 | 190,000 | 63.07 | 56,000 | 18.59 | Source: Crystal (2003), p. 109. Note this includes speakers of an English creole. | |
| 23,042,300 | 4,147,614 | 18 | 4,147,614 | 18 | The main languages are French and Malagasy. | |||
| 4,910,526 | 400,415 | 8.2 | 400,415 | 8.2 | Source: Encuesta Nacional de Hogares 2017 http://www.inec.go.cr/sistema-de-consultas | |||
| 1,264,866 | 202,000 | 15.97 | 2,000 | 0.16 | 200,000 | 15.81 | Source: Crystal (2003), p. 109. | |
| 215,446 | 180,000 | 83.55 | 60,000 | 27.85 | 120,000 | 55.7 | Source: Crystal (2003), p. 109. Note this includes speakers of an English creole. | |
| 853,445 | 176,000 | 20.62 | 6,000 | 0.7 | 170,000 | 19.92 | Source: Crystal (2003), p. 109. | |
| 552,438 | 175,000 | 31.68 | 10,000 | 1.81 | 165,000 | 29.87 | Source: Crystal (2003), p. 109. Note this includes speakers of an English creole. | |
| 173,456 | 158,000 | 91.09 | 58,000 | 33.44 | 100,000 | 57.65 | Source: Crystal (2003), p. 109. | |
| 381,371 | 144,000 | 39.07 | 10,000 | 2.62 | 134,000 | 35.14 | Source: Crystal (2003), p. 109. | |
| 120,000 | 114,000 | 95 | 114,000 | 95 | Source: Crystal (2003), p. 109. Note this includes speakers of an English creole. | |||
| 108,448 | 113,000 | 95.97 | 98,000 | 90.37 | 15,000 | 13.83 | Source: Crystal (2003), p. 109. Note this includes speakers of an English creole. | |
| 110,000 | 100,000 | 90.91 | 100,000 | 90.91 | Source: Crystal (2003), p. 109. Note this includes speakers of an English creole. | |||
| 188,540 | 94,000 | 49.86 | 1,000 | 0.53 | 93,000 | 49.33 | Source: Crystal (2003), p. 109. | |
| 80,058 | 80,000 | 99.93 | 80,000 | 99.93 | ||||
| 53,900,000 | 2,400,000 | 4.45 | 2,400,000 | 4.45 | Source: Crystal (2003), p. 109. | |||
| 165,000 | 71,000 | 43.03 | 31,000 | 18.79 | 40,000 | 24.24 | Source: Crystal (2003), p. 109. Note this includes speakers of an English creole. | |
| 84,000 | 70,000 | 83.33 | 5,000 | 5.95 | 65,000 | 77.38 | Source: Crystal (2003), p. 109. Note this includes speakers of an English creole. | |
| 85,000 | 68,000 | 80 | 66,000 | 77.65 | 2,000 | 2.35 | Source: Crystal (2003), p. 109. Note this includes speakers of an English creole. | |
| 57,345 | 45,933 | 80.1 | 1,791 | 3.12 | 44,142 | 76.98 | Source: The World Factbook – American Samoa | |
| 111,000 | 64,000 | 57.66 | 4,000 | 3.6 | 60,000 | 54.05 | Source: Crystal (2003), p. 109. | |
| 65,000 | 63,000 | 96.92 | 63,000 | 96.92 | Source: Crystal (2003), p. 109. | |||
| 67,000 | 63,000 | 94.03 | 3,000 | 4.48 | 60,000 | 89.55 | Source: Crystal (2003), p. 109. Note this includes speakers of an English creole. | |
| 59,000 | 58,000 | 98.33 | 500 | <1 | Source: Crystal (2003), p. 109. | |||
| 1,141,000 | 50,000 | 4.38 | 50,000 | 4.38 | Source: Crystal (2003), p. 109. | |||
| 104,000 | 44,000 | 42.31 | 9,000 | 8.65 | 35,000 | Source: Crystal (2003), p. 109. | ||
| 1,709,000 | 40,000 | 2.34 | 40,000 | 2.34 | Source: Crystal (2003), p. 109. Note this includes speakers of an English creole. | |||
| 50,000 | 39,000 | 78 | 39,000 | 78 | Source: Crystal (2003), p. 109. Note this includes speakers of an English creole. | |||
| 47,000 | 36,000 | 76.6 | 36,000 | 76.6 | Source: Crystal (2003), p. 109. Note this includes speakers of an English creole. | |||
| 87,000 | 33,000 | 37.93 | 3,000 | 3.45 | 30,000 | 34.48 | Source: Crystal (2003), p. 109. | |
| 28,875 | 28,875 | 100 | 28,000 | 96.97 | 875 | 3.03 | Source: Crystal (2003), p. 109. | |
| 100,000 | 30,000 | 30 | 30,000 | 30 | Source: Crystal (2003), p. 109. | |||
| 95,000 | 23,000 | 24.21 | 23,000 | 24.21 | Source: Crystal (2003), p. 109. | |||
| 23,000 | 20,000 | 86.96 | 20,000 | 86.96 | Source: Crystal (2003), p. 109. Note this includes speakers of an English creole. | |||
| 20,000 | 18,500 | 92.5 | 500 | 2.5 | 18,000 | Source: Crystal (2003), p. 109. | ||
| 81,222 | 17,869 | 22 | 17,869 | 22 | Source Census: Linguistic knowledge 2004. | |||
| 13,000 | 12,000 | 92.31 | 12,000 | 92.31 | Source: Crystal (2003), p. 109. | |||
| 12,000 | 11,600 | 96.67 | 900 | 7.5 | 10,700 | 89.17 | English is spoken as the language of government and commerce. | |
| 20,200 | 4,000 | 19.8 | 1,000 | 4.95 | 3,000 | 14.85 | Source: Crystal (2003), p. 109. | |
| 5,900 | 4,000 | 67.8 | 4,000 | 67.8 | Source: Crystal (2003), p. 109. Note this includes speakers of an English creole. | |||
| 125,770,000 | 18,826,121 | 15 | 18,826,121 | 15 | [47] | |||
| 60,511,789 | 3,025,589 | 5 | 3,025,589 | 5 | Source: UNICEF, "Tanzania - The impact of language policy and practice on children’s learning: Evidence from Eastern and Southern Africa 2017" [48] | |||
| 15,766,292 | 3,500,000 | 22.2 | 3,500,000 | 22.2 | Source: Quote of a Ministry of Education spokesman [49] | |||
| World | 7,794,798,739 | 1,179,874,130 | 15.14 | 336,358,172 | 4.32 | 838,676,510 | 10.76 | |
 The European Union is a supranational union composed of 28 member states. The combined total English-speaking population (2012) is 256,876,220[50] (out of a total population of 500,000,000,[51] i.e. 51%) including 65,478,252 native speakers and 191,397,968 non-native speakers, and would be ranked 2nd if it were included. English native speakers amount to 13% of the whole Union population, while the percentage of people that speak English "well enough in order to be able to have a conversation", either as first (32%), second (11%) or third (3%) foreign language, was 38%.
- When taken from this list and added together, the total number of English speakers in the world adds up to around 1,200,000,000. Likewise, the total number of native English speakers adds up to around 350,000,000. This implies that there are approximately 850,000,000 people who speak English as an additional language.
See also
- EF English Proficiency Index
- English medium education
- English-speaking world
- List of countries where English is an official language
- World Englishes
Non-English speaking populations:
Notes
- Statistics on second language speakers are inevitably not precise; partly because there is no widely agreed definition of second language speakers – there is no differentiation between countries where English is the lingua franca and those where it is not.
- "Age by Language Spoken at Home by Ability to Speak English for the Population 5 Years and over: 2011–2015 American Community Survey 5-Year Estimates". U.S. Census Bureau. Retrieved 14 September 2017.
- S, Rukmini. "Sanskrit and English: there's no competition".
- http://www.censusindia.gov.in/Census_Data_2001/India_at_glance/popu1.aspx
- "Here's how Pakistan ranks among world's English speaking countries". The Express Tribune.
- "English — more than a subject". Dawn.
- "Mapped: The world by English-speaking population". The Telegraph. Retrieved 30 August 2017.
- "The World Factbook — Central Intelligence Agency". www.cia.gov. Retrieved 30 August 2017.
- "Which Countries Have the Most English Speakers? – K International". www.k-international.com. Retrieved 30 August 2017.
- Before mistakenly correcting the percentage again, please note that there are fewer people aged 5 years or more in any country than there are people in that country, because some people are toddlers or infants. In other words, no, the numbers will not automatically add up. 63.71% is what the cited source, text above Figure 7 Archived 26 December 2013 at the Wayback Machine, a report from the 2000 census, really says. This multiplied by the 2010 census's total population over 5 produces the number in the chart. The 2010 number comes from Philippines in Figures, 2013, Chapter 5, Demography Archived 26 December 2013 at the Wayback Machine, table 5.1 or 5.6
- From mid-2009 to late 2013 this entry overstated the number of native speakers by roughly 100fold, and inflated the number of total speakers, on the alleged basis of material in "Philippines". Ethnologue. 19 February 1999. Retrieved 16 October 2013.. In fact, Ethnologue as of 24 December 2013 simply repeats the number of native speakers, 20,000, reported in Crystal 2003, on the basis of an old (pre-1995) census, and does not address total speakers at all. This attempt to correct these errors in turn perpetrates both error and original research, by applying the old percentages listed above, 63.71% of people over 5 as total speakers in 2000, and .04% of people as native speakers in 1995, to the 2010 totals from Philippines in Figures, 2013, Chapter 5, Demography Archived 26 December 2013 at the Wayback Machine, tables 5.1 and 5.6. Andrew Gonzalez died in 2006; someone else's attention to the 2010 census figures, which appear not to be online and may not have been printed yet in adequate detail, is needed to produce reliable, more or less current, numbers.
- "Educational Characteristics of the Filipinos". 2000 Census of population and Housing. 18 March 2005. Archived from the original on 3 January 2017. Retrieved 12 May 2016.
- "2011 Census: Quick Statistics for England and Wales, March 2011". Office for National Statistics. Retrieved 30 January 2013.
- "Census 2016, Proficiency in Spoken English/Language by Age by Sex". Australian Bureau of Statistics. Retrieved 26 January 2021.
- The Benefits of the English Language for Individuals and Societies: Quantitative Indicators from Cameroon, Nigeria, Rwanda, Bangladesh and Pakistan, https://www.teachingenglish.org.uk/sites/teacheng/files/Euromonitor%20Report%20A4.pdf
- "The Benefits of the English Language for Individuals and Societies: Quantitative Indicators from Algeria, Egypt, Iraq, Jordan, Lebanon, Morocco, Tunisia and Yemen" (PDF). Britishcouncil.org. Archived from the original (PDF) on 13 May 2014. Retrieved 8 April 2016.
- Census 2011: Census in brief (PDF). Pretoria: Statistics South Africa. 2012. p. 30. ISBN 9780621413885. Archived (PDF) from the original on 13 May 2015.
- Human Capital in Poland in 2014, figure 15,52
- Demographics Yearbook of Poland: 2014, Table 1, 32,44,190,
- https://data.worldbank.org/indicator/SE.ADT.LITR.ZS?locations=ZW
- https://dhsprogram.com/pubs/pdf/FR254/FR254.pdf
- https://www.tandfonline.com/doi/abs/10.1080/02572117.2010.10587334?journalCode=rjal20
- http://www.ef.com/epi/
- "English Language Education in Sri Lanka". www.hltmag.co.uk. August 2018.
- Jian Yang (April 2006). "Learners and users of English in China". English Today. 22 (2): 3–10. doi:10.1017/S0266078406002021.. Quote: "What this suggests, it seems, is that Yan’s (2004) ten million may after all be a more informed estimate of the actual regular users of English in China." (page 9)"
- 100million is Back of Envelope Calculation. Learning English in compulsory in China, and 8% of population goes to University, so approximately 100 million are competent in English, and beyond learners
- "EF English Proficiency Index – A comprehensive ranking of countries by English skills". Ef.com. Retrieved 8 April 2016.
- Languages of Israel, Ethnologue.com
- Multilingualism in Israel, Bar-Ilan University – Faculty of Humanities : Language Policy Research Center.
- "ERIC – English Language Teaching Profile: Israel., 1976-Dec". Eric.ed.gov. Retrieved 8 April 2016.
- Eurobarometer 2012.
- "Bevölkerung 2001 nach Umgangssprache, Staatsangehörigkeit und Geburtsland". Statistik Austria. Retrieved 11 June 2020.
- Roy Campos; Ana María Hernández (January 2013). "Mexicanos Y Los Idiomas Extranjeros" (PDF). Archived from the original (PDF) on 10 October 2014. Retrieved 6 October 2014.
- "Resultados definitivos". Archived from the original on 24 August 2007. Retrieved 24 October 2007.
- Resident population according to main language, Federal Statistical Office, Neuchâtel 2008
- "The most complete list of English schools and courses in Ireland". Travbla.com. Retrieved 8 April 2016.
- "2010 Population & Housing Census" (PDF). Statsghana.gov.gh. Retrieved 8 April 2016.
- "Population Aged 5 and Over by Place of Birth, Usual Language and Ability to Speak Other Language/Dialect, 2011 (A123)". Census2011.gov.hk. Retrieved 8 April 2016.
- "Sociedad :: Los idiomas de los argentinos" (in Spanish). Página/12. Retrieved 16 October 2013.
- "¿Qué porcentaje de la población colombiana habla inglés?". Colombiestad.gov.co. 1 May 2006. Retrieved 8 April 2016.
- https://travel.state.gov/content/passports/english/country/colombia.htm. Retrieved 24 June 2017. Missing or empty
|title=(help) - "Islander Creole English". Ethnologue.
- "Special Reports | Brits Abroad". BBC News. Retrieved 8 April 2016.
- "2011 census of Bulgaria" (PDF). Retrieved 5 August 2016.
- "Síntesis de resultados Censo 2012" (PDF) (in Spanish). Instituto Nacional de Estadísticas. Retrieved 2 April 2013.
- Edrinnie Kayambizinthu (1998). "The Language Planning Situation in Malawi" (PDF). Journal of Multilingual and Multicultural Development. 19 (5&6): 369. doi:10.1080/01434639808666363. Archived from the original (PDF) on 11 September 2008.
- "Economic news" (in Japanese).
- ""Tanzania - The impact of language policy and practice on children's learning: Evidence from Eastern and Southern Africa 2017"" (PDF). www.unicef.org/. UNICEF.
- Bopha, Phorn (2016). "Bilingual Cambodians See Pathways to Progress". VOA Cambodia. Retrieved 8 December 2020.
- "European and their languages 2012" (PDF). Eurobarometer. Archived from the original (PDF) on 6 January 2016. Retrieved 2 January 2013.
- "Population at 1 January". Eurostat. Retrieved 2 January 2013.
References
- WizMantra Online
- Teachingenglish.org.uk
- Raymond G. Gordon, Jr., ed. (2005). "English". Ethnologue: Languages of the World (Fifteenth ed.). Dallas, Texas: SIL International. ISBN 1-55671-159-X. Retrieved 17 March 2006.
- Eurobarometer report – Europeans and their languages, February 2006 (pdf). Only includes EU citizens aged 15 and above.
- Eurobarometer report – Europeans and their languages, June 2012 (pdf). Only includes EU citizens aged 15 and above.
- Crystal, David (2003). The Cambridge Encyclopedia of the English Language (Second ed.). Cambridge, UK: Cambridge University Press. p. 109. ISBN 0-521-53033-4.
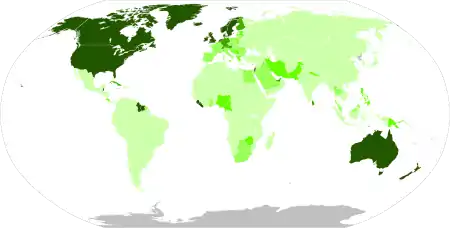
Click on a coloured area to see an article about English in that country or region Countries.png.webp) English speaking countries | |||||||||||||||||||||||||||||||||||||||
| |||||||||||||||||||||||||||||||||||||||
This article is issued from Wikipedia. The text is licensed under Creative Commons - Attribution - Sharealike. Additional terms may apply for the media files.