Berrien County, Georgia
Berrien County is a county located in the south central portion of the U.S. state of Georgia. As of the 2010 census, the population was 19,286.[1] The county seat is Nashville.[2] The county was created February 25, 1856 out of portions of Coffee, Irwin and Lowndes Counties by an act of the Georgia General Assembly. It is named after Georgia senator John M. Berrien.[3]
Berrien County | |
|---|---|
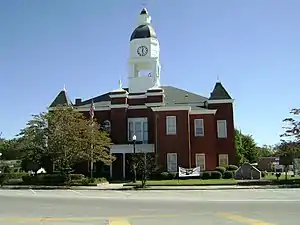 Berrien County courthouse in Nashville | |
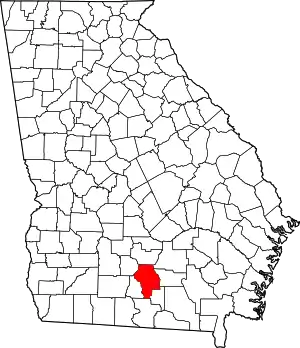 Location within the U.S. state of Georgia | |
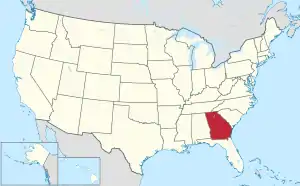 Georgia's location within the U.S. | |
| Coordinates: 31°16′N 83°14′W | |
| Country | |
| State | |
| Founded | 1856 |
| Named for | John M. Berrien |
| Seat | Nashville |
| Largest city | Nashville |
| Area | |
| • Total | 458 sq mi (1,190 km2) |
| • Land | 452. sq mi (1,170 km2) |
| • Water | 6.0 sq mi (16 km2) 1.3%% |
| Population | |
| • Estimate (2019) | 19,397 |
| • Density | 43/sq mi (17/km2) |
| Time zone | UTC−5 (Eastern) |
| • Summer (DST) | UTC−4 (EDT) |
| Congressional district | 8th |
| Website | www |
History
Establishment
The citizens of the area of Lowndes County and Irwin County that would become Berrien County had to travel long distances to get the county courthouse at Franklinville, Georgia and later Troupville, Georgia for those in Lowndes County, and Irwinville, Georgia for those in Irwin County. By at least June 1853, citizens had petitioned to form a new county.[4] The 1853 attempt of a new county failed. By 1856, a renewed attempt at the creation of a new county was successful.
World War I
Berrien County lost a disproportionate number of men in World War I in part because companies at that time were organized by militia districts at home. Eight weeks before the Armistice, 25 Berrien County men were among the 200 recently enlisted soldiers who perished at sea off the coast of Scotland.[5] Many of the bodies were returned to the soldiers' hometowns for burial, and the names of the dead were engraved on a memorial located on the courthouse grounds in Nashville. The memorial was the first in a series of pressed copper sculptures by artist E. M. Viquesney entitled The Spirit of the American Doughboy.
Geography
According to the U.S. Census Bureau, the county has a total area of 458 square miles (1,190 km2), of which 452 square miles (1,170 km2) is land and 6.0 square miles (16 km2) (1.3%) is water.[6]
The western portion of Berrien County, from just north of U.S. Route 82 and roughly west of U.S. Route 129 heading south, is located in the Withlacoochee River sub-basin of the Suwannee River basin. The eastern portion of the county is located in the Alapaha River sub-basin of the larger Suwannee River basin.[7]
Major highways
Adjacent counties
- Irwin County - north
- Coffee County - northeast
- Atkinson County - east
- Lanier County - southeast
- Lowndes County - south
- Cook County - west
- Tift County - northwest
Demographics
| Historical population | |||
|---|---|---|---|
| Census | Pop. | %± | |
| 1860 | 3,475 | — | |
| 1870 | 4,518 | 30.0% | |
| 1880 | 6,619 | 46.5% | |
| 1890 | 10,694 | 61.6% | |
| 1900 | 19,440 | 81.8% | |
| 1910 | 22,722 | 16.9% | |
| 1920 | 15,573 | −31.5% | |
| 1930 | 14,646 | −6.0% | |
| 1940 | 15,370 | 4.9% | |
| 1950 | 13,966 | −9.1% | |
| 1960 | 12,038 | −13.8% | |
| 1970 | 11,556 | −4.0% | |
| 1980 | 13,525 | 17.0% | |
| 1990 | 14,153 | 4.6% | |
| 2000 | 16,235 | 14.7% | |
| 2010 | 19,286 | 18.8% | |
| 2019 (est.) | 19,397 | [8] | 0.6% |
| U.S. Decennial Census[9] 1790-1960[10] 1900-1990[11] 1990-2000[12] 2010-2019[1] | |||
2000 census
As of the census[13] of 2000, there were 16,235 people, 6,261 households, and 4,539 families living in the county. The population density was 36 people per square mile (14/km2). There were 7,100 housing units at an average density of 16 per square mile (6/km2). The racial makeup of the county was 85.48% White, 11.43% Black or African American, 0.26% Native American, 0.30% Asian, 0.08% Pacific Islander, 1.53% from other races, and 0.92% from two or more races. 2.37% of the population were Hispanic or Latino of any race.
There were 6,261 households, out of which 34.90% had children under the age of 18 living with them, 56.20% were married couples living together, 11.70% had a female householder with no husband present, and 27.50% were non-families. 23.60% of all households were made up of individuals, and 10.00% had someone living alone who was 65 years of age or older. The average household size was 2.57 and the average family size was 3.03.
In the county, the population was spread out, with 27.20% under the age of 18, 8.60% from 18 to 24, 28.70% from 25 to 44, 22.90% from 45 to 64, and 12.50% who were 65 years of age or older. The median age was 35 years. For every 100 females there were 96.50 males. For every 100 females age 18 and over, there were 92.80 males.
The median income for a household in the county was $30,044, and the median income for a family was $34,643. Males had a median income of $25,559 versus $19,790 for females. The per capita income for the county was $16,375. About 14.60% of families and 17.70% of the population were below the poverty line, including 25.40% of those under age 18 and 13.00% of those age 65 or over.
2010 census
As of the 2010 United States Census, there were 19,286 people, 7,443 households, and 5,254 families living in the county.[14] The population density was 42.7 inhabitants per square mile (16.5/km2). There were 8,709 housing units at an average density of 19.3 per square mile (7.5/km2).[15] The racial makeup of the county was 84.7% white, 10.7% black or African American, 0.4% Asian, 0.3% American Indian, 2.6% from other races, and 1.3% from two or more races. Those of Hispanic or Latino origin made up 4.6% of the population.[14] In terms of ancestry, 28.8% were American, 14.4% were Irish, 8.2% were English, and 6.6% were German.[16]
Of the 7,443 households, 35.5% had children under the age of 18 living with them, 51.5% were married couples living together, 13.6% had a female householder with no husband present, 29.4% were non-families, and 25.2% of all households were made up of individuals. The average household size was 2.57 and the average family size was 3.05. The median age was 38.0 years.[14]
The median income for a household in the county was $32,202 and the median income for a family was $40,869. Males had a median income of $30,847 versus $22,277 for females. The per capita income for the county was $16,049. About 18.2% of families and 23.1% of the population were below the poverty line, including 32.8% of those under age 18 and 17.1% of those age 65 or over.[17]
Historical notes
Berrien Historical Foundation maintains Berrien Historical Photos website.
Communities
Unincorporated communities
Politics
| Year | Republican | Democratic | Third parties |
|---|---|---|---|
| 2020 | 82.9% 6,419 | 16.4% 1,269 | 0.7% 55 |
| 2016 | 82.3% 5,422 | 15.9% 1,047 | 1.8% 121 |
| 2012 | 77.8% 4,843 | 20.5% 1,273 | 1.7% 108 |
| 2008 | 76.0% 4,901 | 22.8% 1,471 | 1.3% 81 |
| 2004 | 69.9% 3,917 | 29.2% 1,638 | 0.9% 51 |
| 2000 | 61.6% 2,718 | 37.2% 1,640 | 1.2% 52 |
| 1996 | 42.9% 1,950 | 45.4% 2,066 | 11.7% 533 |
| 1992 | 36.0% 1,637 | 46.3% 2,103 | 17.7% 803 |
| 1988 | 59.4% 2,030 | 40.4% 1,381 | 0.3% 9 |
| 1984 | 58.9% 2,395 | 41.1% 1,670 | |
| 1980 | 33.8% 1,487 | 65.2% 2,869 | 1.1% 48 |
| 1976 | 14.1% 555 | 86.0% 3,394 | |
| 1972 | 86.0% 2,285 | 14.0% 371 | |
| 1968 | 14.8% 566 | 11.8% 452 | 73.4% 2,810 |
| 1964 | 60.5% 4,073 | 39.5% 2,658 | |
| 1960 | 11.7% 368 | 88.3% 2,787 | |
| 1956 | 6.4% 165 | 93.6% 2,398 | |
| 1952 | 14.3% 364 | 85.7% 2,187 | |
| 1948 | 5.0% 107 | 83.3% 1,772 | 11.7% 248 |
| 1944 | 12.8% 217 | 87.2% 1,481 | |
| 1940 | 2.0% 23 | 98.0% 1,156 | 0.1% 1 |
| 1936 | 3.0% 53 | 97.0% 1,700 | |
| 1932 | 1.3% 19 | 97.4% 1,447 | 1.3% 19 |
| 1928 | 12.5% 105 | 87.5% 735 | |
| 1924 | 3.0% 13 | 94.7% 409 | 2.3% 10 |
| 1920 | 8.5% 58 | 91.5% 623 | |
| 1916 | 2.2% 49 | 96.3% 2,102 | 1.5% 32 |
| 1912 | 8.6% 70 | 87.1% 709 | 4.3% 35 |
References
- "State & County QuickFacts". United States Census Bureau. Archived from the original on July 7, 2011. Retrieved June 18, 2014.
- "Find a County". National Association of Counties. Archived from the original on May 31, 2011. Retrieved June 7, 2011.
- Krakow, Kenneth K. (1975). Georgia Place-Names: Their History and Origins (PDF). Macon, GA: Winship Press. p. 17. ISBN 0-915430-00-2.
- "Flat Creek, June 18 1853". Albany Patriot. Albany, Georgia. July 1, 1853. Retrieved December 13, 2016.
- Otranto Sunk in Collision," New York Times, October 12, 1918.
- "US Gazetteer files: 2010, 2000, and 1990". United States Census Bureau. February 12, 2011. Retrieved April 23, 2011.
- "Georgia Soil and Water Conservation Commission Interactive Mapping Experience". Georgia Soil and Water Conservation Commission. Retrieved November 27, 2015.
- "Population and Housing Unit Estimates". Retrieved May 21, 2020.
- "U.S. Decennial Census". United States Census Bureau. Retrieved June 18, 2014.
- "Historical Census Browser". University of Virginia Library. Retrieved June 18, 2014.
- "Population of Counties by Decennial Census: 1900 to 1990". United States Census Bureau. Retrieved June 18, 2014.
- "Census 2000 PHC-T-4. Ranking Tables for Counties: 1990 and 2000" (PDF). United States Census Bureau. Retrieved June 18, 2014.
- "U.S. Census website". United States Census Bureau. Retrieved May 14, 2011.
- "DP-1 Profile of General Population and Housing Characteristics: 2010 Demographic Profile Data". United States Census Bureau. Archived from the original on February 13, 2020. Retrieved December 27, 2015.
- "Population, Housing Units, Area, and Density: 2010 - County". United States Census Bureau. Archived from the original on February 13, 2020. Retrieved December 27, 2015.
- "DP02 SELECTED SOCIAL CHARACTERISTICS IN THE UNITED STATES – 2006-2010 American Community Survey 5-Year Estimates". United States Census Bureau. Archived from the original on February 13, 2020. Retrieved December 27, 2015.
- "DP03 SELECTED ECONOMIC CHARACTERISTICS – 2006-2010 American Community Survey 5-Year Estimates". United States Census Bureau. Archived from the original on February 13, 2020. Retrieved December 27, 2015.
- Leip, David. "Dave Leip's Atlas of U.S. Presidential Elections". uselectionatlas.org. Retrieved March 18, 2018.
External links
- Official website
- Berrien County historical marker
Places adjacent to Berrien County, Georgia | ||||||||||
|---|---|---|---|---|---|---|---|---|---|---|
| ||||||||||
Municipalities and communities of Berrien County, Georgia, United States | ||
|---|---|---|
| Cities | Map of Georgia highlighting Berrien County | |
| Towns | ||
| Unincorporated communities | ||
| Footnotes | ‡This populated place also has portions in an adjacent county or counties. | |
| ||
| Authority control |
|---|