Chattahoochee County, Georgia
Chattahoochee County, also known as Cusseta-Chattahoochee County,[1] is a county located on the western border in central Georgia. As of the 2010 census, the population was 11,267.[2] The county seat is Cusseta,[3] with which the county shares a consolidated city-county government. The city of Cusseta remains a geographically distinct municipality within Chattahoochee County.[1][4] The county was created on February 13, 1854.
Chattahoochee County | |
|---|---|
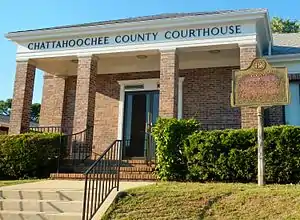 Chattahoochee County Courthouse in Cusseta | |
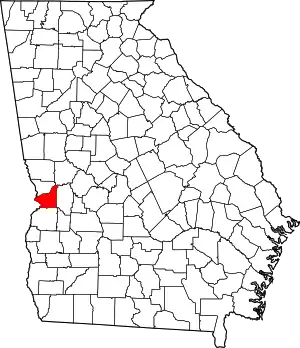 Location within the U.S. state of Georgia | |
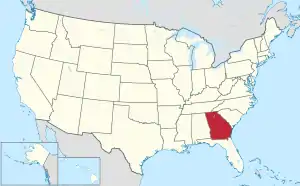 Georgia's location within the U.S. | |
| Coordinates: 32°21′N 84°47′W | |
| Country | |
| State | |
| Founded | 1854 |
| Named for | Chattahoochee River |
| Seat | Cusseta |
| Largest city | Cusseta |
| Area | |
| • Total | 251 sq mi (650 km2) |
| • Land | 249 sq mi (640 km2) |
| • Water | 2.4 sq mi (6 km2) 1.0%% |
| Population | |
| • Estimate (2019) | 10,907 |
| • Density | 45/sq mi (17/km2) |
| Time zone | UTC−5 (Eastern) |
| • Summer (DST) | UTC−4 (EDT) |
| Congressional district | 2nd |
| Website | www |
Chattahoochee County is included in the Columbus, GA-AL Metropolitan Statistical Area.
As of September 23, 2020, during the COVID-19 pandemic in the United States, the county had the highest infection rate of any county in the US, with 14,908 cases per 100,000 residents.[5]
History
This area was occupied by the historic Muscogee people (also known as the Creek), at the time of European encounter. They had a large confederacy in the Southeast. They were among the Five Civilized Tribes who were forcibly removed to Indian Territory in the 1830s during the administration of President Andrew Jackson. European Americans moved into their former areas, in some cases acquiring land through lotteries run by the state.
The Georgia General Assembly created Chattahoochee County on February 13, 1854, from portions of Muscogee and Marion counties. It is named for the Chattahoochee River that forms its western boundary.[6] The county seat was named Cusseta to commemorate the historic Creek Indian town of that name that long existed nearby. In 2004–2005, the US Census Bureau reported a 6.2% population decline, making this county at the top of those nationally with shrinking populations.
The original courthouse, built in 1854 by enslaved African Americans, is preserved at the tourist attraction of Westville in Columbus, Georgia.
Since 1918 most of the land in Chattahoochee County has been part of the Fort Benning military reservation.[7]
Geography
According to the U.S. Census Bureau, the county has a total area of 251 square miles (650 km2), of which 249 square miles (640 km2) is land and 2.4 square miles (6.2 km2) (1.0%) is water.[8]
The vast majority of Chattahoochee County is located in the Middle Chattahoochee River-Walter F. George Lake subbasin of the ACF River Basin (Apalachicola-Chattahoochee-Flint River Basin). The very small southeastern corner of the county is located in the Kinchafoonee-Muckalee subbasin of the same larger ACF Basin.[9]
Major highways
 U.S. Route 27
 U.S. Route 280
 State Route 1
 State Route 26
 State Route 355
 State Route 520
Adjacent counties
- Muscogee County (north)
- Talbot County (northeast)
- Marion County (east)
- Stewart County (south)
- Russell County, Alabama, (which is west of the border of Central Standard Time border except for Phenix City, Alabama, a part of the Columbus Metropolitan Area.)
Demographics
The county population has declined by more than half since its peak in 1970. People have left for job opportunities elsewhere.
| Historical population | |||
|---|---|---|---|
| Census | Pop. | %± | |
| 1860 | 5,797 | — | |
| 1870 | 6,059 | 4.5% | |
| 1880 | 5,670 | −6.4% | |
| 1890 | 4,902 | −13.5% | |
| 1900 | 5,790 | 18.1% | |
| 1910 | 5,586 | −3.5% | |
| 1920 | 5,266 | −5.7% | |
| 1930 | 8,894 | 68.9% | |
| 1940 | 15,138 | 70.2% | |
| 1950 | 12,149 | −19.7% | |
| 1960 | 13,011 | 7.1% | |
| 1970 | 25,813 | 98.4% | |
| 1980 | 21,732 | −15.8% | |
| 1990 | 16,934 | −22.1% | |
| 2000 | 14,882 | −12.1% | |
| 2010 | 11,267 | −24.3% | |
| 2019 (est.) | 10,907 | [10] | −3.2% |
| U.S. Decennial Census[11] 1790-1960[12] 1900-1990[13] 1990-2000[14] 2010-2019[2] | |||
2010 census
As of the 2010 United States Census, there were 11,267 people, 2,686 households, and 2,067 families residing in the county.[15] The population density was 45.3 inhabitants per square mile (17.5/km2). There were 3,376 housing units at an average density of 13.6 per square mile (5.3/km2).[16] The racial makeup of the county was 68.8% white, 18.8% black or African American, 2.2% Asian, 0.7% American Indian, 0.6% Pacific islander, 4.4% from other races, and 4.4% from two or more races. Those of Hispanic or Latino origin made up 12.4% of the population.[15] In terms of ancestry, 17.5% were German, 14.9% were Irish, 10.1% were English, 6.8% were Italian, and 3.1% were American.[17]
Of the 2,686 households, 53.7% had children under the age of 18 living with them, 57.0% were married couples living together, 16.2% had a female householder with no husband present, 23.0% were non-families, and 19.1% of all households were made up of individuals. The average household size was 2.98 and the average family size was 3.45. The median age was 24.0 years.[15] Although its population has declined, the county was notable in 2016 for having the highest proportion of millennials (persons 15–34 years old) of any county within the United States: 59.7%[18]
The median income for a household in the county was $51,089 and the median income for a family was $55,745. Males had a median income of $41,117 versus $31,422 for females. The per capita income for the county was $22,202. About 14.7% of families and 15.9% of the population were below the poverty line, including 18.4% of those under age 18 and 30.7% of those age 65 or over.[19]
Education
Politics
| Year | Republican | Democratic | Third parties |
|---|---|---|---|
| 2020 | 55.6% 880 | 42.2% 667 | 2.2% 35 |
| 2016 | 54.0% 751 | 42.7% 594 | 3.2% 45 |
| 2012 | 49.2% 735 | 48.8% 729 | 1.9% 29 |
| 2008 | 49.0% 811 | 50.1% 830 | 0.9% 15 |
| 2004 | 53.6% 905 | 45.7% 773 | 0.7% 12 |
| 2000 | 48.9% 590 | 49.7% 600 | 1.4% 17 |
| 1996 | 36.8% 398 | 52.2% 565 | 11.0% 119 |
| 1992 | 34.5% 413 | 50.4% 604 | 15.1% 181 |
| 1988 | 55.6% 454 | 44.3% 362 | 0.1% 1 |
| 1984 | 51.8% 459 | 48.3% 428 | |
| 1980 | 34.0% 256 | 63.3% 476 | 2.7% 20 |
| 1976 | 26.0% 178 | 74.0% 506 | |
| 1972 | 74.0% 345 | 26.0% 121 | |
| 1968 | 13.4% 70 | 28.4% 148 | 58.2% 303 |
| 1964 | 56.3% 246 | 43.7% 191 | |
| 1960 | 25.8% 66 | 74.2% 190 | |
| 1956 | 28.7% 43 | 71.3% 107 | |
| 1952 | 38.6% 73 | 61.4% 116 | |
| 1948 | 0.9% 1 | 39.7% 46 | 59.5%% 69 |
| 1944 | 16.0% 19 | 84.0% 100 | |
| 1940 | 8.9% 20 | 91.1% 204 | |
| 1936 | 8.9% 20 | 91.2% 206 | |
| 1932 | 0.5% 1 | 99.5% 186 | |
| 1928 | 11.3% 18 | 88.7% 141 | |
| 1924 | 6.2% 14 | 91.6% 208 | 2.2% 5 |
| 1920 | 5.4% 5 | 94.6% 87 | |
| 1916 | 2.4% 4 | 94.6% 156 | 3.0% 5 |
| 1912 | 7.4% 11 | 92.0% 137 | 0.7% 1 |
Communities
References
- "Cusseta-Chattahoochee County". GeorgiaGov. Retrieved March 19, 2018.
- "State & County QuickFacts". United States Census Bureau. Archived from the original on December 8, 2015. Retrieved June 19, 2014.
- "Find a County". National Association of Counties. Archived from the original on May 31, 2011. Retrieved June 7, 2011.
- "Cusseta". GeorgiaGov. Retrieved March 19, 2018.
- "Covid-19 cases per US county".
- Krakow, Kenneth K. (1975). Georgia Place-Names: Their History and Origins (PDF). Macon, GA: Winship Press. p. 39. ISBN 0-915430-00-2.
- Grimsley, Reagan. "Chattahoochee County". New Georgia Encyclopedia. Retrieved March 20, 2017.
- "US Gazetteer files: 2010, 2000, and 1990". United States Census Bureau. February 12, 2011. Retrieved April 23, 2011.
- "Georgia Soil and Water Conservation Commission Interactive Mapping Experience". Georgia Soil and Water Conservation Commission. Retrieved November 22, 2015.
- "Population and Housing Unit Estimates". Retrieved May 21, 2020.
- "U.S. Decennial Census". United States Census Bureau. Retrieved June 17, 2014.
- "Historical Census Browser". University of Virginia Library. Retrieved June 19, 2014.
- "Population of Counties by Decennial Census: 1900 to 1990". United States Census Bureau. Retrieved June 19, 2014.
- "Census 2000 PHC-T-4. Ranking Tables for Counties: 1990 and 2000" (PDF). United States Census Bureau. Retrieved June 19, 2014.
- "DP-1 Profile of General Population and Housing Characteristics: 2010 Demographic Profile Data". United States Census Bureau. Archived from the original on February 13, 2020. Retrieved December 27, 2015.
- "Population, Housing Units, Area, and Density: 2010 - County". United States Census Bureau. Archived from the original on February 13, 2020. Retrieved December 27, 2015.
- "DP02 SELECTED SOCIAL CHARACTERISTICS IN THE UNITED STATES – 2006-2010 American Community Survey 5-Year Estimates". United States Census Bureau. Archived from the original on February 13, 2020. Retrieved December 27, 2015.
- "What States and Counties Have the Most Millennials?". Overflow Data. November 14, 2016. Retrieved March 19, 2018.
- "DP03 SELECTED ECONOMIC CHARACTERISTICS – 2006-2010 American Community Survey 5-Year Estimates". United States Census Bureau. Archived from the original on February 13, 2020. Retrieved December 27, 2015.
- Leip, David. "Dave Leip's Atlas of U.S. Presidential Elections". uselectionatlas.org. Retrieved March 19, 2018.
External links
- Columbus Enquirer Archive Digital Library of Georgia
- Chattahoochee County historical marker
Places adjacent to Chattahoochee County, Georgia | ||||||||||
|---|---|---|---|---|---|---|---|---|---|---|
| ||||||||||
Municipalities and communities of Chattahoochee County, Georgia, United States | ||
|---|---|---|
| City | Map of Georgia highlighting Chattahoochee County | |
| Former CDP | ||
| Ghost towns | ||
| ||
| Central cities/Largest cities | 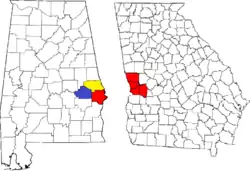 Location of the Columbus, Georgia-Auburn, Alabama CSA and its counties:
Columbus, Georgia Metropolitan Statistical Area
Auburn, Alabama Metropolitan Statistical Area
Tuskegee, Alabama Micropolitan Statistical Area (defunct) | |
|---|---|---|
| Cities in Georgia | ||
| Cities in Alabama | ||
| Counties in Georgia | ||
| Counties in Alabama | ||

| Authority control |
|---|