Wilkinson County, Georgia
Wilkinson County is a county located in the central portion of the U.S. state of Georgia. As of the 2010 census, the population was 9,563.[1] The county seat is Irwinton.[2] The county was created on May 11, 1803 and named for General James Wilkinson (1757–1825).[3]
Wilkinson County | |
|---|---|
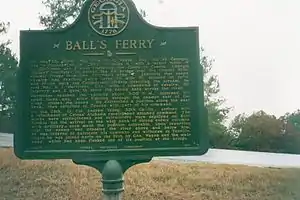 Ball's Ferry Landing has been designated as a site on the March to the Sea Heritage Trail. | |
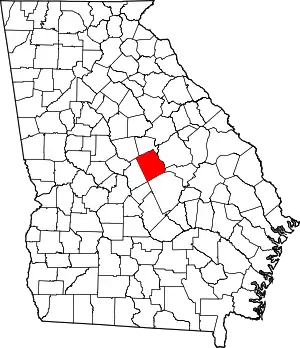 Location within the U.S. state of Georgia | |
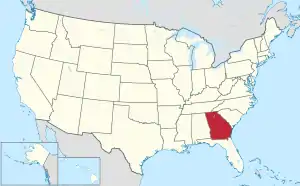 Georgia's location within the U.S. | |
| Coordinates: 32.80°N 83.17°W | |
| Country | |
| State | |
| Founded | May 11, 1803 |
| Named for | James Wilkinson |
| Seat | Irwinton |
| Largest city | Gordon |
| Area | |
| • Total | 452 sq mi (1,170 km2) |
| • Land | 447 sq mi (1,160 km2) |
| • Water | 4.6 sq mi (12 km2) 1.0% |
| Population | |
| • Estimate (2018) | 9,036 |
| • Density | 21/sq mi (8/km2) |
| Time zone | UTC−5 (Eastern) |
| • Summer (DST) | UTC−4 (EDT) |
| Congressional district | 8th |
| Website | www |
Geography
According to the U.S. Census Bureau, the county has a total area of 452 square miles (1,170 km2), of which 447 square miles (1,160 km2) is land and 4.6 square miles (12 km2) (1.0%) is water.[4] The county is located mainly in the upper Atlantic coastal plain region of the state, but does have some rolling hills due to its close proximity to the fall line.
The entirety of Wilkinson County is located in the Lower Oconee River sub-basin of the Altamaha River basin.[5]
Major highways
Adjacent counties
- Baldwin County (north)
- Bleckley County (south)
- Washington County (northeast)
- Johnson County (east)
- Laurens County (southeast)
- Twiggs County (southwest)
- Jones County (northwest)
Demographics
| Historical population | |||
|---|---|---|---|
| Census | Pop. | %± | |
| 1810 | 2,154 | — | |
| 1820 | 6,992 | 224.6% | |
| 1830 | 6,513 | −6.9% | |
| 1840 | 6,842 | 5.1% | |
| 1850 | 8,296 | 21.3% | |
| 1860 | 9,376 | 13.0% | |
| 1870 | 9,383 | 0.1% | |
| 1880 | 12,061 | 28.5% | |
| 1890 | 10,871 | −9.9% | |
| 1900 | 11,440 | 5.2% | |
| 1910 | 10,078 | −11.9% | |
| 1920 | 11,376 | 12.9% | |
| 1930 | 10,844 | −4.7% | |
| 1940 | 11,025 | 1.7% | |
| 1950 | 9,781 | −11.3% | |
| 1960 | 9,250 | −5.4% | |
| 1970 | 9,393 | 1.5% | |
| 1980 | 10,368 | 10.4% | |
| 1990 | 10,228 | −1.4% | |
| 2000 | 10,220 | −0.1% | |
| 2010 | 9,563 | −6.4% | |
| 2018 (est.) | 9,036 | [6] | −5.5% |
| U.S. Decennial Census[7] 1790-1960[8] 1900-1990[9] 1990-2000[10] 2010-2013[1] | |||
2000 census
As of the census[11] of 2000, there were 10,220 people, 3,827 households, and 2,805 families living in the county. The population density was 23 people per square mile (9/km2). There were 4,449 housing units at an average density of 10 per square mile (4/km2). The racial makeup of the county was 57.96% White, 40.70% Black or African American, 0.21% Native American, 0.07% Asian, 0.40% from other races, and 0.66% from two or more races. 0.99% of the population were Hispanic or Latino of any race.
There were 3,827 households, out of which 33.70% had children under the age of 18 living with them, 50.60% were married couples living together, 18.40% had a female householder with no husband present, and 26.70% were non-families. 24.10% of all households were made up of individuals, and 10.40% had someone living alone who was 65 years of age or older. The average household size was 2.65 and the average family size was 3.13.
In the county, the population was spread out, with 27.20% under the age of 18, 9.00% from 18 to 24, 28.10% from 25 to 44, 22.70% from 45 to 64, and 13.10% who were 65 years of age or older. The median age was 36 years. For every 100 females there were 90.60 males. For every 100 females age 18 and over, there were 88.10 males.
The median income for a household in the county was $32,723, and the median income for a family was $39,349. Males had a median income of $31,814 versus $21,461 for females. The per capita income for the county was $14,658. About 14.60% of families and 17.90% of the population were below the poverty line, including 24.90% of those under age 18 and 18.00% of those age 65 or over.
2010 census
As of the 2010 United States Census, there were 9,563 people, 3,666 households, and 2,638 families living in the county.[12] The population density was 21.4 inhabitants per square mile (8.3/km2). There were 4,487 housing units at an average density of 10.0 per square mile (3.9/km2).[13] The racial makeup of the county was 58.5% white, 38.4% black or African American, 0.3% Asian, 0.3% American Indian, 1.3% from other races, and 1.1% from two or more races. Those of Hispanic or Latino origin made up 2.2% of the population.[12] In terms of ancestry, and 14.7% were American.[14]
Of the 3,666 households, 33.6% had children under the age of 18 living with them, 47.9% were married couples living together, 18.3% had a female householder with no husband present, 28.0% were non-families, and 24.8% of all households were made up of individuals. The average household size was 2.58 and the average family size was 3.06. The median age was 41.1 years.[12]
The median income for a household in the county was $37,902 and the median income for a family was $49,138. Males had a median income of $39,009 versus $25,935 for females. The per capita income for the county was $17,929. About 17.9% of families and 23.1% of the population were below the poverty line, including 35.1% of those under age 18 and 21.9% of those age 65 or over.[15]
Education
Wilkinson County Primary/Elementary School[16]
Wilkinson County Middle/High School[16]
Wilkinson County is home of the 9-time state high school basketball class A champions.
Politics
Wilkinson County voted for every Democratic presidential nominee from 1828 to 1960; note that 1828 was the first year in which Georgia held a popular vote for presidential electors and also the first year in which the Democratic Party ran a presidential candidate. However, there was at least one example of Republican success in the county during Reconstruction: in the 1868 gubernatorial election, which was held in April, the Republican ticket swept the county, with Rufus Bullock receiving 59% of the vote; the Republican candidate for county ordinary won by just 1.7%.[17] Decades later, in the 1948 presidential election Harry Truman only won the county by one vote from States’ Rights candidate Strom Thurmond.
In 1964, Wilkinson County voted overwhelmingly for Barry Goldwater, the first Republican presidential nominee to win the county. It also delivered large victories to segregationist American Independent Party candidate George Wallace and Republican Richard Nixon in 1968 and 1972 respectively. In the presidential elections of both 1976 and 1980, former Georgia governor Jimmy Carter, a Democrat, won the county easily.
In 1984, Democrat Walter Mondale won the county by a 9% margin, which was only the second presidential result in the county within 30% since 1912. This was also the first time since 1848, when Whig Zachary Taylor narrowly won Georgia, that the county voted for a presidential candidate who did not win the state. In the following three presidential elections, Wilkinson continued to give Democratic candidates between 53% and 59% of the vote.
In 2000, Al Gore won Wilkinson County by a margin of 1.3%, or 84 votes, receiving 50.4% to George W. Bush's 48.1%. The county then voted for all three Republican nominees from 2004 to 2012, each time by a margin of less than 1.5%. In 2016, it voted for Donald Trump by a margin of just over 10%. Wilkinson was thus one of many counties in Georgia's historic black belt that demonstrated a significant swing in favor of Republican presidential candidates from 2012 to 2016. Similarly, the county swung from a 0.25% victory for the 2014 Democratic gubernatorial nominee[18] to an 11.63% victory for the 2018 Republican gubernatorial nominee.[19]
Even as it has become more favorable to Republicans at the state and federal level, Wilkinson's county government continues to be dominated by Democrats, to the extent that the Democratic primary is often tantamount to election. In 2016, Democrats won all six county executive offices without Republican opposition, as well as the three school board seats up for election that year. While the Republican district attorney for the district that includes Wilkinson was also unopposed, he received only 65.6% of ballots cast, compared to at least 72.4% for each unopposed Democratic countywide official.[20] In 2018, Democratic incumbents were reelected unopposed to two of the county's five commission seats unopposed and to a third seat by a 25% margin, as well as winning the race for commission chair unopposed. The Democratic candidate in the open first commission district lost, but by just 2.7%. Both school board members up that year were unopposed Democratic incumbents.[19]
Similarly, the overwhelming majority of primary voters in Wilkinson have chosen Democratic ballots even in recent years, presidential primaries excepted. In 2014, 2,022 of 2,174 primary voters (93.0%) chose Democratic ballots. In 2016, 1,726 of 2,033 primary voters (84.9%) did so, and in 2018, 1,186 of the 1,862 primary voters (63.7%) did so, even in the context of a competitive statewide Republican primary for governor.[21] Three incumbent county commissioners faced opponents in their 2018 primaries; the incumbent county commission chair lost, and the District 2 incumbent won by just one vote.[22]
| Year | Republican | Democratic | Third parties |
|---|---|---|---|
| 2020 | 55.9% 2,664 | 43.5% 2,075 | 0.6% 31 |
| 2016 | 54.4% 2,333 | 44.2% 1,894 | 1.4% 60 |
| 2012 | 50.4% 2,246 | 49.0% 2,181 | 0.7% 29 |
| 2008 | 50.2% 2,349 | 49.1% 2,298 | 0.7% 31 |
| 2004 | 50.0% 2,261 | 49.5% 2,235 | 0.5% 22 |
| 2000 | 48.1% 1,800 | 50.4% 1,884 | 1.5% 56 |
| 1996 | 34.1% 1,332 | 58.3% 2,278 | 7.7% 299 |
| 1992 | 30.3% 1,232 | 56.1% 2,286 | 13.6% 554 |
| 1988 | 45.3% 1,546 | 53.7% 1,831 | 1.1% 36 |
| 1984 | 45.5% 1,756 | 54.5% 2,102 | |
| 1980 | 31.6% 1,116 | 67.0% 2,365 | 1.5% 51 |
| 1976 | 24.0% 837 | 76.0% 2,652 | |
| 1972 | 74.5% 2,196 | 25.5% 751 | |
| 1968 | 20.2% 685 | 24.5% 829 | 55.3% 1,870 |
| 1964 | 69.3% 2,172 | 30.7% 963 | |
| 1960 | 32.3% 631 | 67.7% 1,324 | |
| 1956 | 23.2% 393 | 76.8% 1,299 | |
| 1952 | 18.8% 378 | 81.2% 1,629 | |
| 1948 | 8.7% 96 | 45.6% 501 | 45.7% 502[lower-alpha 1] |
| 1944 | 26.2% 271 | 73.8% 763 | |
| 1940 | 14.0% 147 | 86.0% 906 | 0.1% 1 |
| 1936 | 14.4% 118 | 85.0% 695 | 0.6% 5 |
| 1932 | 0.0% 0 | 100.0% 726 | |
| 1928 | 31.8% 227 | 68.2% 487 | |
| 1924 | 15.9% 56 | 80.5% 284 | 3.7% 13 |
| 1920 | 12.6% 37 | 87.4% 256 | |
| 1916 | 4.8% 20 | 88.5% 371 | 6.7% 28 |
| 1912 | 2.6% 10 | 94.3% 365 | 3.1% 12 |
Government
Current county officials:[24][25][26]
| Category | Specific office | Name | Party | Year of last election |
|---|---|---|---|---|
| Executive or judicial office | Clerk of Superior Court | Cinda Sloan Bright | D | 2016 |
| Executive or judicial office | Coroner | William “Billy” Matthews | D | 2016 |
| Executive or judicial office | Probate/Magistrate Judge | Vivian Lawrence Cummings | D | 2016 |
| Executive or judicial office | Sheriff | Richard Chatman | D | 2016 |
| Executive or judicial office | County Surveyor | Donald D. Brooks | D | 2016 |
| Executive or judicial office | Tax Commissioner | Vanessa Fountain | D | 2016 |
| Board of Commissioners | Chairman | Michael Gotell | D | 2018 |
| Board of Commissioners | District 1 | Glenn Kester | R | 2018 |
| Board of Commissioners | District 2 | James Hagins | D | 2018 |
| Board of Commissioners | District 3 | Vacant | (Was D) | 2018 |
| Board of Commissioners | District 4 | John Williams | D | 2018 |
| Board of Education | Chairman | Roger Smith | D | 2016 |
| Board of Education | District 1 | George W. Young | D | 2018 |
| Board of Education | District 2 | Kimberly S. Watkins | D | 2018 |
| Board of Education | District 3 | Leroy Strange | D | 2016 |
| Board of Education | District 4 | Charles Pitts | D | 2016 |
Notes
- The leading “other” candidate, Dixiecrat Strom Thurmond, received 500 votes, whilst Progressive Party nominee Henry A. Wallace and Prohibition Party nominee Claude A. Watson each received one vote.
References
- "State & County QuickFacts". United States Census Bureau. Retrieved June 27, 2014.
- "Find a County". National Association of Counties. Retrieved June 7, 2011.
- Krakow, Kenneth K. (1975). Georgia Place-Names: Their History and Origins (PDF). Macon, GA: Winship Press. p. 254. ISBN 0-915430-00-2.
- "US Gazetteer files: 2010, 2000, and 1990". United States Census Bureau. February 12, 2011. Retrieved April 23, 2011.
- "Georgia Soil and Water Conservation Commission Interactive Mapping Experience". Georgia Soil and Water Conservation Commission. Retrieved November 22, 2015.
- "Population and Housing Unit Estimates". Retrieved July 31, 2019.
- "U.S. Decennial Census". United States Census Bureau. Retrieved June 27, 2014.
- "Historical Census Browser". University of Virginia Library. Retrieved June 27, 2014.
- "Population of Counties by Decennial Census: 1900 to 1990". United States Census Bureau. Retrieved June 27, 2014.
- "Census 2000 PHC-T-4. Ranking Tables for Counties: 1990 and 2000" (PDF). United States Census Bureau. Retrieved June 27, 2014.
- "U.S. Census website". United States Census Bureau. Retrieved January 31, 2008.
- "DP-1 Profile of General Population and Housing Characteristics: 2010 Demographic Profile Data". United States Census Bureau. Archived from the original on February 13, 2020. Retrieved December 30, 2015.
- "Population, Housing Units, Area, and Density: 2010 - County". United States Census Bureau. Archived from the original on February 13, 2020. Retrieved December 30, 2015.
- "DP02 SELECTED SOCIAL CHARACTERISTICS IN THE UNITED STATES – 2006-2010 American Community Survey 5-Year Estimates". United States Census Bureau. Archived from the original on February 13, 2020. Retrieved December 30, 2015.
- "DP03 SELECTED ECONOMIC CHARACTERISTICS – 2006-2010 American Community Survey 5-Year Estimates". United States Census Bureau. Archived from the original on February 13, 2020. Retrieved December 30, 2015.
- Mason, J.A. (May 1, 1868). "Georgia Elections: Wilkinson County". The Georgia Weekly Telegraph. p. 3. Retrieved September 30, 2019.
- "Wilkinson - Election Results". ClarityElections. Georgia Secretary of State. November 10, 2014. Retrieved September 30, 2019.
- "Wilkinson - Election Results". ClarityElections. Georgia Secretary of State. November 13, 2018. Retrieved September 30, 2019.
- "Wilkinson - Election Results". ClarityElections. Georgia Secretary of State. November 15, 2016. Retrieved September 30, 2019.
- "Voter History Files". Georgia Secretary of State. Georgia Secretary of State. Retrieved September 30, 2019.
- "Wilkinson - Election Night Reporting". ClarityElections. Georgia Secretary of State. May 25, 2018. Retrieved September 30, 2019.
- Leip, David. "Dave Leip's Atlas of U.S. Presidential Elections". uselectionatlas.org. Retrieved March 24, 2018.
- "Commissioners". Wilkinson County. Wilkinson County Commission. Archived from the original on September 30, 2019. Retrieved September 30, 2019.
- "Board Members". Wilkinson County Schools. Wilkinson County Board of Education. Archived from the original on September 30, 2019. Retrieved September 30, 2019.
- "Qualifying Candidates". Georgia Secretary of State. Georgia Secretary of State. Retrieved September 30, 2019.
Places adjacent to Wilkinson County, Georgia | ||||||||||
|---|---|---|---|---|---|---|---|---|---|---|
| ||||||||||
Municipalities and communities of Wilkinson County, Georgia, United States | ||
|---|---|---|
| Cities | Map of Georgia highlighting Wilkinson County | |
| Towns | ||
| Ghost town | ||
| Footnotes | ‡This populated place also has portions in an adjacent county or counties | |
| ||
| Principal cities | 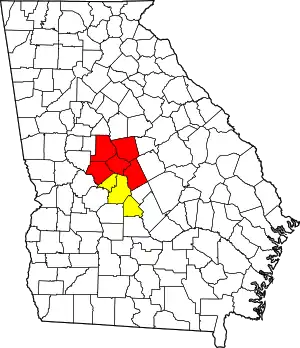 | |
|---|---|---|
| Municipalities | ||
| Other communities | ||
| Counties | ||
| CSA components | ||
| Authority control |
|---|