Fannin County, Georgia
Fannin County is a county located in the north central portion of the U.S. state of Georgia. As of the 2010 census, the population was 23,682.[1] The county seat is Blue Ridge.[2] The county was created on January 21, 1854.
Fannin County | |
|---|---|
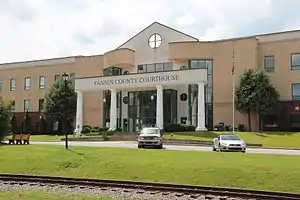 Fannin County Courthouse in Blue Ridge | |
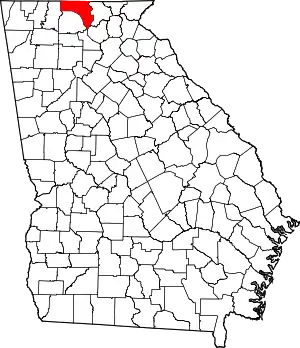 Location within the U.S. state of Georgia | |
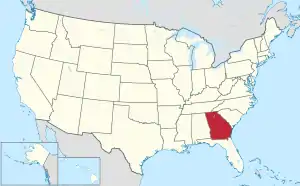 Georgia's location within the U.S. | |
| Coordinates: 34°52′N 84°19′W | |
| Country | |
| State | |
| Founded | 1854 |
| Named for | James Fannin |
| Seat | Blue Ridge |
| Largest city | Blue Ridge |
| Area | |
| • Total | 392 sq mi (1,020 km2) |
| • Land | 387 sq mi (1,000 km2) |
| • Water | 5.2 sq mi (13 km2) 1.3%% |
| Population | |
| • Estimate (2019) | 26,188 |
| • Density | 61/sq mi (24/km2) |
| Time zone | UTC−5 (Eastern) |
| • Summer (DST) | UTC−4 (EDT) |
| Congressional district | 9th |
| Website | fannincountyga |
History
Fannin County was founded in 1854.[3] The county is named for Georgia native James W. Fannin,[4] who fought and died during the Texas Revolution.
Although the county was majority pro-secession at the beginning of the Civil War, wartime conditions inspired a notable number of anti-Confederate "Tories" as early as 1862, many of whom re-located to pro-Union areas of Tennessee for the duration. This contributed to the postwar establishment of a countywide Republican Party earlier and more sustained than almost any other county in Georgia.[5]
Geography
According to the U.S. Census Bureau, the county has a total area of 392 square miles (1,020 km2), of which 387 square miles (1,000 km2) is land and 5.2 square miles (13 km2) (1.3%) is water.[6] The county is located in the Blue Ridge Mountains.[7]
The Toccoa River, which rises in adjacent Union County, flows northward across Fannin County into Tennessee, where it becomes the Ocoee River. Blue Ridge Lake, created in the 1930s by the completion of Blue Ridge Dam (now operated by the Tennessee Valley Authority), spans a substantial stretch of the river in the northern part of the county.
The vast majority of Fannin County is located in the Ocoee River sub-basin of the Middle Tennessee-Hiwassee basin. A very small northeastern portion of Fannin County is located in the Hiwassee River sub-basin of the same Middle Tennessee-Hiwassee basin. Illustrating that watershed boundaries and county boundaries have little in common, Fannin County's southernmost corner is located in the Etowah River sub-basin in the ACT River Basin (Coosa-Tallapoosa River Basin), while two slivers of the county's southwestern area are located in the Coosawattee River sub-basin of the same larger ACT River Basin. Finally, a western portion of the county is located in the Conasauga River sub-basin of the ACT River Basin.[8]
Adjacent counties
- Cherokee County, North Carolina - northeast
- Union County - east
- Dawson County - southeast
- Lumpkin County - southeast
- Gilmer County - southwest
- Murray County - west
- Polk County, Tennessee - northwest
National protected area
Transportation
Major highways
 U.S. Route 76
 State Route 2
 State Route 5
 State Route 60
 State Route 60 Spur
 State Route 515
Secondary highways
- Old U.S. Highway 76 Also Old S.R. 2
- Loving Road
- Old S.R. 2
- Aska Road
- Madola Road
- Lebanon Road
- Mobile Road
- Curtis Switch Road
- Galloway Road
- Doublehead Gap Road
- Skeenah Gap Road
Demographics
| Historical population | |||
|---|---|---|---|
| Census | Pop. | %± | |
| 1860 | 5,139 | — | |
| 1870 | 5,429 | 5.6% | |
| 1880 | 7,245 | 33.4% | |
| 1890 | 8,724 | 20.4% | |
| 1900 | 11,214 | 28.5% | |
| 1910 | 12,574 | 12.1% | |
| 1920 | 12,103 | −3.7% | |
| 1930 | 12,969 | 7.2% | |
| 1940 | 14,752 | 13.7% | |
| 1950 | 15,192 | 3.0% | |
| 1960 | 13,620 | −10.3% | |
| 1970 | 13,357 | −1.9% | |
| 1980 | 14,748 | 10.4% | |
| 1990 | 15,992 | 8.4% | |
| 2000 | 19,798 | 23.8% | |
| 2010 | 23,682 | 19.6% | |
| 2019 (est.) | 26,188 | [9] | 10.6% |
| U.S. Decennial Census[10] 1790-1960[11] 1900-1990[12] 1990-2000[13] 2010-2019[1] | |||
2000 census
As of the census[14] of 2000, there were 19,798 people, 8,369 households, and 6,008 families living in the county. The population density was 51 people per square mile (20/km2). There were 11,134 housing units at an average density of 29 per square mile (11/km2). The racial makeup of the county was 99.9% White, 0.2% Black or African American, 0.1% Native American, 0.2% Asian, 0.05% Pacific Islander, 0.0% from other races, and 0.0% from two or more races. 0.0% of the population were Hispanic or Latino of any race.
There were 8,369 households, out of which 25.90% had children under the age of 18 living with them, 59.80% were married couples living together, 8.90% had a female householder with no husband present, and 28.20% were non-families. 25.60% of all households were made up of individuals, and 12.80% had someone living alone who was 65 years of age or older. The average household size was 2.35 and the average family size was 2.80.
In the county, the population was spread out, with 20.90% under the age of 18, 7.00% from 18 to 24, 24.90% from 25 to 44, 28.20% from 45 to 64, and 19.00% who were 65 years of age or older. The median age was 43 years. For every 100 females there were 93.50 males. For every 100 females age 18 and over, there were 90.80 males.
The median income for a household in the county was $30,612, and the median income for a family was $35,258. Males had a median income of $28,728 versus $21,246 for females. The per capita income for the county was $16,269. About 10.20% of families and 12.40% of the population were below the poverty line, including 14.10% of those under age 18 and 14.20% of those age 65 or over.
2010 census
As of the 2010 United States Census, there were 23,682 people, 10,187 households, and 7,016 families living in the county.[15] The population density was 61.2 inhabitants per square mile (23.6/km2). There were 16,207 housing units at an average density of 41.9 per square mile (16.2/km2).[16] The racial makeup of the county was 97.1% white, 0.4% black or African American, 0.3% Asian, 0.3% American Indian, 0.7% from other races, and 1.2% from two or more races. Those of Hispanic or Latino origin made up 1.8% of the population.[15] In terms of ancestry, 18.6% were Irish, 13.3% were American, 11.5% were English, and 9.5% were German.[17]
Of the 10,187 households, 25.1% had children under the age of 18 living with them, 55.2% were married couples living together, 9.5% had a female householder with no husband present, 31.1% were non-families, and 27.1% of all households were made up of individuals. The average household size was 2.31 and the average family size was 2.77. The median age was 48.3 years.[15]
The median income for a household in the county was $34,145 and the median income for a family was $41,422. Males had a median income of $34,875 versus $27,097 for females. The per capita income for the county was $21,103. About 12.2% of families and 16.2% of the population were below the poverty line, including 23.0% of those under age 18 and 13.8% of those age 65 or over.[18]
Communities
Cities
Census-designated places
- Epworth
- Mineral Bluff (incorporated until 1995)
Other unincorporated communities
- Colwell (also known as Higdon)
- Deep Gap (also known as Due)
- Dial
- Fry
- Hemptown (also known as Hemp)
- Lakewood
- Margret
- Sugar Creek
- Wilscot
Politics
Fannin County, as an entirely white highland county historically devoid of slaves and culturally more allied to East Tennessee than to the rest of Georgia, constitutes an anomaly in the state's politics as a historically Republican county in a state that was overwhelmingly Democratic at a Presidential level until the 1960s and at other levels until the 1990s. Since the 1870s it has been solidly Republican. Fannin was the only county in the Deep South or West South Central States that never voted for Franklin D. Roosevelt, and the only three Democrats to win an absolute majority in the county since the Civil War have been Samuel J. Tilden in 1876, William Jennings Bryan in 1900 and Georgia native Jimmy Carter in 1976 when he carried every county in his home state.
The current county government consists of a three-member county commission consisting of a chairman and commissioners representing two posts.
| Year | Republican | Democratic | Third parties |
|---|---|---|---|
| 2020 | 82.0% 12,169 | 17.3% 2,571 | 0.7% 110 |
| 2016 | 81.1% 9,632 | 16.2% 1,923 | 2.7% 321 |
| 2012 | 78.1% 7,857 | 20.2% 2,028 | 1.7% 175 |
| 2008 | 73.4% 7,807 | 24.5% 2,611 | 2.1% 225 |
| 2004 | 71.0% 6,862 | 28.2% 2,727 | 0.8% 75 |
| 2000 | 65.1% 5,463 | 32.6% 2,736 | 2.3% 191 |
| 1996 | 48.7% 3,373 | 39.6% 2,741 | 11.8% 816 |
| 1992 | 45.2% 3,255 | 40.3% 2,902 | 14.4% 1038 |
| 1988 | 66.5% 4,271 | 33.0% 2,123 | 0.5% 33 |
| 1984 | 67.9% 4,159 | 32.1% 1,965 | |
| 1980 | 54.8% 3,196 | 43.3% 2,526 | 1.8% 107 |
| 1976 | 43.8% 2,646 | 56.3% 3,402 | |
| 1972 | 80.0% 3,783 | 20.1% 949 | |
| 1968 | 59.0% 3,475 | 20.9% 1,229 | 20.2% 1,188 |
| 1964 | 54.8% 3,433 | 45.2% 2,834 | 0.0% 1 |
| 1960 | 65.7% 3,022 | 34.3% 1,579 | |
| 1956 | 64.4% 3,521 | 35.6% 1,945 | |
| 1952 | 60.3% 2,904 | 39.7% 1,913 | |
| 1948 | 57.3% 2,790 | 41.0% 1,998 | 1.7% 82 |
| 1944 | 60.4% 1,980 | 39.6% 1,298 | |
| 1940 | 56.0% 2,256 | 44.0% 1,771 | |
| 1936 | 55.1% 1,890 | 44.9% 1,540 | |
| 1932 | 58.9% 1,967 | 41.1% 1,375 | 0.0% 0 |
| 1928 | 68.1% 1,730 | 31.9% 811 | |
| 1924 | 60.4% 1,650 | 39.5% 1,079 | 0.1% 3 |
| 1920 | 66.4% 1,083 | 33.6% 549 | |
| 1916 | 9.1% 166 | 39.6% 720 | 51.3% 933 |
| 1912 | 33.4% 309 | 48.8% 451 | 17.8% 164 |
References
- "State & County QuickFacts". United States Census Bureau. Archived from the original on June 7, 2011. Retrieved February 15, 2014.
- "Find a County". National Association of Counties. Archived from the original on May 31, 2011. Retrieved June 7, 2011.
- Krakow, Kenneth K. (1975). Georgia Place-Names: Their History and Origins (PDF). Macon, GA: Winship Press. p. 76. ISBN 0-915430-00-2.
- Gannett, Henry (1905). The Origin of Certain Place Names in the United States. Govt. Print. Off. pp. 123.
- A Separate Civil War: Communities in Conflict in the Mountain South, Jonathan Dean Sarris
- "US Gazetteer files: 2010, 2000, and 1990". United States Census Bureau. February 12, 2011. Retrieved April 23, 2011.
- Ripley, George; Dana, Charles A., eds. (1879). . The American Cyclopædia.
- "Georgia Soil and Water Conservation Commission Interactive Mapping Experience". Georgia Soil and Water Conservation Commission. Retrieved November 19, 2015.
- "Population and Housing Unit Estimates". Retrieved May 21, 2020.
- "U.S. Decennial Census". United States Census Bureau. Retrieved June 22, 2014.
- "Historical Census Browser". University of Virginia Library. Retrieved June 22, 2014.
- "Population of Counties by Decennial Census: 1900 to 1990". United States Census Bureau. Retrieved June 22, 2014.
- "Census 2000 PHC-T-4. Ranking Tables for Counties: 1990 and 2000" (PDF). United States Census Bureau. Retrieved June 22, 2014.
- "U.S. Census website". United States Census Bureau. Retrieved May 14, 2011.
- "DP-1 Profile of General Population and Housing Characteristics: 2010 Demographic Profile Data". United States Census Bureau. Archived from the original on February 13, 2020. Retrieved December 29, 2015.
- "Population, Housing Units, Area, and Density: 2010 - County". United States Census Bureau. Archived from the original on February 13, 2020. Retrieved December 29, 2015.
- "DP02 SELECTED SOCIAL CHARACTERISTICS IN THE UNITED STATES – 2006-2010 American Community Survey 5-Year Estimates". United States Census Bureau. Archived from the original on February 13, 2020. Retrieved December 29, 2015.
- "DP03 SELECTED ECONOMIC CHARACTERISTICS – 2006-2010 American Community Survey 5-Year Estimates". United States Census Bureau. Archived from the original on February 13, 2020. Retrieved December 29, 2015.
- Leip, David. "Dave Leip's Atlas of U.S. Presidential Elections". uselectionatlas.org. Retrieved March 19, 2018.
External links
- Fannin County Chamber of Commerce
- The News Observer
- Fannin County Website
- Fannin County historical marker
Places adjacent to Fannin County, Georgia | |
|---|---|
Municipalities and communities of Fannin County, Georgia, United States | ||
|---|---|---|
| Cities | Map of Georgia highlighting Fannin County | |
| CDPs | ||
| Unincorporated communities | ||
| Ghost towns | ||
| ||
| Authority control |
|---|