Randolph County, Georgia
Randolph County is a county located in the southwestern portion of the US state of Georgia and is considered part of the Black Belt, historically an area of plantations. As of the 2010 census, the population was 7,719,[1] less than half its peak population in 1910, when there were numerous agricultural workers. The county seat is Cuthbert.[2]
Randolph County | |
|---|---|
 The Randolph County Courthouse in Cuthbert was placed on the Georgia Trust for Historic Preservation's 2012 list of "Places in Peril" due to extensive termite damage and general disrepair. | |
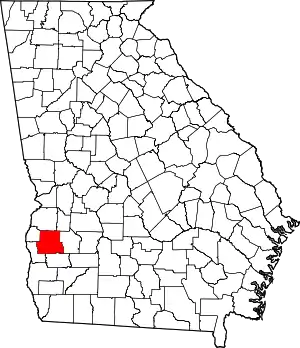 Location within the U.S. state of Georgia | |
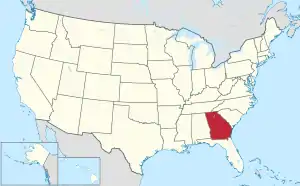 Georgia's location within the U.S. | |
| Coordinates: 31°46′N 84°46′W | |
| Country | |
| State | |
| Founded | December 20, 1828 |
| Named for | John Randolph of Roanoke |
| Seat | Cuthbert |
| Largest city | Cuthbert |
| Area | |
| • Total | 431 sq mi (1,120 km2) |
| • Land | 428 sq mi (1,110 km2) |
| • Water | 2.6 sq mi (7 km2) 0.6%% |
| Population | |
| • Estimate (2018) | 6,867 |
| • Density | 18/sq mi (7/km2) |
| Time zone | UTC−5 (Eastern) |
| • Summer (DST) | UTC−4 (EDT) |
| Congressional district | 2nd |
| Website | www |
History
Randolph County was created on December 20, 1828, and named after the Virginia planter and politician, John Randolph.[3]
He was honored originally as the namesake of present-day Jasper County but, because of his opposition to U.S. entry into the War of 1812, the Georgia General Assembly changed the county name on December 10, 1812. Eventually, John Randolph's reputation was restored. In 1828, the General Assembly organized the current Randolph County in the west of the state.[4] Most of the historic tribe of Muscogee people (Creek) were forced from the area to Indian Territory during Indian Removal.
Lumpkin, Georgia was the original county seat. It was within the portion of Randolph County that was reassigned in 1830 to form Stewart County, and Lumpkin was designated as the latter's county seat.
This area is considered part of the Black Belt, upland areas across the Deep South that were developed in the 19th century as plantations after invention of the cotton gin made processing of short-staple cotton profitable. Enslaved Blacks made up the vast majority of workers on the plantations, with hundreds of thousands being transported through the domestic slave trade from the coast and Upper South. After the American Civil War, many freedmen and their descendants continued to work on plantations in the county and region, comprising the majority of county population until the 1930s.
Like other areas of the rural South, workers in Randolph County lost jobs due to mechanization, invasion of the boll weevil, and the decline in agriculture. In the 20th century, many black families moved from the county to cities in the North and Midwest for work and less oppressive conditions during the Great Migration. However, the rural counties of the Black Belt continue to have substantial African-American populations. Agriculture has been industrialized and depends on relatively few workers.
By mid April 2020 Randolph County (including nearby Albany) hosted the third highest density of COVID-19 outbreaks in the nation, and as of May 2020, next to the New York Metro Area, and Boston, Massachusetts and metro area. Health department records showed an infection rate of 1.9 for every 100 citizens in Randolph County.[5] The Randolph county outbreak was largely composed of an outbreak in a nursing home and may have had connections to the Procter & Gamble toilet paper factory in Albany, Georgia, which was deemed an essential service.[6][7]
Geography
According to the U.S. Census Bureau, the county has a total area of 431 square miles (1,120 km2), of which 428 square miles (1,110 km2) is land and 2.6 square miles (6.7 km2) (0.6%) is water.[8]
More than half of Randolph County, roughly east of U.S. Route 27, is located in the Ichawaynochaway Creek sub-basin of the ACF River Basin (Apalachicola-Chattahoochee-Flint River Basin). The northwestern portion of the county, from just south of Cuthbert north, is located in the Middle Chattahoochee River-Walter F. George Lake sub-basin of the same ACF River Basin. The southwestern corner, centered on Coleman, is located in the Lower Chattahoochee River sub-basin of the same larger ACF River Basin.[9]
Major highways
 U.S. Route 27
 U.S. Route 27 Business
 U.S. Highway 82
 State Route 1
 State Route 1 Business
 State Route 41
 State Route 50
 State Route 216
 State Route 266
Adjacent counties
- Stewart County – north
- Webster County – northeast
- Terrell County – east
- Calhoun County – southeast
- Clay County – southwest
- Quitman County – west
Demographics
| Historical population | |||
|---|---|---|---|
| Census | Pop. | %± | |
| 1830 | 2,191 | — | |
| 1840 | 8,276 | 277.7% | |
| 1850 | 12,868 | 55.5% | |
| 1860 | 9,571 | −25.6% | |
| 1870 | 10,561 | 10.3% | |
| 1880 | 13,341 | 26.3% | |
| 1890 | 15,267 | 14.4% | |
| 1900 | 16,847 | 10.3% | |
| 1910 | 18,841 | 11.8% | |
| 1920 | 16,721 | −11.3% | |
| 1930 | 17,174 | 2.7% | |
| 1940 | 16,609 | −3.3% | |
| 1950 | 13,804 | −16.9% | |
| 1960 | 11,078 | −19.7% | |
| 1970 | 8,734 | −21.2% | |
| 1980 | 9,599 | 9.9% | |
| 1990 | 8,023 | −16.4% | |
| 2000 | 7,791 | −2.9% | |
| 2010 | 7,719 | −0.9% | |
| 2018 (est.) | 6,867 | [10] | −11.0% |
| U.S. Decennial Census[11] 1790-1960[12] 1900-1990[13] 1990-2000[14] 2010-2013[1] | |||
2010 census
As of the 2010 United States Census, there were 7,719 people, 3,187 households, and 2,011 families living in the county.[15] The population density was 18.0 inhabitants per square mile (6.9/km2). There were 4,153 housing units at an average density of 9.7 per square mile (3.7/km2).[16] The racial makeup of the county was 61.8% black or African American, 36.6% white, 0.3% Asian, 0.1% American Indian, 0.5% from other races, and 0.8% from two or more races. Those of Hispanic or Latino origin made up 1.5% of the population.[15] In terms of European-American ancestry, 11.7% identified as English, 8.1% were Irish, and 2.4% were American.[17]
Of the 3,187 households, 29.3% had children under the age of 18 living with them, 36.0% were married couples living together, 22.7% had a female householder with no husband present, 36.9% were non-families, and 33.5% of all households were made up of individuals. The average household size was 2.33 and the average family size was 2.97. The median age was 42.8 years.[15]
The median income for a household in the county was $26,194 and the median income for a family was $29,800. Males had a median income of $21,313 versus $23,542 for females. The per capita income for the county was $17,632. About 23.7% of families and 28.0% of the population were below the poverty line, including 53.2% of those under age 18 and 16.3% of those age 65 or over.[18]
2000 census
As of the census[19] of 2000, there were 7,791 people, 2,909 households, and 1,972 families living in the county. The population density was 18 people per square mile (7/km2). There were 3,402 housing units at an average density of 8 per square mile (3/km2). The racial makeup of the county was 59.47% Black or African American, 38.94% White, 0.35% Native American, 0.18% Asian, 0.12% Pacific Islander, 0.51% from other races, and 0.44% from two or more races. 1.18% of the population were Hispanic or Latino of any race.
There were 2,909 households, out of which 30.30% had children under the age of 18 living with them, 40.90% were married couples living together, 22.60% had a female householder with no husband present, and 32.20% were non-families. 30.00% of all households were made up of individuals, and 14.80% had someone living alone who was 65 years of age or older. The average household size was 2.57 and the average family size was 3.20.
In the county, the population was spread out, with 27.30% under the age of 18, 11.00% from 18 to 24, 24.20% from 25 to 44, 21.90% from 45 to 64, and 15.60% who were 65 years of age or older. The median age was 36 years. For every 100 females there were 85.90 males. For every 100 females age 18 and over, there were 78.10 males.
The median income for a household in the county was $22,004, and the median income for a family was $30,278. Males had a median income of $27,033 versus $20,394 for females. The per capita income for the county was $11,809. About 22.00% of families and 27.70% of the population were below the poverty line, including 36.20% of those under age 18 and 31.00% of those age 65 or over.
Communities
Unincorporated communities
Politics
| Year | Republican | Democratic | Third parties |
|---|---|---|---|
| 2020 | 45.2% 1,391 | 54.4% 1,671 | 0.4% 12 |
| 2016 | 43.8% 1,271 | 55.1% 1,598 | 1.0% 30 |
| 2012 | 41.5% 1,271 | 57.8% 1,770 | 0.6% 19 |
| 2008 | 42.6% 1,370 | 57.0% 1,833 | 0.4% 14 |
| 2004 | 46.5% 1,418 | 52.9% 1,612 | 0.7% 20 |
| 2000 | 45.7% 1,174 | 53.8% 1,381 | 0.5% 14 |
| 1996 | 34.2% 816 | 60.3% 1,438 | 5.4% 129 |
| 1992 | 30.0% 887 | 59.3% 1,756 | 10.7% 316 |
| 1988 | 48.9% 1,319 | 50.8% 1,369 | 0.3% 7 |
| 1984 | 52.0% 1,578 | 48.0% 1,454 | |
| 1980 | 32.1% 879 | 67.9% 1,861 | 0.1% 3 |
| 1976 | 25.5% 747 | 74.5% 2,186 | |
| 1972 | 66.8% 1,603 | 33.2% 798 | |
| 1968 | 16.9% 502 | 34.6% 1028 | 48.5% 1,438 |
| 1964 | 63.2% 1,656 | 36.7% 962 | 0.1% 3 |
| 1960 | 24.1% 457 | 75.9% 1,436 | |
| 1956 | 25.7% 547 | 74.3% 1,582 | |
| 1952 | 26.3% 507 | 73.7% 1,419 | |
| 1948 | 13.8% 134 | 59.3% 575 | 26.9% 261 |
| 1944 | 8.4% 106 | 91.6% 1,159 | |
| 1940 | 9.9% 143 | 90.0% 1,298 | 0.1% 2 |
| 1936 | 5.8% 74 | 93.9% 1,208 | 0.4% 5 |
| 1932 | 2.2% 31 | 97.2% 1,344 | 0.6% 8 |
| 1928 | 18.1% 177 | 81.9% 803 | |
| 1924 | 13.4% 88 | 79.0% 518 | 7.6% 50 |
| 1920 | 8.7% 51 | 91.3% 534 | |
| 1916 | 3.2% 23 | 90.7% 645 | 6.1% 43 |
| 1912 | 7.2% 44 | 83.9% 514 | 9.0% 55 |
References
- "State & County QuickFacts". United States Census Bureau. Retrieved June 25, 2014.
- "Find a County". National Association of Counties. Retrieved June 7, 2011.
- Krakow, Kenneth K. (1975). Georgia Place-Names: Their History and Origins (PDF). Macon, GA: Winship Press. p. 185. ISBN 0-915430-00-2.
- "GeorgiaInfo.com – Georgia Counties in Order of Creation". Archived from the original on February 18, 2008.
- "Coronavirus US cases by County". New York Times. April 14, 2020.
- "P&G Toilet Paper Factory Keeps Delivering as Coronavirus Strikes Its Town". Wall Street Journal. April 16, 2020.
- "New data shows Randolph County with new COVID-19 ranking". WFXL. April 15, 2020.
- "US Gazetteer files: 2010, 2000, and 1990". United States Census Bureau. February 12, 2011. Retrieved April 23, 2011.
- "Georgia Soil and Water Conservation Commission Interactive Mapping Experience". Georgia Soil and Water Conservation Commission. Retrieved November 24, 2015.
- "Population and Housing Unit Estimates". Retrieved July 31, 2019.
- "U.S. Decennial Census". United States Census Bureau. Retrieved June 25, 2014.
- "Historical Census Browser". University of Virginia Library. Retrieved June 25, 2014.
- "Population of Counties by Decennial Census: 1900 to 1990". United States Census Bureau. Retrieved June 25, 2014.
- "Census 2000 PHC-T-4. Ranking Tables for Counties: 1990 and 2000" (PDF). United States Census Bureau. Retrieved June 25, 2014.
- "DP-1 Profile of General Population and Housing Characteristics: 2010 Demographic Profile Data". United States Census Bureau. Archived from the original on February 13, 2020. Retrieved December 30, 2015.
- "Population, Housing Units, Area, and Density: 2010 - County". United States Census Bureau. Archived from the original on February 13, 2020. Retrieved December 30, 2015.
- "DP02 SELECTED SOCIAL CHARACTERISTICS IN THE UNITED STATES – 2006-2010 American Community Survey 5-Year Estimates". United States Census Bureau. Archived from the original on February 13, 2020. Retrieved December 30, 2015.
- "DP03 SELECTED ECONOMIC CHARACTERISTICS – 2006-2010 American Community Survey 5-Year Estimates". United States Census Bureau. Archived from the original on February 13, 2020. Retrieved December 30, 2015.
- "U.S. Census website". United States Census Bureau. Retrieved January 31, 2008.
- Leip, David. "Dave Leip's Atlas of U.S. Presidential Elections". uselectionatlas.org.
External links
![]() Media related to Randolph County, Georgia at Wikimedia Commons
Media related to Randolph County, Georgia at Wikimedia Commons
Places adjacent to Randolph County, Georgia | ||||||||||
|---|---|---|---|---|---|---|---|---|---|---|
| ||||||||||
Municipalities and communities of Randolph County, Georgia, United States | ||
|---|---|---|
| Cities | Map of Georgia highlighting Randolph County | |
| CDP | ||
| Unincorporated communities | ||
| ||

| Authority control |
|---|