Grady County, Georgia
Grady County is a county located in the U.S. state of Georgia. As of the 2010 census, the population was 25,011.[1] The county seat is Cairo.[2]
Grady County | |
|---|---|
.JPG.webp) | |
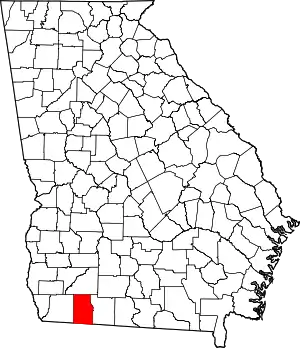 Location within the U.S. state of Georgia | |
 Georgia's location within the U.S. | |
| Coordinates: 30°53′N 84°14′W | |
| Country | |
| State | |
| Founded | August 17, 1905 |
| Named for | Henry W. Grady |
| Seat | Cairo |
| Largest city | Cairo |
| Area | |
| • Total | 460 sq mi (1,200 km2) |
| • Land | 455 sq mi (1,180 km2) |
| • Water | 5.7 sq mi (15 km2) 1.2%% |
| Population | |
| • Estimate (2018) | 24,748 |
| • Density | 55/sq mi (21/km2) |
| Time zone | UTC−5 (Eastern) |
| • Summer (DST) | UTC−4 (EDT) |
| Congressional district | 2nd |
| Website | www |
History
Grady County was created by an act of the Georgia General Assembly on August 17, 1905, from portions of Decatur and Thomas counties.
The county is named for Henry W. Grady, editor of the Atlanta Constitution and noted orator.[3]
Geography
According to the U.S. Census Bureau, the county has a total area of 460 square miles (1,200 km2), of which 455 square miles (1,180 km2) is land and 5.7 square miles (15 km2) (1.2%) is water.[4]
The bulk of Grady County, centered on Cairo, is located on the Upper Ochlockonee River sub-basin of the larger Ochlockonee River basin. The county's northwestern corner is located in the Lower Flint River sub-basin of the ACF River Basin (Apalachicola-Chattahoochee-Flint River Basin). Grady County's western border, from Whigham south, and all of its southern border, is located in the Lower Ochlockonee River sub-basin of the same Ochlockonee River basin. Finally, a very small chunk of the county's southeastern portion, bisected by U.S. Route 319, is located in the Apalachee Bay-St. Marks sub-basin of the Ochlockonee River basin.[5]
Grady County includes part of the Red Hills Region.
Major highways
 U.S. Route 84
 U.S. Route 319
 State Route 35
 State Route 38
 State Route 38 Spur
 State Route 93
 State Route 111
 State Route 112
 State Route 188
 State Route 262
Adjacent counties
- Mitchell County - north
- Thomas County - east
- Leon County, Florida - south
- Gadsden County, Florida - southwest
- Decatur County - west
Demographics
| Historical population | |||
|---|---|---|---|
| Census | Pop. | %± | |
| 1910 | 18,457 | — | |
| 1920 | 20,306 | 10.0% | |
| 1930 | 19,200 | −5.4% | |
| 1940 | 19,654 | 2.4% | |
| 1950 | 18,928 | −3.7% | |
| 1960 | 18,015 | −4.8% | |
| 1970 | 17,826 | −1.0% | |
| 1980 | 19,845 | 11.3% | |
| 1990 | 20,279 | 2.2% | |
| 2000 | 23,659 | 16.7% | |
| 2010 | 25,011 | 5.7% | |
| 2018 (est.) | 24,748 | [6] | −1.1% |
| U.S. Decennial Census[7] 1790-1960[8] 1900-1990[9] 1990-2000[10] 2010-2013[1] | |||
2000 census
As of the census of 2000, there were 23,659 people, 8,797 households, and 6,509 families living in the county. The population density was 52 people per square mile (20/km2). There were 9,991 housing units at an average density of 22 per square mile (8/km2). The racial makeup of the county was 64.61% White, 30.15% Black or African American, 0.92% Native American, 0.30% Asian, 0.01% Pacific Islander, 3.20% from other races, and 0.81% from two or more races. 5.17% of the population were Hispanic or Latino of any race.
There were 8,797 households, out of which 34.10% had children under the age of 18 living with them, 53.10% were married couples living together, 16.20% had a female householder with no husband present, and 26.00% were non-families. 22.40% of all households were made up of individuals, and 10.70% had someone living alone who was 65 years of age or older. The average household size was 2.66 and the average family size was 3.08.
In the county, the population was spread out, with 27.30% under the age of 18, 9.00% from 18 to 24, 27.90% from 25 to 44, 22.60% from 45 to 64, and 13.20% who were 65 years of age or older. The median age was 36 years. For every 100 females there were 90.60 males. For every 100 females age 18 and over, there were 87.40 males.
The median income for a household in the county was $28,656, and the median income for a family was $34,253. Males had a median income of $27,181 versus $20,128 for females. The per capita income for the county was $14,278. About 16.70% of families and 21.30% of the population were below the poverty line, including 29.90% of those under age 18 and 19.80% of those age 65 or over.
2010 census
As of the 2010 United States Census, there were 25,011 people, 9,418 households, and 6,730 families living in the county.[11] The population density was 55.0 inhabitants per square mile (21.2/km2). There were 10,760 housing units at an average density of 23.7 per square mile (9.2/km2).[12] The racial makeup of the county was 62.8% white, 28.7% black or African American, 0.7% American Indian, 0.4% Asian, 0.1% Pacific islander, 5.7% from other races, and 1.6% from two or more races. Those of Hispanic or Latino origin made up 10.0% of the population.[11] In terms of ancestry, 16.1% were American, 9.2% were English, and 8.6% were Irish.[13]
Of the 9,418 households, 35.9% had children under the age of 18 living with them, 49.6% were married couples living together, 16.7% had a female householder with no husband present, 28.5% were non-families, and 24.3% of all households were made up of individuals. The average household size was 2.63 and the average family size was 3.10. The median age was 37.8 years.[11]
The median income for a household in the county was $32,247 and the median income for a family was $39,159. Males had a median income of $32,396 versus $28,917 for females. The per capita income for the county was $17,785. About 22.0% of families and 25.9% of the population were below the poverty line, including 37.5% of those under age 18 and 18.7% of those age 65 or over.[14]
Education
Grady County Schools operates public schools.
Communities
Census-designated place
Unincorporated communities
- Beachton
- Pine Park
- Reno
- Roddenberry
- Spence
Politics
| Year | Republican | Democratic | Third parties |
|---|---|---|---|
| 2020 | 65.7% 7,034 | 33.8% 3,619 | 0.5% 54 |
| 2016 | 65.7% 6,053 | 32.7% 3,013 | 1.6% 147 |
| 2012 | 62.9% 5,924 | 36.3% 3,419 | 0.7% 70 |
| 2008 | 61.6% 5,775 | 37.8% 3,539 | 0.6% 57 |
| 2004 | 61.8% 5,068 | 37.7% 3,092 | 0.5% 41 |
| 2000 | 58.1% 3,894 | 40.6% 2,721 | 1.3% 88 |
| 1996 | 43.2% 2,674 | 46.3% 2,862 | 10.5% 649 |
| 1992 | 39.3% 2,370 | 41.8% 2,520 | 18.9% 1143 |
| 1988 | 61.1% 2,989 | 38.5% 1,883 | 0.4% 20 |
| 1984 | 63.2% 3,886 | 36.8% 2,261 | |
| 1980 | 39.4% 2,018 | 59.1% 3,023 | 1.5% 76 |
| 1976 | 24.3% 1,209 | 75.7% 3,758 | |
| 1972 | 81.0% 3,732 | 19.0% 874 | |
| 1968 | 9.7% 561 | 24.6% 1425 | 65.8% 3,817 |
| 1964 | 61.3% 2,983 | 38.8% 1,887 | |
| 1960 | 18.9% 592 | 81.1% 2,541 | |
| 1956 | 15.5% 496 | 84.5% 2,697 | |
| 1952 | 18.8% 643 | 81.2% 2,782 | |
| 1948 | 11.2% 244 | 69.5% 1,516 | 19.3% 420 |
| 1944 | 11.8% 223 | 88.2% 1,661 | |
| 1940 | 13.2% 224 | 86.1% 1,461 | 0.7% 12 |
| 1936 | 8.9% 163 | 90.7% 1,659 | 0.4% 7 |
| 1932 | 2.7% 60 | 96.9% 2,184 | 0.4% 10 |
| 1928 | 27.3% 439 | 72.8% 1,172 | |
| 1924 | 6.4% 100 | 92.1% 1,449 | 1.6% 25 |
| 1920 | 20.7% 232 | 79.3% 887 | |
| 1916 | 10.5% 84 | 84.6% 675 | 4.9% 39 |
| 1912 | 1.7% 8 | 94.0% 452 | 4.4% 21 |
References
- "State & County QuickFacts". United States Census Bureau. Retrieved June 22, 2014.
- "Find a County". National Association of Counties. Archived from the original on May 31, 2011. Retrieved June 7, 2011.
- Krakow, Kenneth K. (1975). Georgia Place-Names: Their History and Origins (PDF). Macon, GA: Winship Press. p. 96. ISBN 0-915430-00-2.
- "US Gazetteer files: 2010, 2000, and 1990". United States Census Bureau. February 12, 2011. Retrieved April 23, 2011.
- "Georgia Soil and Water Conservation Commission Interactive Mapping Experience". Georgia Soil and Water Conservation Commission. Retrieved November 24, 2015.
- "Population and Housing Unit Estimates". United States Census Bureau. Retrieved July 30, 2019.
- "U.S. Decennial Census". United States Census Bureau. Retrieved June 22, 2014.
- "Historical Census Browser". University of Virginia Library. Retrieved June 22, 2014.
- "Population of Counties by Decennial Census: 1900 to 1990". United States Census Bureau. Retrieved June 22, 2014.
- "Census 2000 PHC-T-4. Ranking Tables for Counties: 1990 and 2000" (PDF). United States Census Bureau. Retrieved June 22, 2014.
- "DP-1 Profile of General Population and Housing Characteristics: 2010 Demographic Profile Data". United States Census Bureau. Archived from the original on February 13, 2020. Retrieved December 29, 2015.
- "Population, Housing Units, Area, and Density: 2010 - County". United States Census Bureau. Archived from the original on February 13, 2020. Retrieved December 29, 2015.
- "DP02 SELECTED SOCIAL CHARACTERISTICS IN THE UNITED STATES – 2006-2010 American Community Survey 5-Year Estimates". United States Census Bureau. Archived from the original on February 13, 2020. Retrieved December 29, 2015.
- "DP03 SELECTED ECONOMIC CHARACTERISTICS – 2006-2010 American Community Survey 5-Year Estimates". United States Census Bureau. Archived from the original on February 13, 2020. Retrieved December 29, 2015.
- Leip, David. "Dave Leip's Atlas of U.S. Presidential Elections". Uselectionatlas.org. Retrieved November 22, 2017.
External links
- Grady County historical marker
- GeorgiaInfo Grady County Courthouse history
- The New Georgia Encyclopedia entry for Grady County
Places adjacent to Grady County, Georgia | ||||||||||
|---|---|---|---|---|---|---|---|---|---|---|
| ||||||||||
Municipalities and communities of Grady County, Georgia, United States | ||
|---|---|---|
| Cities | Map of Georgia highlighting Grady County | |
| CDP | ||
| Unincorporated communities | ||
| Indian reservation | ||
| ||

| Authority control |
|---|