Bellingen Shire
Bellingen Shire is a local government area in the mid north coast region of New South Wales, Australia. The Shire is located adjacent to the Pacific Highway, Waterfall Way and the North Coast railway line.
| Bellingen Shire New South Wales | |||||||||||||||
|---|---|---|---|---|---|---|---|---|---|---|---|---|---|---|---|
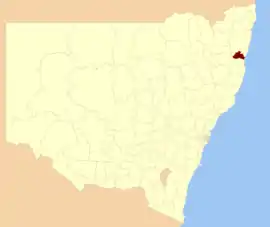 Location in New South Wales | |||||||||||||||
| Coordinates | 30°27′S 152°54′E | ||||||||||||||
| Population |
| ||||||||||||||
| • Density | 7.9076/km2 (20.481/sq mi) | ||||||||||||||
| Area | 1,602 km2 (618.5 sq mi) | ||||||||||||||
| Mayor | Dominic King (Greens) | ||||||||||||||
| Council seat | Bellingen | ||||||||||||||
| Region | Mid North Coast | ||||||||||||||
| State electorate(s) | Oxley | ||||||||||||||
| Federal Division(s) | Cowper | ||||||||||||||
| Website | Bellingen Shire | ||||||||||||||
| |||||||||||||||
The Mayor of the Bellingen Shire is Cr. Dominic King, a member of the Greens.[3]
Towns and localities
Towns and localities in the Bellingen Shire are:
Demographics
At the 2011 census, there were 12,518 people in the Bellingen local government area, of these 48.5 per cent were male and 51.5 per cent were female. Aboriginal and Torres Strait Islander people made up 3.0 per cent of the population which is higher than the national and state averages of 2.5 per cent. The median age of people in the Bellingen Shire was 46 years; some 10 years higher than the national median. Children aged 0 – 14 years made up 19.5 per cent of the population and people aged 65 years and over made up 19.9 per cent of the population. Of people in the area aged 15 years and over, 46.1 per cent were married and 17.4 per cent were either divorced or separated.[4]
Population growth in the Bellingen Shire between the 2001 census, 2006 census, and the 2011 census was marginal. When compared with total population growth of Australia for the same periods, being 5.78 per cent and 8.32 per cent respectively, population growth in the Bellingen local government area was significantly lower than the national average.[5] The median weekly income for residents within the Bellingen Shire was significantly below the national average,[4][6] being one of the factors that place the Bellingen Shire in an area of social disadvantage.
At the 2011 Census, the proportion of residents in the Bellingen local government area who stated their ancestry as Australian or Anglo-Celtic exceeded 82 per cent of all residents (national average was 65.2 per cent). In excess of 69 per cent of all residents in the Bellingen Shire nominated a religious affiliation with Christianity at the 2011 Census, which was significantly above the national average of 50.2 per cent. Meanwhile, as at the Census date, compared to the national average, households in the Bellingen local government area had a significantly lower than average proportion (4.7 per cent) where two or more languages are spoken (national average was 20.4 per cent); and a significantly higher proportion (94.1 per cent) where English only was spoken at home (national average was 76.8 per cent).[4]
| Selected historical census data for Bellingen local government area | ||||||
|---|---|---|---|---|---|---|
| Census year | 2001[5] | 2006[6] | 2011[4] | 2016[1] | ||
| Population | Estimated residents on census night | 12,171 | ||||
| LGA rank in terms of size within New South Wales | 85th | |||||
| % of New South Wales population | 0.18% | |||||
| % of Australian population | 0.06% | |||||
| Cultural and language diversity | ||||||
| Ancestry, top responses | English | 32.3% | ||||
| Australian | 31.5% | |||||
| Irish | 10.3% | |||||
| Scottish | 8.7% | |||||
| German | 3.4% | |||||
| Language, top responses (other than English) | German | 0.8% | ||||
| Dutch | 0.2% | |||||
| Spanish | n/c | |||||
| French | 0.2% | |||||
| Cantonese | 0.2% | |||||
| Religious affiliation | ||||||
| Religious affiliation, top responses | No Religion | 20.5% | ||||
| Anglican | 26.8% | |||||
| Catholic | 18.0% | |||||
| Uniting Church | 9.1% | |||||
| Presbyterian and Reformed | 3.4% | |||||
| Median weekly incomes | ||||||
| Personal income | Median weekly personal income | A$336 | A$416 | |||
| % of Australian median income | 72.1% | 72.1% | ||||
| Family income | Median weekly family income | A$622 | A$938 | |||
| % of Australian median income | 60.6% | 63.3% | ||||
| Household income | Median weekly household income | A$777 | A$787 | |||
| % of Australian median income | 66.4% | 63.8% | ||||
Council
Bellingen Shire Council is composed of seven Councillors, including the Mayor, for a fixed four-year term of office. The Mayor is directly elected while the six other Councillors are elected proportionally as one entire ward. The most recent election was held on 10 September 2016, and the makeup of the Council, including the Mayor, is as follows:[3][7]
| Party | Councillors | |
|---|---|---|
| Independents and Unaffiliated | 4 | |
| The Greens | 3 | |
| Total | 7 | |
The current Council, elected in 2012, in order of election, is:[8]
| Councillor | Party | Notes | |
|---|---|---|---|
| Dominic King | Greens | Mayor | |
| Jennie Fenton | Greens | ||
| Garry Carter | Unaligned | ||
| Steve Jenkins | Independent | ||
| Steve Klipin | Independent | ||
| Toni Wright-Turner | Greens | ||
| Desmae Harrison | Independent | ||
References
- Australian Bureau of Statistics (27 June 2017). "Bellingen (A)". 2016 Census QuickStats. Retrieved 7 July 2017.

- "3218.0 – Regional Population Growth, Australia, 2017-18". Australian Bureau of Statistics. 27 March 2019. Retrieved 27 March 2019. Estimated resident population (ERP) at 30 June 2018.
- "Bellingen Shire Council - Mayoral Election". Local Government Elections 2016. Electoral Commission of New South Wales. 20 September 2016. Retrieved 13 October 2016.
- Australian Bureau of Statistics (31 October 2012). "Bellingen (A)". 2011 Census QuickStats. Retrieved 30 November 2012.
- Australian Bureau of Statistics (9 March 2006). "Bellingen (A)". 2001 Census QuickStats. Retrieved 27 November 2012.
- Australian Bureau of Statistics (25 October 2007). "Bellingen (A)". 2006 Census QuickStats. Retrieved 30 November 2012.
- "Bellingen Shire Council: Summary of First Preference and Group Votes for each Candidate". Local Government Elections 2016. Electoral Commission of New South Wales. 20 September 2016. Retrieved 13 October 2016.
- "Bellingen Shire Election Results". Electoral Commission of New South Wales. 16 September 2016. Retrieved 18 September 2016.