2020 United States presidential election in Pennsylvania
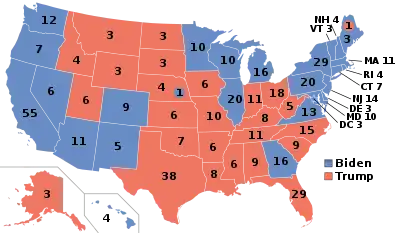
The 2020 United States presidential election in Pennsylvania was held on Tuesday, November 3, 2020, as part of the 2020 United States presidential election in which all 50 states plus the District of Columbia participated.[2] Pennsylvania voters chose electors to represent them in the Electoral College via a popular vote, pitting the Republican Party's nominee, incumbent President Donald Trump, and running mate Vice President Mike Pence against Democratic Party nominee, former Vice President Joe Biden, and his running mate California Senator Kamala Harris. Pennsylvania has 20 electoral votes in the Electoral College.[3]
| ||||||||||||||||||||||||||
| Turnout | 70.93%[1] | |||||||||||||||||||||||||
|---|---|---|---|---|---|---|---|---|---|---|---|---|---|---|---|---|---|---|---|---|---|---|---|---|---|---|
| ||||||||||||||||||||||||||
 County results
| ||||||||||||||||||||||||||
| ||||||||||||||||||||||||||
.jpg.webp)
| Elections in Pennsylvania |
|---|
 |
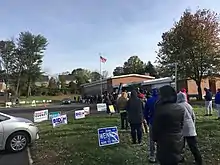
Although Trump had won the state in 2016 by a narrow margin of 0.72%, Biden was able to reclaim the state, winning it by 1.17%. Because of the way the state counted in-person ballots first, Trump started with a wide lead on election night. However, over the next few days, Biden greatly closed the margin due to outstanding votes from Democratic-leaning areas, most notably Philadelphia and Pittsburgh, as well as mail-in ballots from all parts of the state which strongly favored him. On the morning of November 6, election-calling organization Decision Desk HQ forecast that Biden had won Pennsylvania's 20 electoral votes, and with them the election.[4] The following morning, November 7, during a Trump campaign press conference outside a Philadelphia landscaping business,[5] nearly all major news organizations followed suit and called Pennsylvania for Biden, proclaiming him President-elect.[6]
After worse than expected results for Republicans in the 2018 midterm elections, Pennsylvania had been expected to have a close result again in the 2020 election.[7] Throughout the campaign however, polls generally showed a Biden lead. Prior to election day 14 of the 15 news organizations considered that Pennsylvania was leaning towards Biden.
State Republicans sought to require that only mail-in ballots received by Election Day be counted. The Commonwealth's Supreme Court rejected their demands, deciding that, due to probable delays due to the ongoing coronavirus and U.S. Postal Service crises, ballots received up to three days after Election Day would also be counted.[8] Republicans then appealed the decision to the U.S. Supreme Court. Supreme Court justices produced a 4–4 tie (as the late Ruth Bader Ginsburg's seat remained vacant when the ruling was issued), with Chief Justice John Roberts siding with the three liberal justices, allowing the state supreme court decision to stand.[8]
One key to Biden's success in the state was his improvement on Hillary Clinton's margins in the large Philadelphia-area suburban counties: he won Bucks by 3.60% more than Clinton did, Delaware by 4.38% more, Montgomery by 4.80% more, and Chester—which Mitt Romney had narrowly won just eight years prior—by 6.60% more. At the same time, he reclaimed two of the three large industrial counties which had voted Democratic for at least six consecutive elections before Trump flipped them in 2016: Erie and Northampton. While Trump prevailed in the third, Luzerne County, he did so by a reduced margin with respect to 2016; and Biden increased the margin of victory in his birth county, Lackawanna County, which Trump had nearly flipped in 2016. Biden even halted the four-election Democratic slide in formerly traditionally Democratic Westmoreland County, where, before 2020, Al Gore had been the last Democrat to improve on the previous nominee's vote share (and which had given Trump his margin in the state in 2016). However, Biden's vote share in Philadelphia County actually declined slightly compared to Hillary Clinton's, although he still outperformed either Al Gore in 2000 or John Kerry in 2004 in the county.
Pennsylvania is tied for the longest perfect streak with Michigan and Wisconsin; none of the three have backed the losing candidate since after 2004, when all three backed Democratic nominee John Kerry--albeit narrowly--but incumbent President George W. Bush was re-elected. Pennsylvania weighed in for this election as 3.28% more Republican than the national average. This is the second consecutive presidential election in which Pennsylvania voted to the right of the nation; previously, it had not done so since 1948.
Primary elections
The primary elections were originally scheduled for April 28, 2020, also originally joining several northeastern states in holding primaries on the same date, including Connecticut, Delaware, Maryland, New York, and Rhode Island.[9] On March 26, Pennsylvania joined several other states in moving its primary to June 2 due to the COVID-19 pandemic.[10]
Republican primary
Even though the Republican National Committee mailed Pennsylvania voters encouraging mail-in voting, describing it as a "convenient and secure” option, most Republicans expressed opposition to the prospect. Earlier, the Republican-controlled House blocked a proposal to mail every Pennsylvanian a mail-in ballot application. This was in response to President Trump's skepticism of the practice, expressing concern mail-in voting may result in voter fraud that would potentially benefit the Democratic Party.[11]
| Candidate | Votes | % | Delegates[13] |
|---|---|---|---|
| Donald Trump | 1,053,616 | 92.1% | 34 |
| Bill Weld | 69,427 | 6.1% | 0 |
| Rocky De La Fuente | 20,456 | 1.8% | 0 |
| Total | 1,143,499 | 100% | 34 |
Trump was declared the winner in the Republican primary, and received all of the state's 34 pledged delegates to the 2020 Republican National Convention (the state also has 54 unpledged delegates).[13]
Democratic primary
| Candidate | Votes | % | Delegates[15] |
|---|---|---|---|
| Joe Biden | 1,264,624 | 79.26% | 151 |
| Bernie Sanders (suspended) | 287,834 | 18.04% | 35 |
| Tulsi Gabbard (withdrawn) | 43,050 | 2.70% | 0 |
| Total | 1,595,508 | 100% | 186 |
Green Caucus
The Green Caucus was held during April 2020 and was won by Howie Hawkins.[16]
General election
Predictions
| Source | Ranking | As of |
|---|---|---|
| Princeton Electoral Consortium[17] | Safe D (flip) | October 5, 2020 |
| The Cook Political Report[18] | Lean D (flip) | October 5, 2020 |
| Inside Elections[19] | Lean D (flip) | October 5, 2020 |
| Sabato's Crystal Ball[20] | Lean D (flip) | October 5, 2020 |
| Politico[21] | Lean D (flip) | October 5, 2020 |
| RCP[22] | Tossup | October 5, 2020 |
| Niskanen[23] | Likely D (flip) | October 5, 2020 |
| CNN[24] | Lean D (flip) | October 23, 2020 |
| The Economist[25] | Likely D (flip) | October 5, 2020 |
| CBS News[26] | Lean D (flip) | October 5, 2020 |
| 270towin[27] | Lean D (flip) | October 5, 2020 |
| ABC News[28] | Likely D (flip) | October 5, 2020 |
| NPR[29] | Lean D (flip) | October 5, 2020 |
| NBC News[30] | Lean D (flip) | October 5, 2020 |
| 538[31] | Likely D (flip) | October 5, 2020 |
Graphical summary
Aggregate polls
| Source of poll aggregation |
Dates administered |
Dates updated |
Joe Biden Democratic |
Donald Trump Republican |
Other/ Undecided [lower-alpha 1] |
Margin |
|---|---|---|---|---|---|---|
| 270 to Win | October 22 – November 2, 2020 | November 3, 2020 | 49.4% | 45.7% | 4.9% | Biden +3.7 |
| Real Clear Politics | October 29 – November 2, 2020 | November 3, 2020 | 48.7% | 47.5% | 3.8% | Biden +1.2 |
| FiveThirtyEight | until November 2, 2020 | November 3, 2020 | 50.2% | 45.6% | 4.2% | Biden +4.6 |
| Average | 49.4% | 46.3% | 4.3% | Biden +3.1 | ||
2020 polls
| Poll source | Date(s) administered |
Sample size[lower-alpha 2] |
Margin of error |
Donald Trump Republican |
Joe Biden Democratic |
Jo Jorgensen Libertarian |
Howie Hawkins Green |
Other | Undecided |
|---|---|---|---|---|---|---|---|---|---|
| Susquehanna Polling & Research Inc. | Nov 1–2 | 499 (LV) | ± 4.3% | 49%[lower-alpha 3] | 48% | 1% | - | 0%[lower-alpha 4] | 0% |
| SurveyMonkey/Axios | Oct 20 – Nov 2 | 6,045 (LV) | ± 2% | 47%[lower-alpha 5] | 52% | - | - | – | – |
| Pulse Opinion Research/Rasmussen Reports | Oct 31 – Nov 1 | 800 (LV) | ± 3.5% | 47%[lower-alpha 6] | 50% | - | - | 1%[lower-alpha 7] | – |
| Research Co. | Oct 31 – Nov 1 | 450 (LV) | ± 4.6% | 46% | 52% | - | - | 2%[lower-alpha 8] | 4% |
| AYTM/Aspiration | Oct 30 – Nov 1 | 340 (LV) | – | 49% | 51% | - | - | – | – |
| Change Research/CNBC | Oct 29 – Nov 1 | 699 (LV) | ± 3.71% | 46% | 50% | 2% | - | – | 2% |
| Marist College/NBC | Oct 29 – Nov 1 | 772 (LV) | ± 4.4% | 46% | 51% | - | - | 1% | 2% |
| Monmouth University | Oct 28 – Nov 1 | 502(RV) | ± 4.4% | 45% | 50% | 1% | - | 0%[lower-alpha 9] | 4% |
| 502 (LV) | 44%[lower-alpha 10] | 51% | - | - | – | – | |||
| 45%[lower-alpha 11] | 50% | - | - | – | – | ||||
| Swayable | Oct 27 – Nov 1 | 1,107 (LV) | ± 3.9% | 48% | 50% | 2% | - | – | – |
| Data for Progress | Oct 27 – Nov 1 | 1,417 (LV) | ± 2.6% | 45% | 52% | 2% | 0% | 0%[lower-alpha 12] | – |
| Ipsos/Reuters | Oct 27 – Nov 1 | 673 (LV) | ± 4.3% | 45%[lower-alpha 13] | 51% | 1% | 1% | 2%[lower-alpha 14] | – |
| 44%[lower-alpha 15] | 51% | - | - | 3%[lower-alpha 16] | 2% | ||||
| 46%[lower-alpha 17] | 52% | - | - | 2%[lower-alpha 18] | – | ||||
| Trafalgar | Oct 30–31 | 1,062 (LV) | ± 2.93% | 48% | 46% | 2% | - | 1%[lower-alpha 19] | 4% |
| Frederick Polls/Compete Everywhere[upper-alpha 1] | Oct 30–31 | 879 (LV) | ± 3% | 48% | 52% | - | - | – | – |
| Insider Advantage/Center for American Greatness[upper-alpha 2] | Oct 30–31 | 500 (LV) | ± 4.4% | 48.7% | 47.4% | 1.3% | - | – | 2.6% |
| Siena College/NYT Upshot | Oct 26–31 | 1,862 (LV) | ± 2.4% | 43% | 49% | 2% | - | 0%[lower-alpha 20] | 5%[lower-alpha 21] |
| Morning Consult | Oct 22–31 | 2,686 (LV) | ± 2% | 43% | 52% | - | - | – | – |
| Emerson College | Oct 29–30 | 823 (LV) | ± 3.3% | 47%[lower-alpha 22] | 52% | - | - | 2%[lower-alpha 23] | – |
| AtlasIntel | Oct 29–30 | 672 (LV) | ± 4% | 50% | 49% | - | - | 2% | – |
| Targoz Market Research/PollSmart | Oct 25–30 | 998 (LV) | – | 42% | 56% | - | - | 2%[lower-alpha 24] | – |
| Public Policy Polling/American Bridge PAC[upper-alpha 3] | Oct 28–29 | 1,012 (V) | – | 45% | 52% | - | - | – | 3% |
| Redfield & Wilton Strategies | Oct 26–29 | 2,125 (LV) | – | 45% | 50% | 1% | - | 1% | 3% |
| Harvard-Harris/The Hill | Oct 26–29 | 901 (LV) | – | 46% | 51% | - | - | – | 3% |
| ABC/Washington Post | Oct 24–29 | 824 (LV) | ± 4% | 44% | 51% | 3% | - | 0%[lower-alpha 25] | 1% |
| Muhlenberg College/Morning Call | Oct 23–28 | 419 (LV) | ± 5.5% | 44% | 49% | - | - | 4%[lower-alpha 26] | 2% |
| SurveyMonkey/Axios | Oct 1–28 | 10,599 (LV) | ± 1.5% | 46% | 52% | - | - | – | - |
| RMG Research/PoliticalIQ | Oct 25–27 | 800 (LV) | ± 3.5% | 45%[lower-alpha 13] | 51% | - | - | 2% | 2% |
| 44%[lower-alpha 27] | 52% | - | - | 2% | 2% | ||||
| 47%[lower-alpha 28] | 49% | - | - | 2% | 2% | ||||
| Quinnipiac University | Oct 23–27 | 1,324 (LV) | ± 2.7% | 44% | 51% | - | - | 1%[lower-alpha 29] | 4% |
| Swayable | Oct 23–26 | 491 (LV) | ± 6% | 46% | 52% | 2% | - | – | – |
| Civiqs/Daily Kos | Oct 23–26 | 1,145 (LV) | ± 3% | 45% | 52% | - | - | 2%[lower-alpha 30] | 1% |
| Ipsos/Reuters | Oct 20–26 | 655 (LV) | ± 4.4% | 44%[lower-alpha 13] | 51% | 3% | 0% | 1%[lower-alpha 31] | – |
| 45%[lower-alpha 32] | 50% | - | - | 3%[lower-alpha 33] | 2% | ||||
| Insider Advantage/Center for American Greatness[upper-alpha 2] | Oct 25 | 400 (LV) | ± 4.9% | 48.5% | 45.5% | 3.3% | - | – | 2.8% |
| Trafalgar Group | Oct 24–25 | 1,076 (LV) | ± 2.91% | 48% | 48% | 2% | - | 1%[lower-alpha 34] | 1% |
| Wick Surveys | Oct 24–25 | 1,000 (LV) | ± 3.1% | 49% | 47% | - | - | – | – |
| Franklin & Marshall College | Oct 19–25 | 558 (LV) | ± 5% | 44% | 50% | 2% | - | 1%[lower-alpha 35] | 3% |
| Univision/University of Houston/Latino Decisions/North Star Opinion Research |
Oct 17–25 | 723 (RV) | ± 3.64% | 45% | 50% | - | - | 3%[lower-alpha 36] | 2% |
| Gravis Marketing | Oct 23 | 602 (LV) | ± 4% | 44% | 51% | - | - | – | 5% |
| Public Policy Polling/American Bridge PAC[upper-alpha 4] | Oct 21–22 | 980 (V) | – | 46% | 51% | - | - | – | 4% |
| Civiqs/Dan Hopkins | Oct 17–21 | 1,577 (A) | 3% | 46% | 52% | - | - | – | 2% |
| YouGov/University of Wisconsin-Madison | Oct 13–21 | 669 (LV) | ± 4.45% | 44% | 52% | - | - | 3%[lower-alpha 37] | – |
| Citizen Data | Oct 17–20 | 1,000 (LV) | ± 3.1% | 39% | 44% | 9% | 0% | 1% | 7% |
| CNN/SSRS | Oct 15–20 | 843 (LV) | ± 4% | 43% | 53% | 2% | - | 1%[lower-alpha 38] | 1% |
| Muhlenberg College/Morning Call | Oct 13–20 | 416 (LV) | ± 5.5% | 44% | 51% | - | - | 2%[lower-alpha 39] | 4% |
| Morning Consult | Oct 11–20 | 2,563 (LV) | ± 1.9% | 43% | 52% | - | - | – | – |
| Fox News | Oct 18–19 | 1,045 (LV) | ± 3% | 45% | 50% | 1% | - | 1%[lower-alpha 40] | 2% |
| Pulse Opinion Research/Rasmussen Reports | Oct 18–19 | 800 (LV) | ± 3.5% | 47% | 50% | - | - | 2%[lower-alpha 41] | 3% |
| Quinnipiac University | Oct 16–19 | 1,241 (LV) | ± 2.8% | 43% | 51% | - | - | 1%[lower-alpha 42] | 5% |
| Change Research/CNBC | Oct 16–19 | 574 (LV)[lower-alpha 43] | – | 47% | 49% | - | - | – | – |
| Suffolk University/USA Today | Oct 15–19 | 500 (LV) | ± 4.4% | 42% | 49% | 1% | - | 4%[lower-alpha 44] | 4% |
| Ipsos/Reuters | Oct 13–19 | 653 (LV) | ± 4.4% | 45%[lower-alpha 13] | 49% | 2% | 0% | 3%[lower-alpha 45] | – |
| 45%[lower-alpha 46] | 49% | - | - | 3%[lower-alpha 47] | 4% | ||||
| Trafalgar Group/Restoration PAC[upper-alpha 5] | Oct 13–15 | 1,041 (LV) | ± 2.96% | 46% | 48% | 3% | - | 2%[lower-alpha 48] | 2% |
| HarrisX/The Hill | Oct 12–15 | 1,289 (LV) | – | 46% | 51% | - | - | – | – |
| Insider Advantage/Center for American Greatness[upper-alpha 2] | Oct 12–13 | 400 (LV) | ± 4.9% | 43% | 46% | 2% | - | – | 9% |
| Redfield & Wilton Strategies | Oct 10–13 | 1,289 (LV) | – | 43%[lower-alpha 43] | 51% | 1% | 0% | – | – |
| Trafalgar Group | Oct 10–12 | 1,034 (LV) | ± 2.97% | 45% | 47% | 3% | - | 3%[lower-alpha 49] | 2% |
| RMG Research/PoliticalIQ | Oct 7–12 | 800 (LV) | – | 43%[lower-alpha 13] | 49% | 1% | – | 1% | 6% |
| 42%[lower-alpha 50] | 50% | 1% | – | 1% | 6% | ||||
| 45%[lower-alpha 51] | 47% | 1% | – | 1% | 6% | ||||
| Civiqs/Rust Belt Rising[upper-alpha 6] | Oct 8–11 | 600 (LV) | ± 4.2% | 45% | 52% | - | - | 2%[lower-alpha 52] | 1% |
| Ipsos/Reuters | Oct 6–11 | 622 (LV) | ± 4.5% | 45%[lower-alpha 13] | 51% | 1% | 0% | 2%[lower-alpha 53] | – |
| 44%[lower-alpha 54] | 51% | - | - | 1%[lower-alpha 55] | 4% | ||||
| Morning Consult | Oct 2–11 | 2,610 (LV) | ± 1.9% | 44% | 52% | - | - | – | – |
| Redfield & Wilton Strategies | Oct 9–10 | 1,145 (LV) | – | 44%[lower-alpha 43] | 49% | 1% | - | – | – |
| Whitman Insight Strategies | Oct 5–9 | 517 (LV) | ± 4.3% | 46% | 51% | - | - | 1%[lower-alpha 56] | 3% |
| Baldwin Wallace University | Sep 30 – Oct 8 | 1,140 (LV) | ± 3.1% | 45% | 50% | 1% | 0% | 0%[lower-alpha 57] | 4% |
| YouGov/CCES | Sep 29 – Oct 7 | 2,703 (LV) | – | 44% | 52% | - | - | – | – |
| Redfield & Wilton Strategies | Oct 4–6 | 927 (LV) | ± 3.22% | 42% | 49% | 1% | - | 1%[lower-alpha 58] | 7% |
| Emerson College | Oct 4–5 | 688 (LV) | ± 3.7% | 47%[lower-alpha 59] | 51% | - | - | 2%[lower-alpha 60] | – |
| Quinnipiac University | Oct 1–5 | 1,211 (LV) | ± 2.8% | 41% | 54% | - | - | 1%[lower-alpha 61] | 3% |
| Ipsos/Reuters | Sep 29 – Oct 5 | 605 (LV) | ± 4.5% | 45% | 50% | - | - | 2%[lower-alpha 62] | 3% |
| Change Research/CNBC | Oct 2–4 | 468 (LV) | – | 46% | 50% | - | - | – | – |
| Monmouth University | Sep 30 – Oct 4 | 500 (RV) | ± 4.4% | 42% | 54% | 1% | - | 0%[lower-alpha 63] | 2% |
| 500 (LV) | 43%[lower-alpha 64] | 54% | - | - | – | – | |||
| 45%[lower-alpha 65] | 53% | - | - | – | – | ||||
| YouGov/CBS | Sep 30 – Oct 2 | 1,287 (LV) | ± 3.2% | 44% | 51% | - | - | 2%[lower-alpha 66] | 5% |
| Siena College/NYT Upshot | Sep 30 – Oct 2 | 706 (LV) | ± 4.1% | 42% | 49% | 3% | - | 0%[lower-alpha 67] | 5%[lower-alpha 68] |
| SurveyMonkey/Axios | Sep 1–30 | 4,613 (LV) | – | 46% | 52% | - | - | – | 2% |
| ABC News/Washington Post | Sep 21–26 | 567 (LV) | ± 5.0% | 45% | 54% | - | - | 0%[lower-alpha 69] | 1% |
| Siena College/NYT Upshot | Sep 25–27 | 711 (LV) | ± 4.3% | 40% | 49% | 2% | - | 0%[lower-alpha 70] | 8%[lower-alpha 71] |
| TIPP/The Federalist | Sep 24–26 | 774 (LV) | ± 3.6% | 45% | 50% | - | - | 1%[lower-alpha 72] | 4% |
| Redfield & Wilton Strategies | Sep 23–25 | 1,015 (LV) | ± 3.08% | 44% | 50% | 0% | – | 1%[lower-alpha 73] | 5% |
| Fox News | Sep 20–23 | 856 (LV) | ± 3% | 44% | 51% | 2% | – | 1%[lower-alpha 74] | 2% |
| 910 (RV) | ± 3% | 43% | 51% | 2% | – | 2%[lower-alpha 75] | 3% | ||
| Baldwin Wallace University | Sep 9–22 | 1,012 (LV) | ± 3.6% | 45% | 47% | 2% | 0% | 1%[lower-alpha 76] | 5% |
| Trafalgar Group/Restoration PAC[upper-alpha 5] | Sep 18–21 | 1,006 (LV) | ± 2.99% | 46% | 48% | 1% | 1% | 2%[lower-alpha 77] | 2% |
| YouGov/UW-Madison Elections Research Center/Wisconsin State Journal |
Sep 10–21 | 642 (LV) | – | 45% | 49% | - | - | – | – |
| Change Research/CNBC | Sep 18–20 | 579 (LV) | – | 45% | 49% | - | - | – | – |
| Franklin & Marshall College | Sep 14–20 | 480 (LV) | ± 7.8% | 42% | 48% | - | - | – | – |
| Hart Research Associates/Human Rights Campaign[upper-alpha 7] | Sep 17–19 | 400 (LV) | ± 4.9% | 42% | 53% | - | - | – | – |
| CPEC[upper-alpha 8] | Sep 15–17 | 830 (LV) | ± 2.3% | 45% | 50% | - | - | 1%[lower-alpha 78] | 4% |
| Trafalgar Group (R) | Sep 15–17 | 1,006 (LV) | ± 2.99% | 45% | 47% | 2% | 1% | 2%[lower-alpha 79] | 2% |
| Ipsos/Reuters | Sep 11–16 | 611 (LV) | ± 4.5% | 46% | 49% | - | - | 2%[lower-alpha 80] | 4% |
| Civiqs/Rust Belt Rising[upper-alpha 6] | Sep 11–15 | 704 (RV) | ± 4.4% | 45% | 52% | - | - | 1%[lower-alpha 81] | 2% |
| Redfield & Wilton Strategies | Sep 12–14 | 1,036 (LV) | ± 3.04% | 44% | 49% | 1% | 1% | 0%[lower-alpha 82] | 5% |
| Climate Nexus | Sep 8–11 | 659 (RV) | ± 4% | 43% | 48% | - | - | 3%[lower-alpha 83] | 6% |
| Benenson Strategy Group/GS Strategy Group/AARP | Aug 28 – Sep 8 | 1,600 (LV) | ± 2.5% | 46% | 49% | - | - | 1%[lower-alpha 84] | 4% |
| Marist College/NBC News | Aug 31 – Sep 7 | 771 (LV) | ± 4.4% | 44% | 53% | - | - | 1% | 2% |
| Morning Consult | Aug 29 – Sep 7 | 2,227 (LV) | ± (2%-4%) | 45%[lower-alpha 85] | 50% | - | - | – | – |
| Change Research/CNBC | Sep 4–6 | 829 (LV) | – | 46% | 50% | - | - | 4%[lower-alpha 86] | – |
| TargetSmart | Sep 3–6 | 835 (LV) | ± 3.4% | 44% | 51% | - | - | 3% | 3% |
| Susquehanna Polling & Research Inc. | Aug 26 – Sep 4 | 498 (LV) | ± 4.3% | 42% | 44% | - | - | 6%[lower-alpha 87] | 7% |
| Redfield & Wilton Strategies | Aug 30 – Sep 3 | 1,053 (LV) | ± 3.02% | 43% | 48% | 1% | 1% | 1%[lower-alpha 88] | 7% |
| Quinnipiac | Aug 28 – Sep 1 | 1,235 (LV) | ± 3% | 44% | 52% | - | - | 1%[lower-alpha 89] | 3% |
| ALG Research/Progressive Policy Institute[upper-alpha 9] | Aug 26 – Sep 1 | 500 (LV) | – | 44% | 50% | - | - | – | – |
| Monmouth University | Aug 28–31 | 400 (RV) | ± 4.9% | 45% | 49% | 2% | 0% | 1%[lower-alpha 90] | 4% |
| 400 (LV) | 46%[lower-alpha 91] | 49% | - | - | 2% | 3% | |||
| 47%[lower-alpha 92] | 48% | - | - | 2% | 3% | ||||
| Hodas & Associates/Restoration PAC[upper-alpha 5] | Aug 26–31 | 600 (LV) | – | 45% | 51% | - | - | – | 4% |
| SurveyMonkey/Axios | Aug 1–31 | 3,531 (LV) | – | 45% | 53% | - | - | – | 2% |
| Morning Consult | Aug 21–30 | 2,158 (LV) | ± (2%–4%) | 45% | 49% | - | - | – | – |
| Pulse Opinion Research/Rasmussen Reports | Aug 25–27 | 1,000 (LV) | ± 3% | 48%[lower-alpha 93] | 48% | - | - | 4%[lower-alpha 94] | – |
| GQR Research/Unite the Country PAC[upper-alpha 10] | Aug 20–24 | 971 (LV) | ± 4.4% | 43% | 52% | - | - | – | 5% |
| Franklin & Marshall College | Aug 17–24 | 681 (RV) | ± 5.2% | 42%[lower-alpha 95] | 50% | - | - | 3%[lower-alpha 96] | 7% |
| Change Research/CNBC | Aug 21–23 | 984 (LV) | – | 46% | 49% | - | - | – | – |
| Global Strategy Group/Climate Power 2020 /League of Conservation Voters/Sierra Club[upper-alpha 11] |
Aug 13–19 | 801 (RV) | ± 3.5% | 42%[lower-alpha 13] | 50% | 2% | 1% | – | 5% |
| 43%[lower-alpha 97] | 53% | - | - | – | 4% | ||||
| Redfield and Wilton Strategies | Aug 16–17 | 1,006 (LV) | ± 3.1% | 41% | 48% | 1% | 1% | 1%[lower-alpha 98] | 8% |
| Civiqs/Rust Belt Rising[upper-alpha 6] | Aug 13–17 | 617 (RV) | – | 44% | 51% | - | - | 3%[lower-alpha 99] | 1% |
| Muhlenberg College/Morning Call | Aug 11–17 | 416 (LV) | ± 5.5% | 45% | 49% | - | - | 3%[lower-alpha 100] | 3% |
| Morning Consult | Aug 7–16 | 1,777 (LV) | ± (2%–4%) | 44% | 50% | - | - | – | – |
| Emerson College | Aug 8–10 | 843 (LV) | ± 3.8% | 47%[lower-alpha 101] | 53% | - | - | – | – |
| Change Research/CNBC | Aug 7–9 | 456 (RV) | – | 44% | 48% | - | - | – | – |
| YouGov/CBS | Aug 4–7 | 1,211 (LV) | ± 3.7% | 43% | 49% | - | - | 3%[lower-alpha 102] | 5% |
| OnMessage Inc./Heritage Action[upper-alpha 12] | Aug 2–4 | 400 (LV) | ± 4.7% | 46% | 50% | - | - | – | 4% |
| YouGov/University of Wisconsin-Madison | Jul 27 – Aug 6 | 742 (RV) | ± 4.9% | 41% | 50% | - | - | 2%[lower-alpha 103] | 5% |
| SurveyMonkey/Axios | Jul 1–31 | 4,208 (LV) | – | 48% | 50% | - | - | – | 2% |
| Change Research/CNBC | Jul 24–26 | 382 (LV) | – | 46% | 48% | - | - | – | – |
| Franklin & Marshall College | Jul 20–26 | 667 (RV) | ± 5.5% | 41% | 50% | - | - | 2%[lower-alpha 104] | 6% |
| Morning Consult | Jul 17–26 | 2,092 (LV) | ± 2.1% | 42% | 50% | - | - | – | – |
| Gravis Marketing | Jul 22–24 | 1,006 (RV) | ± 3.1% | 45% | 48% | - | - | – | 8% |
| Zogby Analytics | Jul 21–23 | 809 (RV) | ± 3.4% | 43% | 44% | 4% | 2% | - | 8% |
| Hodas & Associates/Restoration PAC[upper-alpha 5] | Jul 17–22 | 600 (LV) | – | 45% | 51% | - | - | – | 5% |
| Redfield & Wilton Strategies | Jul 19–21 | 1,016 (LV) | – | 41% | 48% | 1% | 0% | 2%[lower-alpha 105] | 8% |
| Fox News | Jul 18–20 | 793 (RV) | ± 3.5% | 39% | 50% | - | - | 5%[lower-alpha 106] | 6% |
| Pulse Opinion Research/Rasmussen Reports/American Greatness PAC[upper-alpha 2] | Jul 15–16 | 750 (LV) | ± 4% | 46% | 51% | - | - | 2%[lower-alpha 107] | 1% |
| Spry Strategies/American Principles Project[upper-alpha 13] | Jul 11–16 | 700 (LV) | ± 3.7% | 48% | 47% | - | - | – | 5% |
| Monmouth University | Jul 9–13 | 401 (RV) | ± 4.9% | 40% | 53% | - | - | 3%[lower-alpha 108] | 4% |
| 401 (LV) | 42%[lower-alpha 109] | 52% | - | - | 3% | 3% | |||
| 44%[lower-alpha 110] | 51% | - | - | 2% | 3% | ||||
| Change Research/CNBC | Jul 10–12 | 743 (LV) | – | 42% | 50% | - | - | – | – |
| Trafalgar Group | Jun 29 – Jul 2 | 1,062 (LV) | ± 2.92% | 43% | 48% | - | - | 6%[lower-alpha 111] | 3% |
| SurveyMonkey/Axios | Jun 8–30 | 2,184 (LV) | – | 48% | 50% | - | - | – | 2% |
| Change Research/CNBC | Jun 26–28 | 760 (LV)[lower-alpha 43] | – | 44% | 50% | - | - | – | – |
| Susquehanna Polling/Fox 43 | Jun 15–23 | 715 (LV) | – | 41% | 46% | - | - | 5% | 8% |
| Redfield & Wilton Strategies | Jun 14–16 | 1,125 (LV) | ± 2.92% | 39% | 49% | 1% | 1% | 1%[lower-alpha 112] | 9% |
| Siena College/NYT Upshot | Jun 8–16 | 651 (RV) | ± 4.2% | 40% | 50% | - | - | 3%[lower-alpha 113] | 6% |
| Change Research/CNBC | Jun 12–14 | 491 (LV)[lower-alpha 43] | – | 46% | 49% | - | - | 3%[lower-alpha 114] | – |
| Hodas & Associates/Restoration PAC[upper-alpha 5] | Jun 8–11 | 600 (LV) | ± 4.0% | 42% | 54% | - | - | – | 4% |
| Civiqs/Dan Hopkins | Jun 6–11 | 1,221 (A) | 3.6% | 46% | 49% | - | - | – | 5% |
| Civiqs/Dan Hopkins | May 30 – Jun 2 | 2,045 (A) | 2.4% | 46% | 49% | - | - | – | 5% |
| Change Research/CNBC | May 29–31 | 579 (LV)[lower-alpha 43] | – | 50% | 46% | - | - | 2% | 2% |
| Morning Consult | May 17–26 | 2,120 (LV) | – | 44%[lower-alpha 43] | 48% | - | - | – | – |
| Redfield & Wilton Strategies | May 10–14 | 963 (LV) | ± 3.2% | 39% | 48% | - | - | 2%[lower-alpha 115] | 11% |
| Hodas & Associates/Restoration PAC[upper-alpha 5] | May 9–13 | 600 (LV) | ± 3.0% | 51% | 46% | - | - | – | 4% |
| Harper Polling (R) | Apr 21–26 | 644 (LV) | ± 3.9% | 43% | 49% | - | - | – | 8% |
| Public Policy Polling[upper-alpha 14] | Apr 20–21 | 1,251 (RV) | – | 44% | 51% | - | - | – | 5% |
| Fox News | Apr 18–21 | 803 (RV) | ± 3.5% | 42% | 50% | - | - | – | – |
| Ipsos | Apr 15–20 | 578 (RV) | ± 5.0% | 40% | 46% | - | - | – | – |
| Suquehanna Research/Fox 43 | Apr 14–20 | 693 (LV) | – | 42% | 48% | - | - | – | – |
| Hodas & Associates/Restoration PAC[upper-alpha 5] | Apr 16–18 | 600 (RV) | ± 3.0% | 47% | 47% | - | - | – | 6% |
| Civiqs/Dan Hopkins | Apr 4–8 | 1,912 (A) | 2.5% | 47% | 47% | - | - | – | 6% |
| Baldwin Wallace University Great Lakes | Mar 17–25 | 973 (RV) | ± 3.9% | 47% | 45% | - | - | – | 9% |
| Change Research | Mar 21–23 | 510 (LV) | – | 50% | 47% | - | - | – | 4% |
| Hodas & Associates/Restoration PAC[upper-alpha 5] | Mar 19–21 | 600 (RV) | – | 47% | 45% | - | - | – | – |
| Civiqs/Dan Hopkins | Mar 14–18 | 1,589 (A) | 2.7% | 48% | 46% | - | - | – | 6% |
| YouGov/Yahoo News | Mar 6–8 | 725 (RV) | – | 40% | 46% | - | - | 5%[lower-alpha 116] | 8% |
| Firehouse Strategies/Øptimus | Mar 5–7 | 533 (RV) | ± 5.3% | 45% | 44% | - | - | – | – |
| Civiqs/Dan Hopkins | Feb 27 – Mar 3 | 2,462 (A) | 2.2% | 48% | 46% | - | - | – | 7% |
| Muhlenberg College/Morning Call | Feb 12–20 | 424 (RV) | ± 5.5% | 47% | 47% | - | - | 2% | 4% |
| YouGov | Feb 11–20 | 1,171 (RV) | ± 4.0% | 45% | 46% | - | - | – | – |
| Quinnipiac University | Feb 12–18 | 849 (RV) | ± 3.4% | 42% | 50% | - | - | 6%[lower-alpha 117] | 3% |
| Expedition Strategies/Progressive Policies Institute | Feb 6–18 | 500 (RV) | – | 42% | 47% | - | - | – | 11% |
2017–2019 polls
| Poll source | Date(s) administered |
Sample size[lower-alpha 2] |
Margin of error |
Donald Trump Republican |
Joe Biden Democratic |
Other | Undecided |
|---|---|---|---|---|---|---|---|
| Firehouse Strategies/Øptimus | Dec 3–5, 2019 | 598 (LV) | ± 4.3% | 45% | 41% | 8%[lower-alpha 118] | 6%[lower-alpha 119] |
| Muhlenberg College/Morning Call | Nov 4–9, 2019 | 410 (RV) | ± 6.0% | 43% | 52% | 4% | 2% |
| Siena College/NYT Upshot | Oct 13–25, 2019 | 661 (LV) | ± 4.4% | 45% | 46% | – | – |
| Firehouse Strategies/Øptimus | Sep 7–9, 2019 | 527 (LV) | ± 4.2% | 41% | 45% | 14% | – |
| Firehouse Strategies/Øptimus | Jun 11–13, 2019 | 565 (LV) | ± 4.2% | 42% | 43% | 15% | – |
| Quinnipiac University | May 9–14, 2019 | 978 (RV) | ± 4.2% | 42% | 53% | 1% | 3% |
| WPA Intelligence | Apr 27–30, 2019 | 200 (LV) | ± 6.9% | 45% | 46% | – | 8% |
| Emerson College | Mar 26–28, 2019 | 808 (RV) | ± 3.4% | 45% | 55% | – | – |
| Firehouse Strategies/Øptimus | Mar 19–21, 2019 | 632 (LV) | ± 4.0% | 43% | 50% | 4% | – |
Former candidates and hypothetical polling
Former candidates | ||||||||||||||||||||||||||||||||||||||||||||||||||||||||||||||||||||||||||||||||||||||||||||||||||||||||||||||||||||||||||||||||||||||||||||||||||||||||||||||||||||||||||||||||||||||||||||||||||||||||||||||||||||||||||||||||||||||||||||||||||||||||||||||||||||||||||||||||||||||||||||||||||||||||||||||||||||||||||||||||||||||||||||||||||||||||||||||||||||||||||||||||||||||||||||||||||||||||||||||||||||||||||||||||||||||||||||||||
|---|---|---|---|---|---|---|---|---|---|---|---|---|---|---|---|---|---|---|---|---|---|---|---|---|---|---|---|---|---|---|---|---|---|---|---|---|---|---|---|---|---|---|---|---|---|---|---|---|---|---|---|---|---|---|---|---|---|---|---|---|---|---|---|---|---|---|---|---|---|---|---|---|---|---|---|---|---|---|---|---|---|---|---|---|---|---|---|---|---|---|---|---|---|---|---|---|---|---|---|---|---|---|---|---|---|---|---|---|---|---|---|---|---|---|---|---|---|---|---|---|---|---|---|---|---|---|---|---|---|---|---|---|---|---|---|---|---|---|---|---|---|---|---|---|---|---|---|---|---|---|---|---|---|---|---|---|---|---|---|---|---|---|---|---|---|---|---|---|---|---|---|---|---|---|---|---|---|---|---|---|---|---|---|---|---|---|---|---|---|---|---|---|---|---|---|---|---|---|---|---|---|---|---|---|---|---|---|---|---|---|---|---|---|---|---|---|---|---|---|---|---|---|---|---|---|---|---|---|---|---|---|---|---|---|---|---|---|---|---|---|---|---|---|---|---|---|---|---|---|---|---|---|---|---|---|---|---|---|---|---|---|---|---|---|---|---|---|---|---|---|---|---|---|---|---|---|---|---|---|---|---|---|---|---|---|---|---|---|---|---|---|---|---|---|---|---|---|---|---|---|---|---|---|---|---|---|---|---|---|---|---|---|---|---|---|---|---|---|---|---|---|---|---|---|---|---|---|---|---|---|---|---|---|---|---|---|---|---|---|---|---|---|---|---|---|---|---|---|---|---|---|---|---|---|---|---|---|---|---|---|---|---|---|---|---|---|---|---|---|---|---|---|---|---|---|---|---|---|---|---|---|---|---|---|---|---|---|---|---|---|---|---|---|---|---|---|---|---|---|---|---|---|---|---|---|---|---|---|---|---|---|---|---|---|---|---|---|---|---|---|---|---|---|---|---|---|---|---|---|---|---|---|
|
Donald Trump vs. Michael Bloomberg
Donald Trump vs. Pete Buttigieg
Donald Trump vs. Kamala Harris
Donald Trump vs. Amy Klobuchar
Donald Trump vs. Beto O'Rourke
Donald Trump vs. Bernie Sanders
Donald Trump vs. Elizabeth Warren
|
Hypothetical polling | ||||||||||||||||||||||||||||||||||||||||||||||||||||||||||||||||||||||||||||||||||||
|---|---|---|---|---|---|---|---|---|---|---|---|---|---|---|---|---|---|---|---|---|---|---|---|---|---|---|---|---|---|---|---|---|---|---|---|---|---|---|---|---|---|---|---|---|---|---|---|---|---|---|---|---|---|---|---|---|---|---|---|---|---|---|---|---|---|---|---|---|---|---|---|---|---|---|---|---|---|---|---|---|---|---|---|---|
|
Donald Trump vs. Generic Democrat
Donald Trump vs. Generic Opponent
|
Results
9,098,998[32] residents registered to vote by the voter registration deadline on October 15, which had been extended from its original date on October 13 by court order.
| Party | Candidate | Votes | % | ±% | |
|---|---|---|---|---|---|
| Democratic | Joe Biden Kamala Harris |
3,458,229 | 50.01% | +2.55% | |
| Republican | Donald Trump Mike Pence |
3,377,674 | 48.84% | +0.66% | |
| Libertarian | Jo Jorgensen Spike Cohen |
79,380 | 1.15% | -1.23% | |
| Total votes | 6,915,283 | 100.00% | |||
Results by county
| County | Joe Biden | Donald Trump | Jo Jorgensen | Margin | Total votes | ||||
|---|---|---|---|---|---|---|---|---|---|
| # | % | # | % | # | % | # | % | ||
| Adams | 18,207 | 32.20% | 37,523 | 66.37% | 810 | 1.43% | -19,316 | -34.16% | 56,540 |
| Allegheny | 429,065 | 59.61% | 282,324 | 39.23% | 8,344 | 1.16% | 147,846 | 20.48% | 722,033 |
| Armstrong | 8,457 | 23.25% | 27,489 | 75.58% | 424 | 1.17% | -19,032 | -52.33% | 36,370 |
| Beaver | 38,122 | 40.50% | 54,759 | 58.18% | 1,241 | 1.32% | -16,637 | -17.68% | 94,122 |
| Bedford | 4,367 | 15.84% | 23,025 | 83.50% | 182 | 0.66% | -18,658 | -67.67% | 27,574 |
| Berks | 92,895 | 45.20% | 109,736 | 53.39% | 2,909 | 1.42% | -16,841 | -8.19% | 205,540 |
| Blair | 17,636 | 27.73% | 45,306 | 71.24% | 653 | 1.03% | -27,670 | -43.51% | 63,595 |
| Bradford | 8,046 | 26.68% | 21,600 | 71.62% | 513 | 1.70% | -13,554 | -44.94% | 30,159 |
| Bucks | 204,712 | 51.66% | 187,367 | 47.29% | 4,155 | 1.05% | 17,345 | 4.38% | 396,234 |
| Butler | 37,508 | 33.10% | 74,359 | 65.63% | 1,438 | 1.27% | -36,851 | -32.52% | 113,305 |
| Cambria | 21,730 | 30.79% | 48,085 | 68.13% | 759 | 1.08% | -26,355 | -37.34% | 70,574 |
| Cameron | 634 | 26.05% | 1,771 | 72.76% | 29 | 1.19% | -1,137 | -46.71% | 2,434 |
| Carbon | 11,212 | 33.34% | 21,984 | 65.37% | 433 | 1.29% | -10,772 | -32.03% | 33,629 |
| Centre | 40,055 | 51.69% | 36,372 | 46.94% | 1,066 | 1.38% | 3,683 | 4.75% | 77,493 |
| Chester | 182,372 | 57.99% | 128,565 | 40.88% | 3,565 | 1.13% | 53,807 | 17.11% | 314,502 |
| Clarion | 4,678 | 24.00% | 14,578 | 74.79% | 237 | 1.22% | -9,900 | -50.79% | 19,493 |
| Clearfield | 9,673 | 24.54% | 29,203 | 74.08% | 546 | 1.39% | -19,530 | -49.54% | 39,422 |
| Clinton | 5,502 | 31.22% | 11,902 | 67.53% | 221 | 1.25% | -6,400 | -36.31% | 17,625 |
| Columbia | 10,532 | 33.79% | 20,098 | 64.48% | 541 | 1.74% | -9,566 | -30.69% | 31,171 |
| Crawford | 12,924 | 30.77% | 28,559 | 67.99% | 521 | 1.24% | -15,635 | -37.22% | 42,004 |
| Cumberland | 62,245 | 43.96% | 77,212 | 54.53% | 2,138 | 1.51% | -14,967 | -10.57% | 141,595 |
| Dauphin | 78,983 | 53.60% | 66,408 | 45.06% | 1,977 | 1.34% | 12,575 | 8.53% | 147,368 |
| Delaware | 206,423 | 62.95% | 118,532 | 36.15% | 2,976 | 0.91% | 87,891 | 26.80% | 327,931 |
| Elk | 4,522 | 26.75% | 12,140 | 71.81% | 244 | 1.44% | -7,618 | -45.06% | 16,906 |
| Erie | 68,286 | 49.81% | 66,869 | 48.78% | 1,928 | 1.41% | 1,417 | 1.03% | 137,083 |
| Fayette | 20,444 | 32.90% | 41,227 | 66.35% | 468 | 0.75% | -20,783 | -33.45% | 62,139 |
| Forest | 728 | 27.51% | 1,882 | 71.13% | 36 | 1.36% | -1,154 | -43.61% | 2,646 |
| Franklin | 22,422 | 27.76% | 57,245 | 70.86% | 1,116 | 1.38% | -34,823 | -43.11% | 80,783 |
| Fulton | 1,085 | 13.60% | 6,824 | 85.55% | 68 | 0.85% | -5,739 | -71.94% | 7,977 |
| Greene | 4,911 | 27.79% | 12,579 | 71.19% | 179 | 1.01% | -7,668 | -43.40% | 17,669 |
| Huntingdon | 5,445 | 23.89% | 17,061 | 74.86% | 286 | 1.25% | -11,616 | -50.97% | 22,792 |
| Indiana | 12,634 | 30.67% | 28,089 | 68.18% | 475 | 1.15% | -15,455 | -37.51% | 41,198 |
| Jefferson | 4,527 | 19.83% | 17,960 | 78.69% | 337 | 1.48% | -13,433 | -58.85% | 22,824 |
| Juniata | 2,253 | 18.71% | 9,649 | 80.12% | 141 | 1.17% | -7,396 | -61.41% | 12,043 |
| Lackawanna | 61,991 | 53.71% | 52,334 | 45.35% | 1,085 | 0.94% | 9,657 | 8.37% | 115,410 |
| Lancaster | 115,847 | 41.34% | 160,209 | 57.17% | 4,183 | 1.49% | -44,362 | -15.83% | 280,239 |
| Lawrence | 15,978 | 34.68% | 29,597 | 64.24% | 501 | 1.09% | -13,619 | -29.56% | 46,076 |
| Lebanon | 23,932 | 33.40% | 46,731 | 65.22% | 989 | 1.38% | -22,799 | -31.82% | 71,652 |
| Lehigh | 98,288 | 53.21% | 84,259 | 45.62% | 2,166 | 1.17% | 14,029 | 7.60% | 184,713 |
| Luzerne | 64,873 | 42.31% | 86,929 | 56.70% | 1,519 | 0.99% | -22,056 | -14.39% | 153,321 |
| Lycoming | 16,971 | 28.64% | 41,462 | 69.97% | 821 | 1.39% | -24,491 | -41.33% | 59,254 |
| McKean | 5,098 | 26.19% | 14,083 | 72.35% | 285 | 1.46% | -8,985 | -46.16% | 19,466 |
| Mercer | 21,067 | 36.35% | 36,143 | 62.36% | 744 | 1.28% | -15,076 | -26.01% | 57,954 |
| Mifflin | 4,603 | 21.41% | 16,670 | 77.53% | 229 | 1.07% | -12,067 | -56.12% | 21,502 |
| Monroe | 44,060 | 52.56% | 38,726 | 46.20% | 1,043 | 1.24% | 5,334 | 6.36% | 83,829 |
| Montgomery | 319,511 | 62.63% | 185,460 | 36.35% | 5,186 | 1.02% | 134,051 | 26.28% | 510,157 |
| Montour | 3,771 | 38.59% | 5,844 | 59.81% | 156 | 1.60% | -2,073 | -21.22% | 9,771 |
| Northampton | 85,087 | 49.78% | 83,854 | 49.05% | 2,001 | 1.17% | 1,233 | 0.72% | 170,942 |
| Northumberland | 12,677 | 29.98% | 28,952 | 68.47% | 654 | 1.55% | -16,275 | -38.49% | 42,283 |
| Perry | 5,950 | 24.14% | 18,293 | 74.20% | 409 | 1.66% | -12,343 | -50.07% | 24,652 |
| Philadelphia | 603,790 | 81.44% | 132,740 | 17.90% | 4,847 | 0.65% | 471,050 | 63.54% | 741,377 |
| Pike | 13,019 | 39.99% | 19,213 | 59.02% | 322 | 0.99% | -6,194 | -19.03% | 32,554 |
| Potter | 1,726 | 19.04% | 7,239 | 79.87% | 99 | 1.09% | -5,513 | -60.82% | 9,064 |
| Schuylkill | 20,727 | 29.36% | 48,871 | 69.22% | 1,005 | 1.42% | -28,144 | -39.86% | 70,603 |
| Snyder | 4,910 | 25.65% | 13,983 | 73.06% | 247 | 1.29% | -9,073 | -47.40% | 19,140 |
| Somerset | 8,654 | 21.35% | 31,466 | 77.61% | 423 | 1.04% | -22,812 | -56.27% | 40,543 |
| Sullivan | 921 | 25.62% | 2,619 | 72.85% | 55 | 1.53% | -1,698 | -47.23% | 3,595 |
| Susquehanna | 6,236 | 28.67% | 15,207 | 69.91% | 309 | 1.42% | -8,971 | -41.24% | 21,752 |
| Tioga | 4,955 | 23.51% | 15,742 | 74.70% | 378 | 1.79% | -10,787 | -51.18% | 21,075 |
| Union | 7,475 | 37.16% | 12,356 | 61.43% | 284 | 1.41% | -4,881 | -24.27% | 20,115 |
| Venango | 7,585 | 28.59% | 18,569 | 70.00% | 374 | 1.41% | -10,984 | -41.41% | 26,528 |
| Warren | 6,066 | 29.38% | 14,237 | 68.94% | 347 | 1.68% | -8,171 | -39.57% | 20,650 |
| Washington | 45,088 | 38.06% | 72,080 | 60.84% | 1,310 | 1.11% | -26,992 | -22.78% | 118,478 |
| Wayne | 9,191 | 32.72% | 18,637 | 66.35% | 261 | 0.93% | -9,446 | -33.63% | 28,089 |
| Westmoreland | 72,129 | 35.24% | 130,218 | 63.62% | 2,350 | 1.15% | -58,089 | -28.38% | 204,697 |
| Wyoming | 4,704 | 31.66% | 9,936 | 66.87% | 218 | 1.47% | -5,232 | -35.21% | 14,858 |
| York | 88,114 | 36.95% | 146,733 | 61.53% | 3,624 | 1.52% | -58,619 | -24.58% | 238,471 |
| Totals | 3,458,229 | 50.01% | 3,377,674 | 48.84% | 79,380 | 1.15% | 81,660 | 1.18% | 6,917,583 |
Counties that flipped from Republican to Democratic
- Erie (largest municipality: Erie)
- Northampton (largest municipality: Bethlehem)
Analysis
Throughout the year, Pennsylvania was regarded as the most important (or likely tipping-point) state in the entire election; Pennsylvania had 20 electoral votes, and it was one of the closest states of the 2016 presidential election. Both candidates aggressively played for the state; Trump needed the state as it represented his narrow path to re-election, while Biden needed the state to rebuild the blue wall, which Trump broke by carrying the northern industrial states of Michigan, Pennsylvania, and Wisconsin.[35]
Historically, Pennsylvania has usually been a competitive state. During the Second Party System, it voted for the winner of every election. From the Civil War on, it has generally had a partisan lean; during the Third and Fourth Party Systems, Pennsylvania was a classic Yankee Republican state. When Franklin Roosevelt carried it in 1936, he became the first Democrat in eighty years to do so. Between 1936 and 1988, neither major party carried Pennsylvania for more than three straight presidential elections, although between 1952 and 1988, it voted Democratic in every close election (1960, 1968, 1976), and consistently voted more Democratic than the nation. Starting in 1992, Pennsylvania became part of the blue wall--the group of states that voted Democratic for six straight elections from 1992 through 2012. In 2016, it was one of three blue wall states that Trump won on his way to an upset victory.
Biden's winning margin in Pennsylvania was somewhat smaller than that of other Democrats who had carried the state in recent close elections. His margin of 1.2% was less than a third that of Al Gore's 4.2% margin in 2000, and less than a fourth that of Barack Obama's 5.4% margin in 2012. It was closer to John Kerry's margin of 2.5% in 2004, although, because Kerry was losing the overall national popular vote by 2.5%, his win made Pennsylvania 5% bluer than the country in 2004. In contrast, Pennsylvania remained redder than the country in 2020 even as Biden won it, by about 3.3%. As in Michigan and Wisconsin, Biden ran behind Barack Obama's performances in 2008 and 2012, though he received more votes total in the state this cycle due to record-breaking turnout.
As for Trump, he easily set the record for total number of votes for a Republican candidate in Pennsylvania history (as with Biden, largely due to record-breaking turnout). With 48.84% of the vote, he did slightly outpace both his own vote share in 2016 (48.18%) and George W. Bush's in 2004 (48.42%), the latter of which had previously stood as the highest Republican vote share in the state since 1988.
Joe Biden's strongest base of support was the Philadelphia metro area. In the city of Philadelphia itself, Biden won by 63.4%, a weaker win than Hillary Clinton's 66.9% margin in the city in 2016, but still better than Kerry's 61.1% margin in 2004 or Gore's 62.0% margin in 2000.[36] Donald Trump improved his vote share in Philadelphia by 2.5%,[37] and, as of the counting on November 8, held a majority of the vote in the 26th, 58th, and 66th wards. However, Biden improved on Hillary Clinton dramatically in the Main Line counties of Montgomery and Chester, as well as, to a lesser extent, Delaware, increasing the Democratic vote share in these counties by 4.2%, 5.9%, and 3.5%, respectively, and winning them all by double digits. Before 1992, all three had been Republican strongholds in the state, and Chester had been considered a swing county as recently as 2012, when Romney narrowly carried it, but all three have drifted towards the Democratic column, as they tend to be socially liberal.[38]
Biden also performed strongly in Pennsylvania's other urban, suburban, and exurban areas. Crucially, he carried Allegheny County (Pittsburgh) by 20.4%, the widest margin any nominee had won the county by since 1992.[39] Centre and Dauphin both remained in the Democratic column; in the past, these counties voted Republican, though Centre County is home to Pennsylvania State University, while Dauphin County has followed the trend of urban areas becoming more Democratic. Biden also narrowly reclaimed two counties anchored by industrial cities which had long voted Democratic before Trump flipped them in 2016, Northampton (Bethlehem) and Erie (Erie), and improved on Hillary Clinton's margin in his birth county of Lackawanna County (Scranton), a county Hillary Clinton had barely kept in the Democratic column in 2016. In suburban Cumberland County, adjacent to Harrisburg, Biden shaved Trump's margin from 17.8% to 10.5%.[40] Northampton and Erie were the only counties to flip from one party to the other; Northampton has voted for the winner of the state in every election from 1952 on.
Trump maintained much of his momentum throughout rural and industrial Pennsylvania from four years earlier, with convincing victories in counties that were once competitive or even Democratic-leaning. He kept Luzerne County (Wilkes-Barre), which had voted Democratic six elections in a row before 2016 (and which had voted with the winner of the state from 1936 through 2016), in his column, although his margin in it was cut from 19.3% to 14.3%. Trump also won the former Democratic stronghold of Westmoreland County convincingly, although his margin in this county, crucial to his win in 2016,[41] declined.[42] Other previously competitive counties that Trump performed well in included Berks and Cambria, both of which voted for Obama in 2008. Trump further ran up the score in other conservative exurban[43] counties, most notably in Lancaster and Lebanon counties, though his margin shrank somewhat in both.
Trump won whites in the state by 15 points, although like in the rest of the country, there was a clear disparity between college-educated and non college-educated whites. Biden won whites with a college degree by 9 points, while Trump excelled with whites without a college degree, winning this group by 32 points. Additionally, there was a gender disparity with the white vote; Trump won white men by 15 points, but only carried white women by 3 points. Finally, there was an age gap; Biden won young voters by double-digit margins, whereas Trump performed strongly with middle-aged voters; senior citizens were more even, breaking slightly for Trump.[44]
Within minority blocs, Biden fared well, as he won black voters by 87 points, and won Latinos by 42 points. Three other critical voting blocs broke for Biden this cycle; he won independent voters by 8 points, moderates by 17 points, and first-time voters by 23 points.[44]
Aftermath
On November 24, 2020, the Secretary of the Commonwealth of Pennsylvania, Kathy Boockvar, certified the results, and Governor Tom Wolf, in accordance with the law, signed the certificate of ascertainment for the Biden/Harris slate of electors for Biden and Harris and sent it to the Archivist of the United States.[45][46]
On November 25, 2020, the Pennsylvania Senate Majority (Republican) Policy committee held a public hearing regarding the counting of ballots in this election.[47] Trump planned to attend the meeting but he canceled the trip.[48]
After a group of Republican congressman filed a lawsuit to stop certification on November 22, Judge Patricia McCullough ruled to halt further state certifications pending a hearing. The Pennsylvania Supreme Court ruled on November 28 to unanimously overturn Judge Patricia McCullough's ruling to halt certification.[49] Moreover, the Pennsylvania Supreme Court also dismissed with prejudice the requests of Representative Mike Kelly and other Republicans to either invalidate all 2.5 million mail-in ballots in Pennsylvania, or to invalidate all 6.9 million ballots in the state and have the state's Republican-controlled Legislature choose the presidential electors for the state.[50][51] The rationale for the decision was that the Republicans were challenging the law too late; they had been able to challenge the law since it became live on October 2019, but they only filed the lawsuit when the results of the November 2020 election were "becoming seemingly apparent". Hence, the Republicans had failed to act with "due diligence" in their handling of the case.[51][52] By the time of the court's decision, the Pennsylvania election results had been certified in Biden's favor.[53] The congressmen appealed to the US Supreme Court, but on December 8, 2020, the Supreme Court unanimously rejected the request in one sentence.[54][55]
Objection
On January 6, 2021, as Congress certified the Electoral College results confirming President-elect Joe Biden and Vice President-elect Kamala Harris' wins, there was an objection to Pennsylvania’s 20 electoral votes, brought forward by Representative Scott Perry of Pennsylvania’s 10th congressional district and officially signed onto by Senator Josh Hawley of Missouri.[56] The objection failed 7-92 in the Senate, and 138-282 in the House.[57]
See also
Notes
- Partisan clients
- Compete Everywhere primarily supports Democratic candidates
- The Center for American Greatness is a pro-Trump organization
- Climate Power 2020 was created by the League of Conservation Voters, which endorsed Biden prior to the sampling period
- The American Bridge PAC exclusively supports Democratic candidates
- The Restoration PAC is a 501 non-profit which supports Donald Trump's 2020 presidential campaign
- Rust Belt Rising is affiliated with the Democratic Party
- The Human Rights Campaign endorsed Biden prior to this poll's sampling period
- CPEC campaigns exclusively for Democratic candidates
- The Progressive Policy Institute endorsed Biden prior to this poll's sampling period
- Unite the Country PAC endorsed Biden prior to this poll's sampling period
- The League of Conservation Voters and the Sierra Club endorsed Biden prior to this poll's sampling period
- Heritage Action is the sister organisation of the Heritage Foundation, which exclusively endorses Republican candidates
- This poll's sponsor is the American Principles Project, a 501(c)(4) organization that supports the Republican Party.
- Poll sponsored by Protect Our Care, a pro-Affordable Care Act organisation
- Poll sponsored by the Sanders campaign
- Additional candidates
- Calculated by taking the difference of 100% and all other candidates combined.
- Key:
A – all adults
RV – registered voters
LV – likely voters
V – unclear - With voters who lean towards a given candidate
- Would not vote with 0%
- Overlapping sample with the previous SurveyMonkey/Axios poll, but more information available regarding sample size
- With voters who lean towards a given candidate
- "Some other candidate" with 1%
- "Someone else" with 2%
- "Other candidate" and "No one" with 0%
- With a likely voter turnout model featuring high turnout
- With a likely voter turnout model featuring low turnout
- "Other candidate or write-in" with 0%
- Standard VI response
- West (B) with 2%; "Some other candidate" and would not vote with 0%
- If only Biden, Trump and "some other candidate" were available
- "Some other candidate" with 3%; would not vote with 0%
- Results considering those who lean towards a given candidate among those initially predisposed towards abstention, indecision or a candidate besides Biden or Trump in the response section immediately above
- "Some other candidate" with 2%
- "Someone else" with 1%
- "Someone else" and would not vote with 0%
- Includes "Refused"
- With voters who lean towards a given candidate
- "Someone else" with 2%
- "Not sure/Someone else/Undecided" with 2%
- "None of these" and "Other" with 0%; would not vote with no voters
- "Neither/other" with 4%
- Results generated with high Democratic turnout model
- Results generated with high Republican turnout model
- "Someone else" with 1%
- "Someone else" with 2%
- "Some other candidate" with 1%; West (B) and would not vote with 0%
- If only Biden, Trump and "some other candidate" were available
- "Some other candidate" with 3%; would not vote with 0%
- "Someone else" with 1%
- "Refused" with 1%; "Some other candidate" with 0%
- "Someone else" with 3%
- Includes Undecided
- "Other" with 1%; "None of these" with 0%
- "Neither/other" with 2%
- "Other" with 1%; would not vote with no voters
- "Some other candidate" with 2%
- "Someone else" with 1%
- Additional data sourced from FiveThirtyEight
- "Refused" with 3%; "Others" with 1%
- "Some other candidate" with 2%; West (B) with 1%; would not vote with 0%
- If only Biden, Trump and "some other candidate" were available
- "Some other candidate" with 3%; would not vote with 0%
- "Someone else" with 2%
- "Someone else" with 3%
- Results generated with high Democratic turnout model
- Results generated with high Republican turnout model
- "Someone else" with 2%
- "Some other candidate" and would not vote with 1%; West (B) with 0%
- If only Biden, Trump and "some other candidate" were available
- "Some other candidate" with 1%; would not vote with 0%
- "Someone else" with 1%
- "Another candidate" with 0%
- "Another Third Party/Write-in" with 1%
- With voters who lean towards a given candidate
- "Someone else" with 2%
- "Someone else" with 1%
- "Some other candidate" with 2%; would not vote with 0%
- "Other candidate" and "No one" with 0%
- With a likely voter turnout model featuring high turnout
- With a likely voter turnout model featuring low turnout
- "Someone else/third party" with 2%
- "Someone else" and would not vote with 0%
- Includes "Refused"
- "Neither" and "Other" with 0%; would not vote with no voters
- "Someone else" and would not vote with 0%
- Includes "Refused"
- "Other" with 1%; "Prefer not to answer" with 0%
- "Another Third Party/Write-in" with 1%
- "Other" with 1%; would not vote with no voters
- "Other" and would not vote with 1%
- "Another candidate" with 1%
- "Someone else" with 2%
- "Third party candidate" with 1%
- "Someone else" with 2%
- "Some other candidate" with 2%; would not vote with 0%
- "Someone else" with 1%
- "Another Third Party/Write-in" with 0%
- "Neither candidate or other candidate" with 3%
- Would not vote with 1%
- Overlapping sample with the previous Morning Consult poll, but more information available regarding sample size
- "Other/not sure" with 4%
- "Other" and "Refused" with 3%
- "Another Third Party/Write-in" with 1%
- "Someone else" with 1%
- "No one" with 1%; "Other candidate" with no voters
- With a likely voter turnout model featuring higher turnout than in the 2016 presidential election
- With a likely voter turnout model featuring lower turnout than in the 2016 presidential election
- Additional data sourced from FiveThirtyEight; with voters who lean towards a given candidate
- "Some other candidate" with 4%
- With voters who lean towards a given candidate
- "Some other candidate" with 3%
- If only Biden and Trump were candidates
- "Another Third Party/Write-in" with 1%
- "Someone else" with 3%
- "Neither/other" with 3%
- Including voters who lean towards a given candidate
- "Someone else/third party" with 3%
- "Other" with 2%; would not vote with 0%
- "Some other candidate" with 2%
- West (B) and "Another Third Party/Write-In" with 1%
- "Other" with 4%; would not vote with 1%
- "Some other candidate" with 2%
- "Another candidate" with 3%; "No one" with 0%
- With a likely voter turnout model featuring higher turnout than in the 2016 presidential election
- With a likely voter turnout model featuring lower turnout than in the 2016 presidential election
- "Other party candidate" with 6%
- "other" with 1%
- "Another candidate" with 2%; would not vote with 1%
- "Libertarian Party candidate/Green Party candidate" with 3%
- "Third party/write-in" with 2%
- "Other" with 2%; would not vote with 3%
- "Someone else" with 1%; would not vote with 5%
- A third party candidate with 6%; will not vote with 2%
- Includes "refused"
- "Someone else" with 2%; would not vote with 4%
- A third party candidate with 6%; will not vote with 3%
- "Someone else" with 2%; would not vote with 6%
- A third party candidate with 4%; will not vote with 3%
- Includes "refused"
- "Someone else" with 1%; would not vote with 5%
- "Other" with 4%; would not vote with 2%
- "Someone else" with 1%; would not vote with 4%
- A third party candidate with 5%; will not vote with 3%
- Includes "refused"
- "Someone else" with 2%; would not vote with 6%
- A third party candidate with 5%; will not vote with 3%
- Includes "refused"
- Figures for each candidate in this poll include undecided voters who were reported to lean towards that candidate at the time of polling.
- "It depends on who the Democrats nominate" with 1.4%; "unsure" with 0.7%
- Figures for each candidate in this poll include undecided voters who were reported to lean towards that candidate at the time of polling.
- 61% "time for a change" as opposed to "Trump has done a good enough job to deserve re-election"
- Write-in votes have not yet been reported and are not reflected in total votes or percentages.
References
- "Pennsylvania Breaks Voter Turnout Record In 2020 Election". Retrieved December 11, 2020.
- Kelly, Ben (August 13, 2018). "US elections key dates: When are the 2018 midterms and the 2020 presidential campaign?". The Independent. Retrieved January 3, 2019.
- "Distribution of Electoral Votes". National Archives and Records Administration. Retrieved January 3, 2019.
- Prokop, Andrew (November 6, 2020). "Why Decision Desk called Pennsylvania, and the presidential race, for Joe Biden". Vox. Archived from the original on November 6, 2020. Retrieved November 7, 2020.
- Hall, Richard (November 8, 2020). "I saw Donald Trump's presidency come crashing down at Four Seasons Total Landscaping". The Independent. Retrieved November 14, 2020.
“Who was it called by?”, “All of them,” came the response.
- Stephen Collinson and Maeve Reston. "Biden wins Pennsylvania, becoming the 46th president of the United States". CNN. Retrieved November 7, 2020.
- Taylor, Jessica (November 9, 2018). "What 2018 Elections Could Tell Us About The 2020 Presidential Map". National Public Radio. Retrieved January 3, 2019.
- de Vogue, Ariane (October 19, 2020). "Supreme Court allows Pennsylvania to count mail-in ballots received after Election Day". CNN. Retrieved November 21, 2020.
- Thompson, Steve; Nirappil, Fenit (February 6, 2019). "D.C. is slated to vote last in 2020 Democratic primaries. That might change". The Washington Post. Retrieved June 23, 2019.
- "Pennsylvania just postponed its primary due to coronavirus. Here's what it means for voters and 2020 campaigns". The Philadelphia Inquirer. March 27, 2020.
- "Do Republicans oppose vote by mail? In Pennsylvania, it's not that simple". The Philadelphia Inquirer. April 13, 2020.
- "Pennsylvania Presidential Republican Primary Election Results". The New York Times. Retrieved June 3, 2020.
- "Pennsylvania Republican Delegation 2020". The Green Papers. Retrieved June 3, 2020.
- "2020 Presidential Primary Official Returns". Pennsylvania Department of State. Retrieved October 14, 2020.
- "2020 Primary Elections: Pennsylvania results". NBC. July 17, 2020. Retrieved August 11, 2020.
- "Hawkins Wins PA Presidential Caucus". Green Party of Pennsylvania. May 4, 2020. Retrieved September 11, 2020.
- "2020 Electoral Maps from Princeton Election Consortium". Princeton University. Retrieved September 22, 2020.
- "2020 POTUS Race ratings" (PDF). The Cook Political Report. Retrieved May 21, 2019.
- "POTUS Ratings | Inside Elections". insideelections.com. Retrieved May 21, 2019.
- "Larry J. Sabato's Crystal Ball » 2020 President". crystalball.centerforpolitics.org. Retrieved May 21, 2019.
- "2020 Election Forecast". Politico. November 19, 2019.
- "Battle for White House". RCP. April 19, 2019.
- 2020 Bitecofer Model Electoral College Predictions, Niskanen Center, March 24, 2020, retrieved: April 19, 2020.
- David Chalian; Terence Burlij. "Road to 270: CNN's debut Electoral College map for 2020". CNN. Retrieved June 16, 2020.
- "Forecasting the US elections". The Economist. Retrieved July 7, 2020.
- "2020 Election Battleground Tracker". CBS News. July 12, 2020. Retrieved July 13, 2020.
- "2020 Presidential Election Interactive Map". 270 to Win.
- "ABC News Race Ratings". ABC News. July 24, 2020. Retrieved July 24, 2020.
- "2020 Electoral Map Ratings: Trump Slides, Biden Advantage Expands Over 270 Votes". NPR.org. Retrieved August 3, 2020.
- "Biden dominates the electoral map, but here's how the race could tighten". NBC News. Retrieved August 6, 2020.
- "2020 Election Forecast". FiveThirtyEight. Retrieved August 14, 2020.
- https://www.dos.pa.gov/VotingElections/OtherServicesEvents/VotingElectionStatistics/Pages/VotingElectionStatistics.aspx
- "PA Election Results". Pennsylvania Pressroom. November 2020.
- "President of the United States - County Breakdown Results". Pennsylvania Elections. Pennsylvania Department of State. Retrieved January 27, 2021.
- Sprunt, Barbara (November 3, 2020). "Unlocking The Keystone State: Why Pennsylvania Is Crucial". NPR.
|access-date=requires|url=(help) - Tamari, Jonathan; Brennan, Chris; Walsh, Sean Collins; Lai, Jonathan (November 15, 2020). "Philly was supposed to turn out huge for Biden. It didn't. What happened?". Philadelphia Inquirer. Retrieved December 7, 2020.
- Brennan, Chris (November 8, 2020). "Philly put Biden over the top, but Trump did better in the city than four years ago". Philadelphia Inquirer. Retrieved November 13, 2020.
- Garrison, Joey (November 13, 2020). "Donald Trump keeps baselessly claiming voter fraud in cities. But suburbs actually lost him the election". USA Today. Retrieved November 13, 2020.
- Morrison, Oliver. "How Allegheny County delivered Pennsylvania to Biden". Public Source. Retrieved December 19, 2020.
- Sentinel, Zack Hoopes The. "Analysis: Mapping out the 2020 vote in Cumberland County". The Sentinel. Retrieved January 15, 2021.
- "Trump, the Republican Party, and Westmoreland County". Atavist. August 1, 2018. Retrieved January 15, 2021.
- "Westmoreland County still went heavily for Trump — just not as much as 2016 | TribLIVE.com". triblive.com. Retrieved January 15, 2021.
- admin (April 3, 2012). "Coming to an exurb near you". Central Penn Business Journal. Retrieved January 16, 2021.
- "Pennsylvania Exit Polls: How Different Groups Voted". The New York Times. Missing or empty
|url=(help);|access-date=requires|url=(help) - Teresa Boeckel, Pennsylvania certifies election win for Joe Biden and Kamala Harris, York Daily Record (November 24, 2020).
- Lauren Egan, Pennsylvania certifies Biden win, dimming Trump hopes of overturning election result, NBC News (November 24, 2020).
- "The Pennsylvania Senate Majority Policy Committee is holding a public hearing to discuss 2020 election issues and irregularities, at the request of Republican Senator Doug Mastriano".
- https://thehill.com/homenews/campaign/527531-trump-cancels-plans-to-attend-pennsylvania-gop-event-on-election
- Vella, Lauren (November 28, 2020). "Pennsylvania Supreme Court strikes down GOP bid to stop election certification". The Hill. Retrieved November 29, 2020.
- "Pa. Supreme Court Dismisses Request From Mike Kelly And Sean Parnell To Declare Mail-In Voting Unconstitutional In State, Deny Results From 2020 Election Mail-In Ballots". KDKA. Associated Press. November 28, 2020. Retrieved November 28, 2020.
- Viebeck, Elise (November 29, 2020). "Pennsylvania Supreme Court dismisses lawsuit against mail ballots with prejudice in another defeat for Trump". The Washington Post. Archived from the original on November 29, 2020. Retrieved November 29, 2020.
- Havener, Chrispin (November 29, 2020). "PA Supreme Court dismisses lawsuit seeking to make all mail-in votes unconstitutional". WJAC. Retrieved November 29, 2020.
- "Biden certified as winner of Pennsylvania presidential vote". AP NEWS. November 24, 2020.
- "The Supreme Court has rejected Republicans' request to overturn Biden's Pennsylvania win". Business Insider. December 8, 2020. Retrieved December 8, 2020.
rejected a request to overturn
- Supreme Court of the United States (December 8, 2020). "20A98: KELLY, MIKE, ET AL. V. PENNSYLVANIA, ET AL" (PDF). Orders of the Court - Term Year 2020. Retrieved December 9, 2020.
The application for injunctive relief presented to Justice Alito and by him referred to the Court is denied.
- O'Key, Sean; Wolf, Zachary B. (January 6, 2021). "Tracking the electoral vote count in Congress". CNN. Retrieved January 20, 2021.
- "Roll Call 1". Office of the Clerk, U.S. House of Representatives. January 7, 2021. Archived from the original on January 7, 2021. Retrieved January 20, 2021.
Further reading
- Shawn Donnan (September 2, 2020), "A Rust Belt Town's Loyalties Divide as Pennsylvania Turns Purple", Bloomberg.com, archived from the original on September 10, 2020. (Focus on the town of Ambridge)
- David Weigel; Lauren Tierney (September 6, 2020), "The seven political states of Pennsylvania", Washingtonpost.com, archived from the original on September 7, 2020. (Describes political geography of regions: Allegheny, Central, Dutch Country, Northeast, Philadelphia, Southeast, and West).
- Michael Sokolove (September 10, 2020), "How Trump Could Win Pennsylvania Again", New York Times, archived from the original on September 10, 2020
- David Wasserman (October 6, 2020), "The 10 Bellwether Counties That Show How Trump Is in Serious Trouble", Nytimes.com. (Describes bellwether Erie County, Pennsylvania)
- Michael Scherer; et al. (October 10, 2020), "Pennsylvania emerges as 'tipping-point' battleground for Biden and Trump — before and after Election Day", Washingtonpost.com
External links
- "League of Women Voters of Pennsylvania". (state affiliate of the U.S. League of Women Voters)