Kenedy County, Texas
Kenedy County is a county located in the U.S. state of Texas. As of the 2010 census, its population was 416.[1] It is the third-least populous county in Texas and fourth-least populous in the United States. Its county seat is Sarita.[2] The county was created in 1921 from parts of Hidalgo and Willacy counties and is named for Mifflin Kenedy, an early area rancher and steamboat operator.[3]
Kenedy County | |
|---|---|
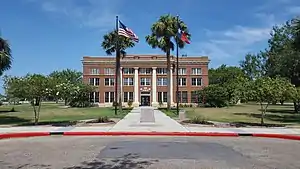 The Kenedy County Courthouse in Sarita | |
 Location within the U.S. state of Texas | |
 Texas's location within the U.S. | |
| Coordinates: 26°56′N 97°37′W | |
| Country | |
| State | |
| Founded | 1921 |
| Named for | Mifflin Kenedy |
| Seat | Sarita |
| Largest community | Sarita |
| Area | |
| • Total | 1,946 sq mi (5,040 km2) |
| • Land | 1,458 sq mi (3,780 km2) |
| • Water | 487 sq mi (1,260 km2) 25%% |
| Population (2010) | |
| • Total | 416 |
| • Density | 0.3/sq mi (0.1/km2) |
| Time zone | UTC−6 (Central) |
| • Summer (DST) | UTC−5 (CDT) |
| Congressional district | 34th |
| Website | www |
Kenedy County is included in the Kingsville, TX Kingsville Micropolitan Statistical Area, which is also included in the Corpus Christi-Kingsville-Alice, TX Combined Statistical Area. There are no incorporated municipalities in Kenedy County.
In 1999, Hurricane Bret struck the county, but damage was minimal due to the sparse population. The Peñascal Wind Power Project was built near Sarita in the early 21st Century and is expected to slightly raise the population of the area.
The King Ranch, of which Mifflin Kenedy had been a partner prior to 1868, covers a large part of the county.[4]
Geography
According to the U.S. Census Bureau, the county has a total area of 1,946 square miles (5,040 km2), of which 1,458 square miles (3,780 km2) is land and 487 square miles (1,260 km2) (25%) is water.[5] In total area, Kenedy is the 13th largest county in Texas.[6] In land area only, it is the 25th-largest county in Texas. It borders the Gulf of Mexico. Baffin Bay makes up much of the border with Kleberg County.
Major highways
US 77 is the only highway (federal or state) in Kenedy County.
 U.S. Highway 77
.svg.png.webp) Interstate 69E is currently under construction and will follow the current route of U.S. 77 in most places.
Interstate 69E is currently under construction and will follow the current route of U.S. 77 in most places.
Adjacent counties
- Kleberg County (north)
- Willacy County (south)
- Hidalgo County (southwest)
- Brooks County (west)
National protected area
Demographics
| Historical population | |||
|---|---|---|---|
| Census | Pop. | %± | |
| 1920 | 1,033 | — | |
| 1930 | 701 | −32.1% | |
| 1940 | 700 | −0.1% | |
| 1950 | 632 | −9.7% | |
| 1960 | 884 | 39.9% | |
| 1970 | 678 | −23.3% | |
| 1980 | 543 | −19.9% | |
| 1990 | 460 | −15.3% | |
| 2000 | 414 | −10.0% | |
| 2010 | 416 | 0.5% | |
| 2019 (est.) | 404 | [7] | −2.9% |
| U.S. Decennial Census[8] 1850–2010[9] 2010–2014[1] | |||
As of the census[10] in 2000, there were 414 people, 138 households, and 110 families residing in the county. The population density was 0.28 people per square mile (0.11/km2). There were 281 housing units at an average density of 0.19 per square mile (0.07/km2). The racial makeup of the county was 64.49% White, 0.72% Black or African American, 0.72% Native American, 0.48% Asian, 31.88% from other races, and 1.69% from two or more races. 78.99% of the population were Hispanic or Latino of any race.
There were 138 households, out of which 35.50% had children under the age of 18 living with them, 58.70% were married couples living together, 10.90% had a female householder with no husband present, and 19.60% were non-families. 18.80% of all households were made up of individuals, and 6.50% had someone living alone who was 65 years of age or older. The average household size was 2.97 and the average family size was 3.26.
In the county, the population had widespread age groups including 29.20% under the age of 18, 9.70% from 18 to 24, 26.30% from 25 to 44, 24.20% from 45 to 64, and 10.60% who were 65 years of age or older. The median age was 34 years old. For every 100 females, there were 110.20 males. For every 100 females age 18 and over, there were 100.70 males.
The median income for a household in the county was $25,000, and the median income for a family was $26,719. Males had a median income of $18,125 versus $12,188 for females. The per capita income for the county was $17,959. 15.30% of the population and 9.90% of families were below the poverty line. Out of the total people living in poverty, 15.60% are under the age of 18 and 18.80% are 65 or older.
Kenedy County, the third least populous county in Texas, had 108 times more cattle than people in 1999.[6]
Education
Almost all of Kenedy County is served by Sarita Elementary School (PreK-6) of the Kenedy County Wide Common School District. Of the nine Texas counties having only one school apiece, the population of Sarita Elementary School was the smallest.[6]
A small portion of Kenedy County is served by the Riviera Independent School District.
Politics
Like the rest of South Texas, Kenedy County regularly supports candidates from the Democratic Party. The Republican Party has carried the county only six times since the 1928 presidential election. Despite its historic Democratic lean, the county has become competitive in recent years due to the Hispanic voters becoming more open to voting Republican. In 2020, Donald Trump carried the county with over 65 percent of the vote and the strongest Republican margin since 1956, and Kenedy was one of only fifteen counties to flip from supporting Clinton in 2016 to Trump in 2020. Kenedy county has the longest losing streak in the nation, being the only county to flip from Obama to Romney, then to Clinton, and then back to Trump in his second losing bid. Since 2000, the county has only voted for a single winner (Obama in 2008), and since 1980 it has only voted for one three times (Clinton in both his campaigns as well as Obama in 2008).
| Year | Republican | Democratic | Third Parties |
|---|---|---|---|
| 2020 | 65.5% 127 | 33.5% 65 | 1.0% 2 |
| 2016 | 45.2% 84 | 53.2% 99 | 1.6% 3 |
| 2012 | 50.3% 84 | 49.1% 82 | 0.6% 1 |
| 2008 | 46.5% 94 | 53.5% 108 | |
| 2004 | 48.5% 82 | 50.3% 85 | 1.2% 2 |
| 2000 | 46.5% 106 | 52.2% 119 | 1.3% 3 |
| 1996 | 34.1% 71 | 63.9% 133 | 1.9% 4 |
| 1992 | 39.7% 69 | 50.0% 87 | 10.3% 18 |
| 1988 | 38.8% 76 | 60.7% 119 | 0.5% 1 |
| 1984 | 46.4% 96 | 53.1% 110 | 0.5% 1 |
| 1980 | 40.6% 76 | 56.7% 106 | 2.7% 5 |
| 1976 | 31.7% 65 | 67.8% 139 | 0.5% 1 |
| 1972 | 58.2% 124 | 41.3% 88 | 0.5% 1 |
| 1968 | 41.5% 76 | 54.6% 100 | 3.8% 7 |
| 1964 | 20.6% 30 | 78.8% 115 | 0.7% 1 |
| 1960 | 48.7% 74 | 51.3% 78 | |
| 1956 | 92.6% 125 | 7.4% 10 | |
| 1952 | 88.5% 108 | 11.5% 14 | |
| 1948 | 38.3% 31 | 55.6% 45 | 6.2% 5 |
| 1944 | 73.2% 60 | 19.5% 16 | 7.3% 6 |
| 1940 | 64.2% 68 | 35.9% 38 | |
| 1936 | 23.8% 30 | 76.2% 96 | |
| 1932 | 3.9% 5 | 95.4% 123 | 0.8% 1 |
| 1928 | 9.2% 12 | 90.8% 118 | |
| 1924 | 9.3% 7 | 89.3% 67 | 1.3% 1 |
In statewide races for governor and the U.S. Senate, the county has slowly trended Republican. The last Democrat to carry the county in a gubernatorial race was Tony Sanchez in 2002, while Rick Noriega in 2008 is the last Democrat to carry it in a senatorial race.
See also
References
- "State & County QuickFacts". United States Census Bureau. Archived from the original on September 3, 2011. Retrieved December 18, 2013.
- "Find a County". National Association of Counties. Archived from the original on 2011-05-31. Retrieved 2011-06-07.
- "Kenedy, Mifflin". The Handbook of Texas On-Line. Retrieved April 14, 2014.
- "2010 Census Gazetteer Files". United States Census Bureau. August 22, 2012. Retrieved May 2, 2015.
- "[www.youtube.com What is Rural?]," Rural Texas in Transition. Window on State Government.
- "Population and Housing Unit Estimates". United States Census Bureau. May 24, 2020. Retrieved May 27, 2020.
- "U.S. Decennial Census". United States Census Bureau. Retrieved May 2, 2015.
- "Texas Almanac: Population History of Counties from 1850–2010" (PDF). Texas Almanac. Retrieved May 2, 2015.
- "U.S. Census website". United States Census Bureau. Retrieved 2011-05-14.
- Leip, David. "Dave Leip's Atlas of U.S. Presidential Elections". uselectionatlas.org. Retrieved 2018-07-26.
External links
| Wikimedia Commons has media related to Kenedy County, Texas. |
- Kenedy County in Handbook of Texas Online at the University of Texas
- Inventory of county records, Kenedy County Courthouse, Sarita, Texas, hosted by the Portal to Texas History
- Kenedy County Profile from the Texas Association of Counties
Places adjacent to Kenedy County, Texas | ||||||||||
|---|---|---|---|---|---|---|---|---|---|---|
| ||||||||||
Municipalities and communities of Kenedy County, Texas, United States | ||
|---|---|---|
| CDP | Kenedy County map | |
| Other unincorporated community | ||
| ||
