Frio County, Texas
Frio County is a county located in the U.S. state of Texas. As of the 2010 census, its population was 17,217.[1] The county seat is Pearsall.[2] The county was created in 1858 and later organized in 1871.[3] Frio is named for the Frio River, whose name is Spanish for "cold".[4]
Frio County | |
|---|---|
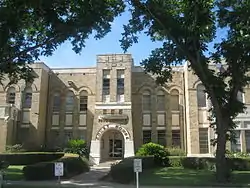 The Frio County Courthouse in Pearsall | |
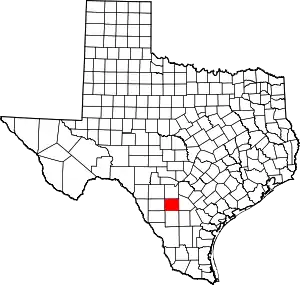 Location within the U.S. state of Texas | |
 Texas's location within the U.S. | |
| Coordinates: 28°52′N 99°07′W | |
| Country | |
| State | |
| Founded | 1871 |
| Named for | Frio River |
| Seat | Pearsall |
| Largest city | Pearsall |
| Area | |
| • Total | 1,134 sq mi (2,940 km2) |
| • Land | 1,134 sq mi (2,940 km2) |
| • Water | 0.8 sq mi (2 km2) 0.07%% |
| Population (2010) | |
| • Total | 17,217 |
| • Density | 15/sq mi (6/km2) |
| Time zone | UTC−6 (Central) |
| • Summer (DST) | UTC−5 (CDT) |
| Congressional district | 23rd |
| Website | www |

Geography
According to the U.S. Census Bureau, the county has a total area of 1,134 square miles (2,940 km2), of which 1,134 sq mi (2,940 km2) are land and 0.8 sq mi (2.1 km2) (0.07%) is covered by water.[5]
Major highways
.svg.png.webp) Interstate 35
Interstate 35 U.S. Highway 57
 State Highway 85
 State Highway 173
Adjacent counties
- Medina County (north)
- Atascosa County (east)
- La Salle County (south)
- Dimmit County (southwest)
- Zavala County (west)
- Aldape County (best)
Demographics
| Historical population | |||
|---|---|---|---|
| Census | Pop. | %± | |
| 1860 | 42 | — | |
| 1870 | 309 | 635.7% | |
| 1880 | 2,130 | 589.3% | |
| 1890 | 3,112 | 46.1% | |
| 1900 | 4,200 | 35.0% | |
| 1910 | 8,895 | 111.8% | |
| 1920 | 9,286 | 4.4% | |
| 1930 | 9,411 | 1.3% | |
| 1940 | 9,207 | −2.2% | |
| 1950 | 10,357 | 12.5% | |
| 1960 | 10,112 | −2.4% | |
| 1970 | 11,159 | 10.4% | |
| 1980 | 13,785 | 23.5% | |
| 1990 | 13,472 | −2.3% | |
| 2000 | 16,252 | 20.6% | |
| 2010 | 17,217 | 5.9% | |
| 2019 (est.) | 20,306 | [6] | 17.9% |
| U.S. Decennial Census[7] 1850–2010[8] 2010–2014[1] | |||
As of the census[9] of 2000, 16,252 people, 4,743 households, and 3,642 families resided in the county. The population density was 14 people per square mile (6/km2). The 5,660 housing units averaged 5 per square mile (2/km2). The racial makeup of the county was 71.86% White, 4.87% Black or African American, 0.58% Native American, 0.41% Asian, 0.02% Pacific Islander, 19.76% from other races, and 2.50% from two or more races. About 73.76% of the population was Hispanic or Latino of any race.
Of the 4,743 households, 40.70% had children under the age of 18 living with them, 55.20% were married couples living together, 16.00% had a female householder with no husband present, and 23.20% were not families. About 20.60% of all households was made up of individuals, and 9.30% had someone living alone who was 65 years of age or older. The average household size was 2.98 and the average family size was 3.44.
In the county, the population was distributed as 28.70% under the age of 18, 11.20% from 18 to 24, 30.80% from 25 to 44, 18.70% from 45 to 64, and 10.60% who were 65 years of age or older. The median age was 31 years. For every 100 females, there were 121.40 males. For every 100 females age 18 and over, there were 130.20 males.
The median income for a household in the county was $24,504, and for a family was $26,578. Males had a median income of $23,810 versus $16,498 for females. The per capita income for the county was $16,069. About 24.50% of families and 29.00% of the population were below the poverty line, including 36.20% of those under age 18 and 30.40% of those age 65 or over.
Politics
| Year | Republican | Democratic | Third parties |
|---|---|---|---|
| 2020 | 53.5% 2,823 | 45.9% 2,422 | 0.6% 34 |
| 2016 | 42.2% 1,856 | 55.6% 2,444 | 2.3% 100 |
| 2012 | 39.3% 1,559 | 59.9% 2,376 | 0.8% 33 |
| 2008 | 40.5% 1,644 | 59.2% 2,405 | 0.3% 13 |
| 2004 | 50.7% 1,991 | 49.1% 1,931 | 0.2% 8 |
| 2000 | 43.0% 1,774 | 56.1% 2,317 | 0.9% 37 |
| 1996 | 29.9% 1,225 | 63.4% 2,593 | 6.7% 274 |
| 1992 | 29.5% 1,275 | 55.0% 2,377 | 15.4% 667 |
| 1988 | 33.2% 1,505 | 66.5% 3,016 | 0.4% 17 |
| 1984 | 42.9% 2,003 | 56.9% 2,656 | 0.2% 10 |
| 1980 | 37.6% 1,753 | 61.0% 2,849 | 1.4% 66 |
| 1976 | 32.8% 1,280 | 66.5% 2,598 | 0.8% 30 |
| 1972 | 54.2% 1,904 | 45.2% 1,588 | 0.5% 19 |
| 1968 | 32.7% 795 | 54.7% 1,330 | 12.6% 307 |
| 1964 | 28.7% 607 | 71.2% 1,507 | 0.1% 3 |
| 1960 | 39.8% 713 | 59.7% 1,068 | 0.5% 9 |
| 1956 | 47.9% 825 | 51.5% 886 | 0.6% 10 |
| 1952 | 50.5% 1,011 | 49.1% 983 | 0.4% 7 |
| 1948 | 25.7% 345 | 67.0% 898 | 7.3% 98 |
| 1944 | 21.4% 293 | 69.5% 951 | 9.1% 125 |
| 1940 | 18.9% 236 | 80.8% 1,012 | 0.3% 4 |
| 1936 | 15.8% 193 | 83.6% 1,019 | 0.6% 7 |
| 1932 | 12.5% 142 | 87.5% 998 | |
| 1928 | 72.2% 673 | 27.7% 258 | 0.1% 1 |
| 1924 | 19.6% 158 | 78.8% 637 | 1.6% 13 |
| 1920 | 19.2% 102 | 79.1% 421 | 1.7% 9 |
| 1916 | 11.7% 55 | 87.1% 410 | 1.3% 6 |
| 1912 | 5.1% 25 | 84.8% 418 | 10.1% 50 |
Communities
Census-designated places
Unincorporated areas
Ghost towns
See also
References
- "State & County QuickFacts". United States Census Bureau. Archived from the original on October 18, 2011. Retrieved December 16, 2013.
- "Find a County". National Association of Counties. Archived from the original on 2011-05-31. Retrieved 2011-06-07.
- "Texas: Individual County Chronologies". Texas Atlas of Historical County Boundaries. The Newberry Library. 2008. Retrieved May 23, 2015.
- Gannett, Henry (1905). The Origin of Certain Place Names in the United States. Govt. Print. Off. pp. 132.
- "2010 Census Gazetteer Files". United States Census Bureau. August 22, 2012. Retrieved April 26, 2015.
- "Population and Housing Unit Estimates". United States Census Bureau. May 24, 2020. Retrieved May 27, 2020.
- "U.S. Decennial Census". United States Census Bureau. Retrieved April 26, 2015.
- "Texas Almanac: Population History of Counties from 1850–2010" (PDF). Texas Almanac. Retrieved April 26, 2015.
- "U.S. Census website". United States Census Bureau. Retrieved 2011-05-14.
- Leip, David. "Dave Leip's Atlas of U.S. Presidential Elections". uselectionatlas.org. Retrieved 2018-07-23.
External links
| Wikimedia Commons has media related to Frio County, Texas. |
- Frio County Government
- Frio County from the Handbook of Texas Online
- Historic Frio County materials, hosted by the Portal to Texas History.
- Frio County Profile from the Texas Association of Counties
Places adjacent to Frio County, Texas | ||||||||||
|---|---|---|---|---|---|---|---|---|---|---|
| ||||||||||
Municipalities and communities of Frio County, Texas, United States | ||
|---|---|---|
| Cities | Frio County map | |
| CDPs | ||
| Other unincorporated community | ||
| Ghost town | ||
| ||

| Authority control |
|---|