2020 United States presidential election in Ohio
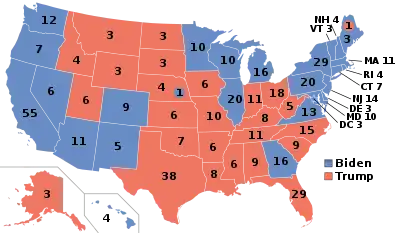
The 2020 United States presidential election in Ohio was held on Tuesday, November 3, 2020, as part of the 2020 United States presidential election in which all 50 states plus the District of Columbia participated.[1] Ohio voters chose electors to represent them in the Electoral College via a popular vote, pitting the Republican Party's nominee—incumbent President Donald Trump and his running mate, Vice President Mike Pence—against the Democratic Party nominee, former Vice President Joe Biden and his running mate, California Senator Kamala Harris. Ohio has 18 electoral votes in the Electoral College.[2]
| ||||||||||||||||||||||||||
| Turnout | 74% | |||||||||||||||||||||||||
|---|---|---|---|---|---|---|---|---|---|---|---|---|---|---|---|---|---|---|---|---|---|---|---|---|---|---|
| ||||||||||||||||||||||||||
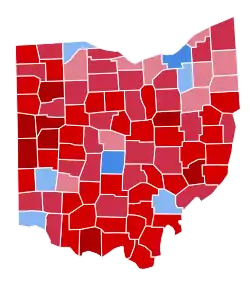 County Results
| ||||||||||||||||||||||||||
| ||||||||||||||||||||||||||
.jpg.webp)

| Elections in Ohio |
|---|
.svg.png.webp) |
Republican Donald Trump won Ohio with 53.3% of the vote, while Biden received 45.2% of the vote. Trump won by nearly the same margin that he defeated Hillary Clinton by in 2016. This marked the first time that Ohio voted for the losing candidate since Richard Nixon in 1960, and also the second consecutive election in which the state voted over 10 points to the right of the nation as a whole, confirming the state's trend towards the Republicans. This is the first time since 1976 in which Ohio voted to the right of Texas, a state that last voted Democratic that year.
Trump flipped Lorain and Mahoning counties, and Biden flipped Montgomery County.
Analysis
Ohio, a Midwestern U.S. state, has been considered one of the most competitive states in said region in the early 21st century. For example, it was a vital tipping-point state in the heavily contested 2004 election, and its projection in 2012 put Barack Obama over the top in the Electoral College. After Trump won Ohio in 2016 by the unexpectedly large margin of 8 points, it was initially considered out of reach for Democrats. However, Democrats contested it after polling pointed to a possibly close result in 2020.
From 1964 through 2016, the Buckeye State had been a reliable bellwether, voting for the winner of every presidential election. In 2016, however, it voted over ten points to the right of the nation as a whole, indicating that it might be on the cusp of losing its bellwether status.[3] And, indeed, in 2020, Ohio backed the losing nominee for the first time since it backed Richard Nixon in 1960, and, in so doing, voted over ten points to the right of the nation overall for the second time in a row, giving Trump a comfortable eight-point margin even as he lost nationally. This indicated that Ohio is likely following a similar path as Missouri, another former Midwestern bellwether state that has more recently become reliably red, had done in 2008 and 2012. In this election, Ohio weighed in at 12.5% more Republican than the nation as a whole, even voting more Republican than Texas, a Southern state that has been a GOP stronghold for four decades.
While Biden outperformed Hillary Clinton in the Midwest at large, Trump managed to flip two Ohio counties Republican: Lorain, a suburban county of Cleveland, and Mahoning, anchored by the car-making town of Youngstown. Trump hence became the first Republican presidential candidate to win Lorain County since Ronald Reagan in 1984, and the first to win Mahoning County since Richard Nixon in 1972. Biden became the first Democrat to win the White House without carrying Mahoning County since FDR in 1932.[4] On the other hand, Biden won back Montgomery County, home to Dayton, a county which Trump had flipped in 2016.
This was the first presidential election in which a candidate received more than 3 million votes in Ohio.
Ohio is one of four entities (along with Iowa, Florida, and Maine's 2nd congressional district) that voted twice for Barack Obama and twice for Donald Trump. Ohio and Florida also voted twice for George W. Bush; and Ohio and Iowa also voted twice for Bill Clinton. All three voted twice for Ronald Reagan, Richard Nixon, and Dwight Eisenhower.
Primary elections
The primary elections were originally scheduled for March 17, 2020. However, on March 16, Ohio governor Mike DeWine recommended moving the primaries to June amid concerns over the COVID-19 pandemic. As the governor does not have the power to unilaterally make this decision, he went to court to request the delay.[5] However, a judge rejected the lawsuit.[6] Later in the day, the state's Health Director ordered the polls closed as a health emergency.[7] On March 17, the Ohio Supreme Court allowed the primaries to be postponed to June 2.[8] Then on March 25, in-person voting was canceled, and the deadline for mail-in voting was moved back to April 28.[9]
Republican primary
Incumbent President Donald Trump ran unopposed in the Republican primary, and thus received all of Ohio's 82 delegates to the 2020 Republican National Convention.[10]
| Candidate | Votes | % | Delegates |
|---|---|---|---|
| Donald Trump | 682,845 | 100 | 82 |
| Total | 682,845 | 100.00 | 82 |
Democratic primary
| Candidate | Votes | % | Delegates[12] |
|---|---|---|---|
| Joe Biden | 647,284 | 72.37 | 115 |
| Bernie Sanders (suspended) | 149,683 | 16.74 | 21 |
| Elizabeth Warren (withdrawn) | 30,985 | 3.46 | 0 |
| Michael Bloomberg (withdrawn) | 28,704 | 3.21 | 0 |
| Pete Buttigieg (withdrawn) | 15,113 | 1.69 | 0 |
| Amy Klobuchar (withdrawn) | 11,899 | 1.33 | 0 |
| Tulsi Gabbard (withdrawn) | 4,560 | 0.51 | 0 |
| Tom Steyer (withdrawn) | 2,801 | 0.31 | 0 |
| Michael Bennet (withdrawn) | 2,030 | 0.23 | 0 |
| Deval Patrick (withdrawn) | 822 | 0.09 | 0 |
| Andrew Yang (withdrawn) (write-in) |
502 | 0.06 | 0 |
| Total | 894,383 | 100% | 136 |
General election
Predictions
| Source | Ranking | As of |
|---|---|---|
| The Cook Political Report[13] | Tossup | September 29, 2020 |
| Inside Elections[14] | Tossup | October 16, 2020 |
| Sabato's Crystal Ball[15] | Lean R | November 2, 2020 |
| Politico[16] | Tossup | October 11, 2020 |
| RCP[17] | Tossup | September 14, 2020 |
| Niskanen[18] | Tossup | September 15, 2020 |
| CNN[19] | Tossup | August 3, 2020 |
| The Economist[20] | Tossup | September 29, 2020 |
| CBS News[21] | Tossup | August 16, 2020 |
| 270towin[22] | Tossup | September 25, 2020 |
| ABC News[23] | Tossup | October 2, 2020 |
| NPR[24] | Tossup | August 3, 2020 |
| NBC News[25] | Tossup | August 6, 2020 |
| 538[26] | Tossup | September 24, 2020 |
Polling
Graphical summary
Aggregate polls
| Source of poll aggregation |
Dates administered |
Dates updated |
Joe Biden Democratic |
Donald Trump Republican |
Other/ Undecided [lower-alpha 1] |
Margin |
|---|---|---|---|---|---|---|
| 270 to Win | October 22 – November 1, 2020 | November 2, 2020 | 47.0% | 48.4% | 4.6% | Trump +1.4 |
| Real Clear Politics | October 17–31, 2020 | November 1, 2020 | 46.8% | 47.0% | 6.2% | Trump +0.2 |
| FiveThirtyEight | until November 1, 2020 | November 2, 2020 | 47.1% | 47.5% | 5.4% | Trump +0.4 |
| Average | 47.0% | 47.6% | 5.4% | Trump +0.6 | ||
June 1, 2020 – October 31, 2020
| Poll source | Date(s) administered |
Sample size[lower-alpha 2] |
Margin of error |
Donald Trump Republican |
Joe Biden Democratic |
Jo Jorgensen Libertarian |
Howie Hawkins Green |
Other | Undecided |
|---|---|---|---|---|---|---|---|---|---|
| SurveyMonkey/Axios | Oct 20 – Nov 2 | 6,025 (LV) | ± 2% | 51%[lower-alpha 3] | 47% | – | – | – | – |
| Pulse Opinion Research/Rasmussen Reports | Oct 31 – Nov 1 | 800 (LV) | ± 3.5% | 49% | 45% | – | – | 3%[lower-alpha 4] | – |
| Research Co. | Oct 31 – Nov 1 | 450 (LV) | ± 4.6% | 47% | 47% | – | – | 2%[lower-alpha 5] | 4% |
| Swayable | Oct 27 – Nov 1 | 516 (LV) | ± 5.8% | 52% | 47% | 1% | 0% | – | – |
| Civiqs/Daily Kos | Oct 29 – Nov 1 | 1,136 (LV) | ± 3% | 49% | 48% | – | – | 1%[lower-alpha 6] | 1% |
| Quinnipiac University | Oct 28 – Nov 1 | 1,440 (LV) | ± 2.6% | 43% | 47% | – | – | 2%[lower-alpha 7] | 8% |
| Survey Monkey/Tableau | Oct 20 – Nov 1 | 5,305 (LV) | ± 2.0% | 50% | 47% | – | – | – | |
| Trafalgar Group | Oct 30–31 | 1,041 (LV) | ± 2.96% | 49% | 44% | – | – | – | – |
| Emerson College | Oct 29–31 | 656 (LV) | ± 3.8% | 49%[lower-alpha 8] | 50% | – | – | 2%[lower-alpha 9] | – |
| Morning Consult | Oct 22–31 | 2,179 (LV) | ± 2% | 49% | 47% | – | – | – | – |
| AtlasIntel | Oct 29–30 | 660 (LV) | ± 4% | 50% | 47% | – | – | 3% | – |
| Gravis Marketing | Oct 27–28 | 613 (LV) | ± 4% | 49% | 47% | – | – | – | 4% |
| SurveyMonkey/Axios | Oct 1–28, 2020 | 8,089 (LV) | – | 51% | 47% | – | – | – | – |
| Quinnipiac University | Oct 23–27 | 1,186 (LV) | ± 2.9% | 43% | 48% | – | – | 1%[lower-alpha 10] | 8% |
| Swayable | Oct 23–26 | 440 (LV) | ± 6.3% | 55% | 44% | 1% | 0% | – | – |
| Wick Surveys | Oct 24–25 | 1,000 (LV) | ± 3.1% | 49% | 47% | – | – | – | – |
| Citizen Data | Oct 17–20 | 1,000 (LV) | ± 3% | 44% | 43% | 2% | 1% | 2% | 8% |
| Fox News | Oct 17–20 | 1,018 (LV) | ± 3% | 48% | 45% | 3% | 1% | 1%[lower-alpha 11] | 3% |
| Morning Consult | Oct 11–20 | 2,271 (LV) | ± 2.1% | 49% | 47% | – | – | – | – |
| Pulse Opinion Research/Rasmussen Reports | Oct 18–19 | 800 (LV) | ± 3.5% | 47% | 48% | – | – | 2%[lower-alpha 12] | 4% |
| Quinnipiac University | Oct 8–12 | 1,160 (LV) | ± 2.9% | 47% | 48% | – | – | 2%[lower-alpha 13] | 4% |
| Civiqs/Rust Belt Rising[upper-alpha 1] | Oct 8–11 | 586 (LV) | ± 4.2% | 50% | 47% | – | – | 2%[lower-alpha 14] | 1% |
| Morning Consult | Oct 2–11 | 2,283 (LV) | ± 2.1% | 49% | 46% | – | – | – | – |
| Baldwin Wallace University | Sep 30 – Oct 8 | 1,009 (LV) | ± 3.1% | 47% | 45% | 1% | 0% | 1%[lower-alpha 15] | 5% |
| Siena College/NYT Upshot | Oct 2–6 | 661 (LV) | ± 4.3% | 44% | 45% | 2% | 1% | 0%[lower-alpha 16] | 7%[lower-alpha 17] |
| Trafalgar Group | Oct 1–3 | 1,035 (LV) | ± 2.97% | 48% | 44% | 3% | 1% | 1%[lower-alpha 18] | 4% |
| YouGov/CBS | Sep 30 – Oct 2 | 1,114 (LV) | ± 3.7% | 47% | 47% | – | – | 1%[lower-alpha 19] | 5% |
| OnMessage Inc./American Action Forum[upper-alpha 2] | Sep 28 – Oct 1 | 800 (LV) | ± 3.46% | 48% | 47% | 2% | 1% | 0%[lower-alpha 20] | 3% |
| SurveyMonkey/Axios | Sep 1–30 | 4,012 (LV) | – | 51% | 47% | – | – | – | 2% |
| Hart Research Associates/Human Rights Campaign[upper-alpha 3] | Sep 24–27 | 400 (LV) | ± 4.9% | 49% | 47% | – | – | – | – |
| Fox News | Sep 20–23 | 830 (LV) | ± 3% | 45% | 50% | 1% | 1% | 0%[lower-alpha 21] | 2% |
| 907 (RV) | ± 3% | 44% | 49% | 1% | 2% | 2%[lower-alpha 22] | 3% | ||
| Quinnipiac University | Sep 17–21 | 1,078 (LV) | ± 3% | 47% | 48% | – | – | 2% | 4% |
| Baldwin Wallace University | Sep 9–22 | 1,011 (LV) | ± 3.3% | 44% | 45% | 2% | 0% | 1%[lower-alpha 23] | 7% |
| Civiqs/Rust Belt Rising[upper-alpha 1] | Sep 11–15 | 556 (RV) | ± 4.3% | 48%[lower-alpha 24] | 45% | – | – | 5%[lower-alpha 25] | 1% |
| Morning Consult | Aug 29 – Sep 7 | 1,963 (LV) | ± (2%–4%) | 50%[lower-alpha 26] | 45% | – | – | – | – |
| OnMessage Inc./American Action Forum[upper-alpha 2] | Aug 31 – Sep 3 | 800 (LV) | ± 3.46% | 51% | 45% | – | – | 2%[lower-alpha 27] | 3% |
| Pulse Opinion Research/Rasmussen Reports | Sep 1–2 | 1,000 (LV) | ± 3% | 47%[lower-alpha 28] | 51% | – | – | 3%[lower-alpha 29] | – |
| ALG Research/Progressive Policy Institute[upper-alpha 4] | Aug 26 – Sep 1 | 500 (LV) | – | 46% | 48% | – | – | – | – |
| SurveyMonkey/Axios | Aug 1–31 | 3,220 (LV) | – | 51% | 48% | – | – | – | 2% |
| Morning Consult | Aug 21–30 | 1,811 (LV) | ± (2%–4%) | 50% | 45% | – | – | – | – |
| Civiqs/Rust Belt Rising[upper-alpha 1] | Aug 13–17 | 631 (RV) | – | 47% | 47% | – | – | 4%[lower-alpha 30] | 2% |
| Morning Consult | Aug 7–16 | 1,744 (LV) | ± (2%–4%) | 49% | 45% | – | – | – | – |
| TargetSmart/Progress Ohio[upper-alpha 5] | Jul 28 – Aug 3 | 1,249 (LV) | ± 3.6% | 46% | 47% | – | – | 8%[lower-alpha 31] | – |
| SurveyMonkey/Axios | Jul 1–31 | 3,694 (LV) | – | 52% | 46% | – | – | – | 2% |
| Morning Consult | Jul 17–26 | 1,741 (LV) | ± 2.3% | 48% | 45% | – | – | – | – |
| YouGov/CBS | Jul 21–24 | 1,211 (LV) | ± 3.6% | 46% | 45% | – | – | 2%[lower-alpha 32] | 7% |
| Zogby Analytics | Jul 21–23 | 805 (RV) | ± 3.5% | 41% | 43% | 4% | 1% | – | 11% |
| Pulse Opinion Research/Rasmussen Reports/AGPAC[upper-alpha 6] | Jul 15–16 | 750 (LV) | ± 4% | 46% | 50% | – | – | 2%[lower-alpha 33] | 2% |
| University of Akron | Jun 24 – Jul 15 | 1,037 (RV) | ± 3.0% | 42% | 46% | – | – | 6%[lower-alpha 34] | 6% |
| SurveyMonkey/Axios | Jun 8–30 | 1,610 (LV) | – | 50% | 49% | – | – | – | 1% |
| Quinnipiac | Jun 18–22 | 1,139 (RV) | ± 2.9% | 45% | 46% | – | – | 4%[lower-alpha 35] | 5% |
| Fox News | May 30 – Jun 2 | 803 (RV) | ± 3.5% | 43% | 45% | – | – | 6%[lower-alpha 36] | 6% |
January 1, 2020 – May 31, 2020
| Poll source | Date(s) administered |
Sample size[lower-alpha 2] |
Margin of error |
Donald Trump (R) |
Joe Biden (D) |
Other | Undecided | |
|---|---|---|---|---|---|---|---|---|
| Morning Consult | May 17–26 | 1,720 (LV) | – | 50% | 42% | – | – | |
| Emerson College | May 8–10 | 725 (RV) | ± 3.5% | 51%[lower-alpha 37] | 49% | – | – | |
| Baldwin Wallace University/Oakland University/Ohio Northern University | Apr 20–25 | 797 (RV) | ± 3.7% | 44% | 45% | – | 11% | |
| Baldwin Wallace University Great Lakes | Mar 17–25 | 1,025 (RV) | ± 3.3% | 47% | 43% | – | 10% | |
| Change Research | Mar 21–23 | 510 (LV) | – | 52% | 44% | – | 5% | |
| NBC News/Wall Street Journal/Marist College | Mar 10–13 | 1,710 (RV) | ± 2.9% | 45% | 49% | 1% | 5% | |
January 1, 2018 – December 31, 2019
| Poll source | Date(s) administered |
Sample size[lower-alpha 2] |
Margin of error |
Donald Trump (R) |
Joe Biden (D) |
Other | Undecided |
|---|---|---|---|---|---|---|---|
| Public Policy Polling | Oct 10–11, 2019 | 776 (V) | ± 3.5% | 46% | 48% | – | 6% |
| Climate Nexus[lower-alpha 38] | Oct 1–7, 2019 | 1112 (LV) | ± 2.9% | 47% | 53% | – | – |
| 42% | 48% | – | 10% | ||||
| Emerson College | Sep 29 – Oct 2, 2019 | 837 (RV) | ± 3.2% | 47% | 53% | – | – |
| Quinnipiac University | Jul 17–22, 2019 | 1,431 (RV) | ± 3.2% | 42% | 50% | – | – |
| Public Policy Polling | Nov 27–28, 2018 | 648 (V) | ± 3.9% | 44% | 48% | – | 8% |
Former candidates | ||||||||||||||||||||||||||||||||||||||||||||||||||||||||||||||||||||||||||||||||||||||||||||||||||||||||||||||||||||||||||||||||||||||||||||||||||||||||||||||||||||||||||||||||||||||||||||||||||||||||||||||||
|---|---|---|---|---|---|---|---|---|---|---|---|---|---|---|---|---|---|---|---|---|---|---|---|---|---|---|---|---|---|---|---|---|---|---|---|---|---|---|---|---|---|---|---|---|---|---|---|---|---|---|---|---|---|---|---|---|---|---|---|---|---|---|---|---|---|---|---|---|---|---|---|---|---|---|---|---|---|---|---|---|---|---|---|---|---|---|---|---|---|---|---|---|---|---|---|---|---|---|---|---|---|---|---|---|---|---|---|---|---|---|---|---|---|---|---|---|---|---|---|---|---|---|---|---|---|---|---|---|---|---|---|---|---|---|---|---|---|---|---|---|---|---|---|---|---|---|---|---|---|---|---|---|---|---|---|---|---|---|---|---|---|---|---|---|---|---|---|---|---|---|---|---|---|---|---|---|---|---|---|---|---|---|---|---|---|---|---|---|---|---|---|---|---|---|---|---|---|---|---|---|---|---|---|---|---|---|---|---|
|
Donald Trump vs. Cory Booker
Donald Trump vs. Pete Buttigieg
Donald Trump vs. Kamala Harris
Donald Trump vs. Bernie Sanders
Donald Trump vs. Elizabeth Warren
|
Hypothetical polling | ||||||||||||||||||||||||||||||||||||||||||||||||||||||||||||||||||||||||||||||||||||||||||||||||||||||||||||||||||||||||||||||||||
|---|---|---|---|---|---|---|---|---|---|---|---|---|---|---|---|---|---|---|---|---|---|---|---|---|---|---|---|---|---|---|---|---|---|---|---|---|---|---|---|---|---|---|---|---|---|---|---|---|---|---|---|---|---|---|---|---|---|---|---|---|---|---|---|---|---|---|---|---|---|---|---|---|---|---|---|---|---|---|---|---|---|---|---|---|---|---|---|---|---|---|---|---|---|---|---|---|---|---|---|---|---|---|---|---|---|---|---|---|---|---|---|---|---|---|---|---|---|---|---|---|---|---|---|---|---|---|---|---|---|---|
|
with Donald Trump and Sherrod Brown
with Mike Pence and Joe Biden
with Mike Pence and Bernie Sanders
with Mike Pence and Elizabeth Warren
with Donald Trump and Generic Democrat
with John Kasich and Generic Democrat
|
Results
Official state results from the Ohio Secretary of State are as follows:
| 2020 United States presidential election in Ohio | ||||||
|---|---|---|---|---|---|---|
| Party | Candidate | Running Mate | Votes | Percentage | Electoral votes | |
| Republican | Donald Trump | Mike Pence | 3,154,834 | 53.27% | 18 | |
| Democratic | Joe Biden | Kamala Harris | 2,679,165 | 45.24% | 0 | |
| Libertarian | Jo Jorgensen | Spike Cohen | 67,569 | 1.14% | 0 | |
| Green | Howie Hawkins | Angela Nicole Walker | 18,812 | 0.32% | 0 | |
| Write-ins | Write-ins | Write-ins | 1,822 | 0.03% | 0 | |
| Totals | 5,922,202 | 100.00% | 18 | |||
By county
| County[27] | Donald Trump Republican |
Joe Biden Democratic |
Jo Jorgensen Libertarian |
Howie Hawkins Green |
Various candidates Write-ins |
Margin | Total votes cast | ||||||
|---|---|---|---|---|---|---|---|---|---|---|---|---|---|
| # | % | # | % | # | % | # | % | # | % | # | % | ||
| Adams | 9,870 | 81.27% | 2,156 | 17.75% | 92 | 0.76% | 27 | 0.22% | 0 | 0.00% | 7,714 | 63.52% | 12,145 |
| Allen | 33,116 | 68.85% | 14,149 | 29.42% | 590 | 1.23% | 138 | 0.29% | 106 | 0.22% | 18,967 | 39.43% | 48,099 |
| Ashland | 19,407 | 73.50% | 6,541 | 24.77% | 345 | 1.31% | 105 | 0.40% | 7 | 0.03% | 12,866 | 48.73% | 26,405 |
| Ashtabula | 26,890 | 60.79% | 16,497 | 37.29% | 559 | 1.26% | 196 | 0.44% | 95 | 0.21% | 10,393 | 23.50% | 44,237 |
| Athens | 10,862 | 41.58% | 14,772 | 56.55% | 299 | 1.14% | 115 | 0.44% | 72 | 0.28% | −3,910 | −14.97% | 26,120 |
| Auglaize | 20,798 | 80.54% | 4,651 | 18.01% | 260 | 1.01% | 0 | 0.00% | 113 | 0.44% | 16,147 | 62.53% | 25,822 |
| Belmont | 23,560 | 71.09% | 9,138 | 27.57% | 285 | 0.86% | 98 | 0.30% | 60 | 0.18% | 14,422 | 43.52% | 33,141 |
| Brown | 16,480 | 77.96% | 4,380 | 20.72% | 182 | 0.86% | 54 | 0.26% | 43 | 0.20% | 12,100 | 57.24% | 21,139 |
| Butler | 114,392 | 61.26% | 69,613 | 37.28% | 2,177 | 1.17% | 493 | 0.26% | 62 | 0.03% | 44,779 | 23.98% | 186,737 |
| Carroll | 10,745 | 75.49% | 3,251 | 22.84% | 156 | 1.10% | 56 | 0.39% | 25 | 0.18% | 7,494 | 52.65% | 14,233 |
| Champaign | 14,589 | 72.93% | 5,062 | 25.31% | 260 | 1.30% | 55 | 0.27% | 37 | 0.18% | 9,527 | 47.62% | 20,003 |
| Clark | 39,032 | 60.65% | 24,076 | 37.41% | 829 | 1.29% | 245 | 0.38% | 169 | 0.26% | 14,956 | 23.24% | 64,351 |
| Clermont | 74,570 | 67.36% | 34,092 | 30.79% | 1,513 | 1.37% | 0 | 0.00% | 535 | 0.48% | 40,478 | 36.57% | 110,710 |
| Clinton | 15,488 | 75.32% | 4,697 | 22.84% | 270 | 1.31% | 67 | 0.33% | 41 | 0.20% | 10,791 | 52.48% | 20,563 |
| Columbiana | 35,726 | 71.51% | 13,359 | 26.74% | 607 | 1.21% | 162 | 0.32% | 106 | 0.21% | 22,367 | 44.77% | 49,960 |
| Coshocton | 12,325 | 73.50% | 4,125 | 24.60% | 227 | 1.35% | 62 | 0.37% | 29 | 0.17% | 8,200 | 48.90% | 16,768 |
| Crawford | 15,436 | 74.52% | 4,916 | 23.73% | 278 | 1.34% | 53 | 0.26% | 30 | 0.14% | 10,520 | 50.79% | 20,713 |
| Cuyahoga | 202,699 | 32.32% | 416,176 | 66.36% | 4,593 | 0.73% | 2,031 | 0.32% | 1,661 | 0.26% | −213,477 | −34.04% | 627,160 |
| Darke | 22,004 | 81.01% | 4,731 | 17.42% | 331 | 1.22% | 0 | 0.00% | 95 | 0.35% | 17,273 | 63.59% | 27,161 |
| Defiance | 13,038 | 67.27% | 5,981 | 30.86% | 272 | 1.40% | 78 | 0.40% | 12 | 0.06% | 7,057 | 36.41% | 19,381 |
| Delaware | 66,356 | 52.51% | 57,735 | 45.69% | 1,630 | 1.29% | 0 | 0.00% | 653 | 0.52% | 8,621 | 6.82% | 126,374 |
| Erie | 22,160 | 54.83% | 17,493 | 43.28% | 522 | 1.29% | 153 | 0.38% | 88 | 0.22% | 4,667 | 11.55% | 40,416 |
| Fairfield | 50,797 | 60.97% | 31,224 | 37.48% | 1,033 | 1.24% | 223 | 0.27% | 34 | 0.04% | 19,573 | 23.49% | 83,311 |
| Fayette | 9,473 | 75.03% | 2,975 | 23.56% | 132 | 1.05% | 32 | 0.25% | 14 | 0.11% | 6,498 | 51.47% | 12,626 |
| Franklin | 211,237 | 33.40% | 409,144 | 64.68% | 7,718 | 1.22% | 2,169 | 0.34% | 2,264 | 0.26% | −197,907 | −31.28% | 632,532 |
| Fulton | 15,731 | 68.98% | 6,664 | 29.22% | 299 | 1.31% | 71 | 0.31% | 41 | 0.18% | 9,067 | 39.76% | 22,806 |
| Gallia | 10,645 | 77.14% | 2,990 | 21.67% | 132 | 0.96% | 32 | 0.23% | 0 | 0.00% | 7,655 | 55.47% | 13,799 |
| Geauga | 34,143 | 60.95% | 21,201 | 37.84% | 534 | 0.95% | 0 | 0.00% | 143 | 0.26% | 12,942 | 23.11% | 56,021 |
| Greene | 52,072 | 58.74% | 34,798 | 39.26% | 1,458 | 1.64% | 264 | 0.30% | 51 | 0.06% | 17,274 | 19.48% | 88,643 |
| Guernsey | 13,407 | 73.41% | 4,577 | 25.06% | 177 | 0.97% | 67 | 0.37% | 36 | 0.20% | 8,830 | 48.35% | 18,264 |
| Hamilton | 177,886 | 41.28% | 246,266 | 57.15% | 5,211 | 1.21% | 1,389 | 0.32% | 177 | 0.04% | −68,380 | −15.87% | 430,929 |
| Hancock | 26,310 | 67.86% | 11,757 | 30.32% | 580 | 1.50% | 110 | 0.28% | 14 | 0.04% | 14,553 | 37.54% | 38,771 |
| Hardin | 9,949 | 75.10% | 3,062 | 23.11% | 192 | 1.45% | 44 | 0.33% | 0 | 0.00% | 6,887 | 51.99% | 13,247 |
| Harrison | 5,792 | 75.58% | 1,768 | 23.07% | 59 | 0.77% | 36 | 0.47% | 8 | 0.10% | 4,024 | 52.51% | 7,663 |
| Henry | 10,479 | 70.86% | 4,062 | 27.47% | 175 | 1.18% | 44 | 0.30% | 28 | 0.19% | 6,417 | 43.39% | 14,788 |
| Highland | 15,678 | 79.68% | 3,799 | 19.31% | 146 | 0.74% | 0 | 0.00% | 53 | 0.27% | 11,879 | 60.37% | 19,676 |
| Hocking | 9,737 | 70.28% | 3,880 | 28.00% | 162 | 1.17% | 40 | 0.29% | 36 | 0.26% | 5,857 | 42.28% | 13,855 |
| Holmes | 10,796 | 83.19% | 1,994 | 15.36% | 125 | 0.96% | 0 | 0.00% | 63 | 0.49% | 8,802 | 67.83% | 12,978 |
| Huron | 18,956 | 69.72% | 7,759 | 28.54% | 387 | 1.42% | 83 | 0.31% | 5 | 0.02% | 11,197 | 41.18% | 27,190 |
| Jackson | 11,309 | 76.36% | 3,311 | 22.36% | 144 | 0.97% | 0 | 0.00% | 46 | 0.31% | 7,998 | 54.00% | 14,810 |
| Jefferson | 22,828 | 68.30% | 10,018 | 29.98% | 357 | 1.07% | 100 | 0.30% | 118 | 0.35% | 12,810 | 38.32% | 33,421 |
| Knox | 22,340 | 71.01% | 8,589 | 27.30% | 374 | 1.19% | 86 | 0.27% | 70 | 0.22% | 13,751 | 43.71% | 31,459 |
| Lake | 73,278 | 56.03% | 55,514 | 42.45% | 1,284 | 0.98% | 408 | 0.31% | 298 | 0.23% | 17,764 | 13.58% | 130,782 |
| Lawrence | 20,306 | 72.06% | 7,489 | 26.58% | 259 | 0.92% | 0 | 0.00% | 125 | 0.44% | 12,817 | 45.48% | 28,179 |
| Licking | 59,514 | 63.05% | 33,055 | 35.02% | 1,279 | 1.35% | 312 | 0.33% | 236 | 0.25% | 26,459 | 28.03% | 94,396 |
| Logan | 17,964 | 76.74% | 5,055 | 21.59% | 272 | 1.16% | 69 | 0.29% | 49 | 0.21% | 12,909 | 55.15% | 23,409 |
| Lorain | 79,520 | 50.40% | 75,667 | 47.96% | 1,677 | 1.06% | 534 | 0.34% | 370 | 0.23% | 3,853 | 2.44% | 157,768 |
| Lucas | 81,763 | 40.66% | 115,411 | 57.39% | 2,605 | 1.30% | 780 | 0.39% | 548 | 0.27% | −33,648 | −16.73% | 201,107 |
| Madison | 13,835 | 69.57% | 5,698 | 28.65% | 269 | 1.35% | 0 | 0.00% | 85 | 0.43% | 8,137 | 40.92% | 19,887 |
| Mahoning | 59,903 | 50.26% | 57,641 | 48.36% | 966 | 0.81% | 436 | 0.37% | 244 | 0.20% | 2,262 | 1.90% | 119,190 |
| Marion | 19,023 | 68.25% | 8,269 | 29.67% | 414 | 1.49% | 112 | 0.40% | 53 | 0.19% | 10,754 | 38.58% | 27,871 |
| Medina | 64,598 | 60.92% | 39,800 | 37.53% | 1,144 | 1.08% | 266 | 0.25% | 233 | 0.22% | 24,798 | 23.39% | 106,041 |
| Meigs | 8,316 | 75.83% | 2,492 | 22.72% | 111 | 1.01% | 32 | 0.29% | 16 | 0.15% | 5,824 | 53.11% | 10,967 |
| Mercer | 19,452 | 81.79% | 4,030 | 16.94% | 204 | 0.86% | 67 | 0.28% | 31 | 0.13% | 15,422 | 64.85% | 23,784 |
| Miami | 41,371 | 71.23% | 15,663 | 26.97% | 782 | 1.35% | 0 | 0.00% | 261 | 0.45% | 25,708 | 44.26% | 58,077 |
| Monroe | 5,463 | 76.31% | 1,605 | 22.42% | 54 | 0.75% | 26 | 0.36% | 11 | 0.15% | 3,858 | 53.89% | 7,159 |
| Montgomery | 129,034 | 47.94% | 135,064 | 50.18% | 3,418 | 1.27% | 884 | 0.33% | 764 | 0.28% | -6,030 | -2.24% | 269,164 |
| Morgan | 5,041 | 73.53% | 1,725 | 25.16% | 64 | 0.93% | 0 | 0.00% | 26 | 0.38% | 3,316 | 48.37% | 6,856 |
| Morrow | 14,077 | 76.22% | 4,048 | 21.92% | 257 | 1.39% | 70 | 0.38% | 16 | 0.09% | 10,029 | 54.30% | 18,468 |
| Muskingum | 27,867 | 68.86% | 11,971 | 29.58% | 459 | 1.13% | 163 | 0.40% | 7 | 0.02% | 15,896 | 39.28% | 40,467 |
| Noble | 5,135 | 80.89% | 1,170 | 18.43% | 25 | 0.39% | 0 | 0.00% | 18 | 0.28% | 3,965 | 62.46% | 6,348 |
| Ottawa | 14,628 | 60.83% | 9,008 | 37.46% | 292 | 1.21% | 74 | 0.31% | 44 | 0.18% | 5,628 | 23.37% | 24,046 |
| Paulding | 7,086 | 74.72% | 2,213 | 23.33% | 124 | 1.31% | 38 | 0.40% | 23 | 0.24% | 4,873 | 51.39% | 9,484 |
| Perry | 12,357 | 74.10% | 4,098 | 24.57% | 170 | 1.02% | 47 | 0.28% | 4 | 0.02% | 8,259 | 49.53% | 16,676 |
| Pickaway | 20,593 | 72.73% | 7,304 | 25.80% | 295 | 1.04% | 0 | 0.00% | 122 | 0.43% | 13,289 | 46.93% | 28,314 |
| Pike | 9,157 | 73.70% | 3,110 | 25.03% | 123 | 0.99% | 0 | 0.00% | 34 | 0.27% | 6,047 | 48.67% | 12,424 |
| Portage | 45,990 | 55.39% | 35,661 | 42.95% | 906 | 1.09% | 295 | 0.36% | 170 | 0.20% | 10,329 | 12.44% | 83,022 |
| Preble | 17,022 | 77.94% | 4,493 | 20.57% | 243 | 1.11% | 0 | 0.00% | 82 | 0.38% | 12,529 | 57.37% | 21,840 |
| Putnam | 16,412 | 82.28% | 3,195 | 16.02% | 247 | 1.24% | 61 | 0.31% | 32 | 0.16% | 13,217 | 66.26% | 19,947 |
| Richland | 41,472 | 69.15% | 17,640 | 29.41% | 680 | 1.13% | 168 | 0.28% | 15 | 0.03% | 23,832 | 39.74% | 59,975 |
| Ross | 22,278 | 66.77% | 10,557 | 31.64% | 345 | 1.03% | 116 | 0.35% | 69 | 0.21% | 11,721 | 35.13% | 33,365 |
| Sandusky | 18,896 | 62.72% | 10,596 | 35.17% | 448 | 1.49% | 132 | 0.44% | 56 | 0.19% | 8,300 | 27.55% | 30,128 |
| Scioto | 22,609 | 70.54% | 9,080 | 28.33% | 262 | 0.82% | 91 | 0.28% | 9 | 0.03% | 13,529 | 42.21% | 32,051 |
| Seneca | 17,086 | 66.10% | 8,266 | 31.98% | 357 | 1.38% | 94 | 0.36% | 45 | 0.17% | 8,820 | 34.12% | 25,848 |
| Shelby | 20,422 | 80.74% | 4,465 | 17.65% | 290 | 1.15% | 71 | 0.28% | 45 | 0.18% | 15,957 | 63.09% | 25,293 |
| Stark | 111,097 | 58.44% | 75,904 | 39.93% | 2,163 | 1.14% | 683 | 0.36% | 246 | 0.13% | 35,193 | 18.51% | 190,093 |
| Summit | 124,833 | 44.38% | 151,668 | 53.92% | 3,003 | 1.07% | 888 | 0.32% | 888 | 0.26% | −26,835 | −9.54% | 281,280 |
| Trumbull | 55,194 | 54.57% | 44,519 | 44.01% | 913 | 0.90% | 356 | 0.35% | 170 | 0.17% | 10,675 | 10.56% | 101,152 |
| Tuscarawas | 30,458 | 69.09% | 12,889 | 29.24% | 494 | 1.12% | 161 | 0.37% | 85 | 0.19% | 17,569 | 39.85% | 44,087 |
| Union | 21,669 | 64.62% | 11,141 | 33.22% | 535 | 1.60% | 100 | 0.30% | 90 | 0.27% | 10,528 | 31.40% | 33,535 |
| Van Wert | 11,650 | 77.70% | 3,067 | 20.45% | 201 | 1.34% | 42 | 0.28% | 34 | 0.23% | 8,583 | 57.25% | 14,994 |
| Vinton | 4,632 | 76.71% | 1,331 | 22.04% | 47 | 0.78% | 17 | 0.28% | 11 | 0.18% | 3,301 | 54.67% | 6,038 |
| Warren | 87,988 | 64.49% | 46,069 | 33.76% | 1,747 | 1.28% | 0 | 0.00% | 637 | 0.47% | 41,919 | 30.73% | 136,441 |
| Washington | 22,307 | 69.53% | 9,243 | 28.81% | 372 | 1.16% | 109 | 0.34% | 50 | 0.16% | 13,064 | 40.72% | 32,081 |
| Wayne | 36,759 | 67.72% | 16,660 | 30.69% | 665 | 1.23% | 173 | 0.32% | 26 | 0.05% | 20,099 | 37.03% | 54,283 |
| Williams | 13,452 | 72.12% | 4,842 | 25.96% | 285 | 1.53% | 70 | 0.38% | 2 | 0.01% | 8,610 | 46.16% | 18,651 |
| Wood | 35,757 | 52.89% | 30,617 | 45.29% | 992 | 1.47% | 211 | 0.31% | 23 | 0.03% | 5,140 | 7.60% | 67,600 |
| Wyandot | 8,462 | 74.21% | 2,733 | 23.97% | 155 | 1.36% | 38 | 0.33% | 15 | 0.13% | 5,729 | 50.24% | 11,403 |
| Totals | 3,154,834 | 53.18% | 2,679,165 | 45.16% | 67,569 | 1.14% | 18,812 | 0.32% | 12,018 | 0.20% | 475,669 | 8.02% | 5,932,398 |
Counties that flipped from Democratic to Republican
- Lorain (largest municipality: Lorain)
- Mahoning (largest municipality: Youngstown)
Counties that flipped from Republican to Democratic
- Montgomery (largest municipality: Dayton)
Mahoning County
Mahoning County, anchored by the car-making town of Youngstown, voted Republican for the first time since Richard Nixon's landslide re-election in 1972. The slim victory by Trump marked a collapse in Democrats' support among working-class voters, and tightened the President's grip on blue-collar white voters.
David Betras, who was Democratic chairman of Mahoning County until 2019, speculated on the disconnect between Democrats in Washington who focused messaging Trump’s unfitness for office, his taxes and possible impeachment, and the concerns of blue-collar workers were supporting Trump for his trade war with China, regardless of economic pain caused by tariffs.[28]
By congressional district
Trump won 12 out of the 16 congressional districts in Ohio.
| District | Trump | Biden | Representative |
|---|---|---|---|
| 1st | 51% | 48% | Steve Chabot |
| 2nd | 56% | 43% | Brad Wenstrup |
| 3rd | 28% | 70% | Joyce Beatty |
| 4th | 67% | 31% | Jim Jordan |
| 5th | 61% | 37% | Bob Latta |
| 6th | 72% | 27% | Bill Johnson |
| 7th | 65% | 33% | Bob Gibbs |
| 8th | 66% | 33% | Warren Davidson |
| 9th | 40% | 59% | Marcy Kaptur |
| 10th | 51% | 47% | Mike Turner |
| 11th | 20% | 80% | Marcia Fudge |
| 12th | 52% | 46% | Troy Balderson |
| 13th | 48% | 51% | Tim Ryan |
| 14th | 54% | 45% | David Joyce |
| 15th | 56% | 42% | Steve Stivers |
| 16th | 57% | 42% | Anthony Gonzalez |
See also
Notes
- Calculated by taking the difference of 100% and all other candidates combined.
- Key:
A – all adults
RV – registered voters
LV – likely voters
V – unclear - Overlapping sample with the previous SurveyMonkey/Axios poll, but more information available regarding sample size
- "Some other candidate" with 3%
- "Someone else" with 2%
- "Someone else" with 1%
- "Someone else" with 2%
- With voters who lean towards a given candidate
- "Someone else" with 2%
- "Someone else" with 1%
- "Other" with 1%; would not vote with no voters
- "Some other candidate" with 2%
- "Someone else" with 2%
- "Someone else" with 2%
- "Another candidate" with 1%
- "Someone else" and would not vote with 0%
- Includes "Refused"
- "Someone else" with 1%
- "Someone else/third party" with 1%
- "Other" and would not vote with no voters
- "Other" with 0%; would not vote with no voters
- "Other" and would not vote with 1%
- "Another candidate" with 1%
- Additional data sourced from FiveThirtyEight
- "Someone else" with 5%
- Overlapping sample with the previous Morning Consult poll, but more information available regarding sample size
- "Other" and would not vote with 1%
- With voters who lean towards a given candidate
- "Some other candidate" with 3%
- "Someone else" with 4%
- "Other and Undecided" with 8%
- "Someone else/third party" with 2%; would not vote with 0%
- "Some other candidate" with 2%
- "Other candidates" with 6%
- "Someone else" with 3%; would not vote with 1%
- "Other" with 4%; would not vote with 2%
- Including voters who lean towards a given candidate
- The poll below displays the results for voters who are sure how they will vote. This one incorporates the preferences of those who lean towards one of two candidates.
- Figures for each candidate in this poll include undecided voters who were reported to lean towards that candidate at the time of polling.
- "It depends on who the Democrats nominate" with 1.4%; "unsure" with 0.7%
- Figures for each candidate in this poll include undecided voters who were reported to lean towards that candidate at the time of polling.
- Partisan clients
- Rust Belt Rising is affiliated with the Democratic Party
- The American Action Forum is a 501 organisation which usually supports Republican candidates
- The Human Rights Campaign endorsed Biden prior to this poll's sampling period
- The Progressive Policy Institute endorsed Biden prior to this poll's sampling period
- Progress Ohio exclusively supports Democratic candidates
- The Center for American Greatness is a pro-Trump organization
References
- Kelly, Ben (August 13, 2018). "US elections key dates: When are the 2018 midterms and the 2020 presidential campaign?". The Independent. Retrieved January 3, 2019.
- "Distribution of Electoral Votes". National Archives and Records Administration. Retrieved January 3, 2019.
- Grabar, Henry (November 13, 2018). "Democrats Proved They Can Win Again in Michigan, Wisconsin, and Pennsylvania. Why Not Ohio?". Slate Magazine. Retrieved January 18, 2021.
- "County winners, 1836-2016". Google Docs. Retrieved November 15, 2020.
- Merica, Dan (March 16, 2020). "Ohio governor recommends delaying Tuesday's primary until June amid coronavirus pandemic". CNN. Retrieved March 16, 2020.
- "Judge rejects lawsuit to delay Ohio's primary election". WBNS-TV. March 16, 2020. Retrieved March 16, 2020.
- "Ohio health chief to order polls closed ahead of primary amid coronavirus". fox8.com. March 16, 2020. Retrieved March 16, 2020.
- "Coronavirus: Ohio Supreme Court allows delay to primary election". The Columbus Dispatch. March 17, 2020.
- "Ohio to run all-mail primary through April 28". Politico. March 25, 2020.
- "Ohio Republican Delegation 2020". The Green Papers. Retrieved April 28, 2020.
- "2020 ELECTIONS RESULTS". Ohio Secretary of State. Retrieved June 16, 2020.
- "Delegate Tracker". interactives.ap.org. Associated Press. Retrieved April 30, 2020.
- "2020 POTUS Race ratings" (PDF). The Cook Political Report. Retrieved May 21, 2019.
- "POTUS Ratings | Inside Elections". insideelections.com. Retrieved May 21, 2019.
- "Larry J. Sabato's Crystal Ball » 2020 President". crystalball.centerforpolitics.org. Retrieved November 2, 2020.
- "2020 Election Forecast". Politico. November 19, 2019.
- "Battle for White House". RCP. April 19, 2019.
- 2020 Bitecofer Model Electoral College Predictions, Niskanen Center, March 24, 2020, retrieved: April 19, 2020
- David Chalian; Terence Burlij. "Road to 270: CNN's debut Electoral College map for 2020". CNN. Retrieved June 16, 2020.
- "Forecasting the US elections". The Economist. Retrieved July 7, 2020.
- "2020 Election Battleground Tracker". CBS News. July 12, 2020. Retrieved July 13, 2020.
- "2020 Presidential Election Interactive Map". 270 to Win.
- "ABC News Race Ratings". CBS News. July 24, 2020. Retrieved July 24, 2020.
- "2020 Electoral Map Ratings: Trump Slides, Biden Advantage Expands Over 270 Votes". NPR.org. Retrieved August 3, 2020.
- "Biden dominates the electoral map, but here's how the race could tighten". NBC News. Retrieved August 6, 2020.
- "2020 Election Forecast". FiveThirtyEight. Retrieved August 14, 2020.
- "2020 Official Elections Results".
- Gabriel, Trip (May 20, 2019). "There's No Boom in Youngstown, but Blue-Collar Workers Are Sticking With Trump (Published 2019)". The New York Times. ISSN 0362-4331. Retrieved November 28, 2020.
Further reading
- David Wasserman (October 6, 2020), "The 10 Bellwether Counties That Show How Trump Is in Serious Trouble", Nytimes.com. (Describes bellwether Wood County, Ohio)
- "Ohio, bellwether again: A close race in Ohio is bad news for Donald Trump", Economist.com, October 10, 2020
- David Weigel; Lauren Tierney (October 11, 2020), "The seven political states of Ohio", Washingtonpost.com, archived from the original on October 12, 2020
External links
- Elections & Voting at the Ohio Secretary of State official website
- Ohio at Ballotpedia
- Government Documents Round Table of the American Library Association, "Ohio", Voting & Elections Toolkits
- "Ohio: Election Tools, Deadlines, Dates, Rules, and Links", Vote.org, Oakland, CA
- "League of Women Voters of Ohio". (State affiliate of the U.S. League of Women Voters)