COVID-19 pandemic death rates by country
This page contains the case fatality rate, as well as death rates per 100,000 population by country from the pandemic of coronavirus disease 2019 (COVID-19) as reported by Johns Hopkins Coronavirus Resource Center.[1]
| Part of a series on the |
| COVID-19 pandemic |
|---|
 |
|
|
|
As of 30 November 2020, Yemen has the highest case fatality rate at 28.3%, while Singapore has the lowest at 0.05%.[1] Note that case fatality rates reported below may not reflect the underlying fatality rate due to wide regional and temporal differences in policies around testing and reporting of deaths.
This table is for entire populations, and does not reflect the differences in mortality rates relative to different age groups. For example, in the United States the case fatality rate is 0.003%, 0.02%; 0.5% and 5.4% for the age groups 0–19, 20–49, 50–69, and 70 or over, respectively.[2][3]
Table of death rates
| Country | Confirmed cases | Deaths | Case fatality rate | Deaths per 100,000 population |
|---|---|---|---|---|
| 3,111 | 68 | 2.2% | 201.27 | |
| 718,847 | 21,260 | 3.0% | 186.13 | |
| 171,340 | 3,580 | 2.1% | 173.17 | |
| 3,903,706 | 110,462 | 2.8% | 166.14 | |
| 1,013,352 | 16,826 | 1.7% | 158.35 | |
| 2,597,446 | 90,241 | 3.5% | 149.33 | |
| 122,828 | 4,745 | 3.9% | 142.75 | |
| 26,676,957 | 455,738 | 1.7% | 139.30 | |
| 93,882 | 2,900 | 3.1% | 139.23 | |
| 2,513 | 52 | 2.1% | 137.17 | |
| 10,137 | 103 | 1.0% | 133.76 | |
| 63,633 | 826 | 1.3% | 132.72 | |
| 222,149 | 9,272 | 4.2% | 132.00 | |
| 371,988 | 12,832 | 3.4% | 131.36 | |
| 748,858 | 13,482 | 1.8% | 131.13 | |
| 2,913,425 | 60,802 | 2.1% | 130.13 | |
| 1,158,337 | 41,538 | 3.6% | 129.85 | |
| 324,489 | 5,391 | 1.7% | 129.07 | |
| 1,886,245 | 161,240 | 8.5% | 127.77 | |
| 234,153 | 5,106 | 2.2% | 124.86 | |
| 584,674 | 12,028 | 2.1% | 118.12 | |
| 3,310,071 | 77,741 | 2.3% | 116.05 | |
| 530,289 | 9,556 | 1.8% | 112.21 | |
| 2,135,412 | 55,131 | 2.6% | 111.04 | |
| 1,961,635 | 48,700 | 2.5% | 109.45 | |
| 9,396,293 | 228,795 | 2.4% | 109.23 | |
| 167,568 | 3,107 | 1.9% | 105.26 | |
| 184,948 | 2,885 | 1.6% | 103.42 | |
| 1,533,511 | 38,344 | 2.5% | 100.96 | |
| 740,237 | 18,731 | 2.5% | 100.01 | |
| 162,624 | 3,497 | 2.2% | 98.62 | |
| 51,330 | 588 | 1.1% | 96.75 | |
| 738,152 | 18,675 | 2.5% | 95.90 | |
| 224,234 | 10,633 | 4.7% | 93.66 | |
| 256,903 | 4,976 | 1.9% | 91.35 | |
| 419,801 | 7,936 | 1.9% | 89.70 | |
| 253,339 | 14,968 | 5.9% | 87.61 | |
| 260,480 | 3,240 | 1.2% | 86.84 | |
| 1,007,268 | 14,346 | 1.4% | 83.26 | |
| 61,404 | 1,514 | 2.5% | 82.05 | |
| 12,008 | 306 | 2.5% | 79.88 | |
| 1,466,767 | 45,605 | 3.1% | 78.93 | |
| 200,744 | 3,586 | 1.8% | 73.88 | |
| 2,265,536 | 60,634 | 2.7% | 73.12 | |
| 1,445,326 | 58,256 | 4.0% | 71.22 | |
| 69,400 | 1,281 | 1.8% | 66.49 | |
| 213,949 | 7,048 | 3.3% | 60.94 | |
| 402,700 | 4,085 | 1.0% | 58.51 | |
| 18,385 | 273 | 1.5% | 56.46 | |
| 675,618 | 5,001 | 0.7% | 56.29 | |
| 798,394 | 20,486 | 2.6% | 55.28 | |
| 160,935 | 5,903 | 3.7% | 55.03 | |
| 1,275,334 | 24,429 | 1.9% | 54.75 | |
| 195,992 | 2,662 | 1.4% | 53.25 | |
| 16,045 | 591 | 3.7% | 52.02 | |
| 3,874,830 | 74,005 | 1.9% | 51.22 | |
| 312,269 | 3,397 | 1.1% | 49.60 | |
| 81,993 | 1,418 | 1.7% | 49.47 | |
| 1,596 | 18 | 1.1% | 46.53 | |
| 8,247 | 176 | 2.1% | 45.64 | |
| 331,768 | 4,354 | 1.3% | 43.73 | |
| 161,087 | 1,865 | 1.2% | 40.82 | |
| 136,023 | 2,779 | 2.0% | 39.95 | |
| 152,225 | 3,669 | 2.4% | 38.27 | |
| 201,020 | 2,185 | 1.1% | 37.69 | |
| 624,222 | 13,091 | 2.1% | 34.06 | |
| 161,665 | 5,785 | 3.6% | 33.54 | |
| 46,334 | 443 | 1.0% | 33.54 | |
| 2,508,988 | 26,467 | 1.1% | 32.15 | |
| 135,041 | 1,532 | 1.1% | 31.72 | |
| 230,769 | 3,148 | 1.4% | 31.66 | |
| 122,013 | 1,919 | 1.6% | 28.73 | |
| 8,595 | 158 | 1.8% | 27.43 | |
| 218,948 | 2,747 | 1.3% | 25.85 | |
| 55,821 | 1,653 | 3.0% | 25.74 | |
| 14,290 | 135 | 0.9% | 24.83 | |
| 105,496 | 377 | 0.4% | 24.02 | |
| 168,250 | 962 | 0.6% | 23.25 | |
| 473,667 | 8,351 | 1.8% | 23.18 | |
| 7,780 | 177 | 2.3% | 22.72 | |
| 84,920 | 1,420 | 1.7% | 22.48 | |
| 369,248 | 6,389 | 1.7% | 18.96 | |
| 253,413 | 1,755 | 0.7% | 18.50 | |
| 31,379 | 208 | 0.7% | 17.49 | |
| 240,983 | 3,119 | 1.3% | 17.07 | |
| 34,519 | 364 | 1.1% | 14.87 | |
| 43,804 | 476 | 1.1% | 13.80 | |
| 23,222 | 678 | 2.9% | 12.93 | |
| 2,975 | 105 | 3.5% | 12.62 | |
| 46,493 | 688 | 1.5% | 12.47 | |
| 16,250 | 355 | 2.2% | 12.10 | |
| 1,123,105 | 31,001 | 2.8% | 11.58 | |
| 10,802,591 | 154,823 | 1.4% | 11.45 | |
| 64,212 | 582 | 0.9% | 10.95 | |
| 16,410 | 54 | 0.3% | 10.47 | |
| 531,699 | 10,997 | 2.1% | 10.31 | |
| 1,556 | 18 | 1.2% | 9.90 | |
| 7,607 | 135 | 1.8% | 9.71 | |
| 168,057 | 9,512 | 5.7% | 9.66 | |
| 16,740 | 425 | 2.5% | 9.65 | |
| 316,875 | 888 | 0.3% | 9.22 | |
| 152,898 | 249 | 0.2% | 8.95 | |
| 34,171 | 1,288 | 3.8% | 8.92 | |
| 8,969 | 178 | 2.0% | 8.44 | |
| 6,016 | 29 | 0.5% | 8.20 | |
| 1,298 | 17 | 1.3% | 8.06 | |
| 268 | 7 | 2.6% | 7.27 | |
| 271,602 | 2,033 | 0.7% | 7.24 | |
| 23,503 | 163 | 0.7% | 7.23 | |
| 108,381 | 2,904 | 2.7% | 6.88 | |
| 5,534 | 86 | 1.6% | 6.57 | |
| 5,936 | 63 | 1.1% | 6.57 | |
| 55,231 | 2,407 | 4.4% | 6.48 | |
| 141,104 | 3,163 | 2.2% | 5.89 | |
| 4,184 | 132 | 3.2% | 5.79 | |
| 551,842 | 11,886 | 2.2% | 5.60 | |
| 14,267 | 938 | 6.6% | 5.55 | |
| 1,641 | 15 | 0.9% | 5.23 | |
| 1,289 | 5 | 0.4% | 5.17 | |
| 537,030 | 8,175 | 1.5% | 5.07 | |
| 399,492 | 6,172 | 1.5% | 4.88 | |
| 59,003 | 812 | 1.4% | 4.68 | |
| 29,577 | 1,831 | 6.2% | 4.38 | |
| 25,884 | 779 | 3.0% | 4.29 | |
| 128,775 | 1,216 | 0.9% | 4.21 | |
| 27,733 | 659 | 2.4% | 4.16 | |
| 28,842 | 909 | 3.2% | 3.64 | |
| 101,339 | 1,773 | 1.7% | 3.45 | |
| 11,129 | 70 | 0.6% | 3.30 | |
| 80,131 | 1,459 | 1.8% | 2.83 | |
| 1,067 | 3 | 0.3% | 2.72 | |
| 6,299 | 170 | 2.7% | 2.63 | |
| 231,483 | 826 | 0.4% | 2.62 | |
| 2,662 | 46 | 1.7% | 2.45 | |
| 11,692 | 245 | 2.1% | 2.20 | |
| 2,122 | 615 | 29.0% | 2.16 | |
| 30,345 | 225 | 0.7% | 1.98 | |
| 140,157 | 2,126 | 1.5% | 1.95 | |
| 78,916 | 621 | 0.8% | 1.88 | |
| 30,313 | 474 | 1.6% | 1.88 | |
| 8,130 | 333 | 4.1% | 1.75 | |
| 1,945 | 84 | 4.3% | 1.74 | |
| 15,988 | 210 | 1.3% | 1.71 | |
| 67,115 | 339 | 0.5% | 1.56 | |
| 19,996 | 473 | 2.4% | 1.54 | |
| 69,255 | 440 | 0.6% | 1.48 | |
| 42,488 | 427 | 1.0% | 1.45 | |
| 4,989 | 63 | 1.3% | 1.35 | |
| 19,065 | 281 | 1.5% | 1.07 | |
| 3,728 | 79 | 2.1% | 1.03 | |
| 5,290 | 79 | 1.5% | 1.00 | |
| 13,308 | 90 | 0.7% | 0.99 | |
| 4,814 | 132 | 2.7% | 0.88 | |
| 136,030 | 1,632 | 1.2% | 0.83 | |
| 584 | 10 | 1.7% | 0.79 | |
| 3,433 | 121 | 3.5% | 0.78 | |
| 39,735 | 327 | 0.8% | 0.77 | |
| 4,575 | 164 | 3.6% | 0.73 | |
| 180 | 3 | 1.7% | 0.70 | |
| 14,629 | 84 | 0.6% | 0.68 | |
| 11,053 | 132 | 1.2% | 0.67 | |
| 29,102 | 158 | 0.5% | 0.63 | |
| 4,267 | 66 | 1.5% | 0.60 | |
| 59,624 | 29 | 0.0% | 0.51 | |
| 2,315 | 25 | 1.1% | 0.51 | |
| 4,119 | 54 | 1.3% | 0.47 | |
| 100,268 | 4,822 | 4.8% | 0.35 | |
| 8,060 | 122 | 1.5% | 0.15 | |
| 22,058 | 79 | 0.4% | 0.11 | |
| 867 | 9 | 1.0% | 0.10 | |
| 919 | 9 | 1.0% | 0.04 | |
| 509 | 21 | 4.1% | 0.04 | |
| 1,957 | 35 | 1.8% | 0.04 | |
| 2,309 | 7 | 0.3% | - |
Russia's death rate is now far higher than first thought: after a recent update, it is now over 186,000.[4]
NOTE: Actual cases will be far higher and we may never know the true number and because of this the actual fatality rate will be much lower. ALSO note some countries are not reporting data as honestly as others.
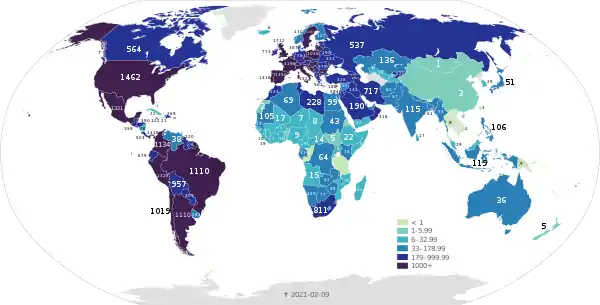
Map of death rates by country
Map of death rates per million citizens based on data published by national health agencies.
See also
- List of epidemics
- List of deaths due to COVID-19 – notable individual deaths
- COVID-19 pandemic deaths – statistics regarding absolute number of deaths
References
- "Mortality Analyses". Johns Hopkins University, Coronavirus Resource Center. For updating info go here.
- CDC (2020-02-11). "Coronavirus Disease 2019 (COVID-19)". Centers for Disease Control and Prevention. Retrieved 2020-10-10.
- "Misleading claim circulates online about infection fatality ratio of Covid-19 in the US". Fact Check. 2020-10-08. Retrieved 2020-10-10.
- https://www.theguardian.com/world/2020/dec/28/russia-admits-to-world-third-worst-covid-19-death-toll-underreported
External links
| Wikimedia Commons has media related to |