Webster County, Iowa
Webster County is a county in the U.S. state of Iowa. As of the 2010 census, the population was 38,013.[1] The county seat is Fort Dodge.[2] The county was established in January 1851, one of 43 counties established by a legislative package. This county was named after Daniel Webster, an American statesman noted for his moving oratory.
Webster County | |
|---|---|
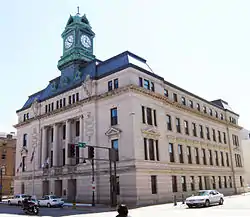 The courthouse in Fort Dodge is on the NRHP. | |
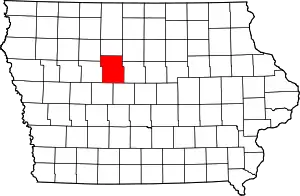 Location within the U.S. state of Iowa | |
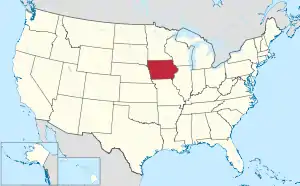 Iowa's location within the U.S. | |
| Coordinates: 42°25′34″N 94°11′19″W | |
| Country | |
| State | |
| Founded | January 15, 1851 |
| Named for | Daniel Webster |
| Seat | Fort Dodge |
| Largest city | Fort Dodge |
| Area | |
| • Total | 718 sq mi (1,860 km2) |
| • Land | 716 sq mi (1,850 km2) |
| • Water | 2.8 sq mi (7 km2) 0.4% |
| Population (2010) | |
| • Total | 38,013 |
| • Estimate (2018) | 36,277 |
| • Density | 53/sq mi (20/km2) |
| Time zone | UTC−6 (Central) |
| • Summer (DST) | UTC−5 (CDT) |
| Congressional district | 4th |
Webster County comprises the Fort Dodge, IA Micropolitan Statistical Area.
Geography
According to the U.S. Census Bureau, the county has an area of 718 square miles (1,860 km2), of which 716 square miles (1,850 km2) is land and 2.8 square miles (7.3 km2) (0.4%) is water.[3]
Major highways
 U.S. Route 20 – runs east–west across central Webster County, through Moorland and Coalville.
.svg.png.webp) U.S. Route 169 – enters northern Webster County at mid-county and runs south to Harcourt. It runs four miles east, then turns south to exit the county.
U.S. Route 169 – enters northern Webster County at mid-county and runs south to Harcourt. It runs four miles east, then turns south to exit the county. Iowa Highway 7 – enters western Webster County running east from Manson. It runs east to its terminus at US Highway 169 at Fort Dodge.
 Iowa Highway 175 – enters southeastern Webster County, running west from Stratford. It runs west and south–north to its connection to US Highway 169, four miles east of Harcourt.
 Iowa Highway 144 – enters southern Webster County near its midpoint. It runs north to its connection to Iowa Highway 175, three miles west of Harcourt.[4]
Airport
The Fort Dodge Regional Airport (FOD) is located just north of Fort Dodge. It is primarily a general aviation airport, with some commercial service provided by Air Choice One. Daily direct flights are operated to Lambert-St. Louis International Airport and Minneapolis-Saint Paul International Airport, with connecting service through Mason City to Chicago O'Hare International Airport.
Adjacent counties
- Boone County (southeast)
- Calhoun County (west)
- Greene County (southwest)
- Hamilton County (east)
- Humboldt County (north)
- Pocahontas County (northwest)
- Wright County (northeast)
Demographics
| Historical population | |||
|---|---|---|---|
| Census | Pop. | %± | |
| 1860 | 2,504 | — | |
| 1870 | 10,484 | 318.7% | |
| 1880 | 15,951 | 52.1% | |
| 1890 | 21,582 | 35.3% | |
| 1900 | 31,757 | 47.1% | |
| 1910 | 34,629 | 9.0% | |
| 1920 | 37,611 | 8.6% | |
| 1930 | 40,425 | 7.5% | |
| 1940 | 41,521 | 2.7% | |
| 1950 | 44,241 | 6.6% | |
| 1960 | 47,810 | 8.1% | |
| 1970 | 48,391 | 1.2% | |
| 1980 | 45,953 | −5.0% | |
| 1990 | 40,342 | −12.2% | |
| 2000 | 40,235 | −0.3% | |
| 2010 | 38,013 | −5.5% | |
| 2018 (est.) | 36,277 | [5] | −4.6% |
| U.S. Decennial Census[6] 1790-1960[7] 1900-1990[8] 1990-2000[9] 2010-2018[1] | |||
2010 census
The 2010 census recorded a population of 38,013 in the county, with a population density of 53.1479/sq mi (20.5205/km2). There were 17,035 housing units, of which 15,580 were occupied.[10]
2000 census
As of the census[11] of 2000, there were 40,235 people, 15,878 households, and 10,304 families in the county. The population density was 56 people per square mile (22/km2). There were 16,969 housing units at an average density of 24 per square mile (9/km2). The racial makeup of the county was 93.39% White, 3.39% Black or African American, 0.30% Native American, 0.66% Asian, 0.02% Pacific Islander, 1.10% from other races, and 1.15% from two or more races. 2.35% of the population were Hispanic or Latino of any race.
Of the 15,878 households 30.20% had children under the age of 18 living with them, 51.80% were married couples living together, 9.50% had a female householder with no husband present, and 35.10% were non-families. 30.30% of households were one person and 13.10% were one person aged 65 or older. The average household size was 2.38 and the average family size was 2.97.
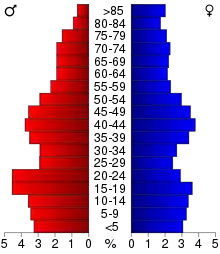
The age distribution was 24.50% under the age of 18, 11.10% from 18 to 24, 25.50% from 25 to 44, 21.60% from 45 to 64, and 17.40% 65 or older. The median age was 38 years. For every 100 females there were 100.30 males. For every 100 females age 18 and over, there were 98.20 males.
The median household income was $35,334 and the median family income was $43,772. Males had a median income of $31,047 versus $23,042 for females. The per capita income for the county was $17,857. About 6.70% of families and 10.00% of the population were below the poverty line, including 12.30% of those under age 18 and 7.00% of those age 65 or over.
Communities
Cities
Census-designated place
Population ranking
The population ranking of the following table is based on the 2010 census of Webster County.[15]
† county seat
| Rank | City/Town/etc. | Municipal type | Population (2010 Census) |
|---|---|---|---|
| 1 | † Fort Dodge | City | 25,206 |
| 2 | Gowrie | City | 1,037 |
| 3 | Dayton | City | 837 |
| 4 | Coalville | CDP | 610 |
| 5 | Badger | City | 561 |
| 6 | Otho | City | 542 |
| 7 | Lehigh | City | 416 |
| 8 | Duncombe | City | 410 |
| 9 | Callender | City | 376 |
| 10 | Harcourt | City | 303 |
| 11 | Barnum | City | 191 |
| 12 | Vincent | City | 174 |
| 13 | Moorland | City | 169 |
| 14 | Clare | City | 146 |
| 15 | Stratford (mostly in Hamilton County) | City | 30 (743 total) |
| 16 | Farnhamville (mostly in Calhoun County) | City | 0 (371 total) |
Notable people
- Robert Schliske, member of the Wyoming House of Representatives, 1971–1975, born in Webster County
Politics
In recent presidential elections, Webster County had a strong Democratic lean, voting for the party's candidate in every election from 1984 to 2012. In 2016 however, the county swung hard to vote for Republican Donald Trump by a wide margin, a nearly 27 point swing compared to 2012.[16]
| Year | Republican | Democratic | Third Parties |
|---|---|---|---|
| 2016 | 57.7% 10,056 | 36.2% 6,305 | 6.1% 1,069 |
| 2012 | 46.3% 8,469 | 52.1% 9,537 | 1.6% 286 |
| 2008 | 44.9% 8,337 | 53.4% 9,917 | 1.6% 302 |
| 2004 | 48.1% 8,959 | 51.3% 9,561 | 0.6% 111 |
| 2000 | 47.9% 8,172 | 49.7% 8,479 | 2.3% 397 |
| 1996 | 38.4% 6,275 | 51.3% 8,380 | 10.3% 1,673 |
| 1992 | 37.0% 6,992 | 45.3% 8,562 | 17.8% 3,367 |
| 1988 | 39.8% 6,926 | 59.0% 10,267 | 1.2% 200 |
| 1984 | 48.6% 9,619 | 50.2% 9,930 | 1.3% 253 |
| 1980 | 49.6% 10,438 | 42.8% 9,001 | 7.6% 1,591 |
| 1976 | 45.4% 9,068 | 52.7% 10,543 | 1.9% 384 |
| 1972 | 56.0% 11,133 | 42.0% 8,358 | 2.0% 402 |
| 1968 | 49.0% 9,349 | 44.9% 8,572 | 6.2% 1,176 |
| 1964 | 33.5% 6,576 | 66.2% 13,005 | 0.3% 54 |
| 1960 | 50.1% 10,741 | 49.8% 10,680 | 0.1% 14 |
| 1956 | 52.7% 11,097 | 47.0% 9,901 | 0.2% 51 |
| 1952 | 57.7% 12,336 | 40.6% 8,681 | 1.7% 368 |
| 1948 | 40.7% 6,951 | 55.7% 9,508 | 3.6% 607 |
| 1944 | 42.1% 6,935 | 57.6% 9,477 | 0.3% 56 |
| 1940 | 41.3% 7,583 | 58.4% 10,731 | 0.3% 52 |
| 1936 | 37.8% 6,494 | 57.6% 9,885 | 4.6% 795 |
| 1932 | 34.7% 5,243 | 59.3% 8,957 | 6.1% 917 |
| 1928 | 56.4% 8,525 | 43.0% 6,497 | 0.6% 97 |
| 1924 | 46.0% 6,641 | 14.4% 2,076 | 39.6% 5,721 |
| 1920 | 64.0% 8,312 | 21.6% 2,804 | 14.4% 1,872 |
| 1916 | 53.5% 3,917 | 43.7% 3,196 | 2.8% 208 |
| 1912 | 29.8% 2,123 | 33.3% 2,370 | 37.0% 2,634[lower-alpha 1] |
| 1908 | 56.5% 3,658 | 36.7% 2,374 | 6.8% 440 |
| 1904 | 66.9% 4,358 | 26.3% 1,714 | 6.8% 445 |
| 1900 | 63.3% 4,221 | 34.0% 2,266 | 2.7% 180 |
| 1896 | 58.1% 3,691 | 40.2% 2,557 | 1.7% 107 |
See also
Notes
- The leading "other" candidate, Progressive Theodore Roosevelt, received 2,171 votes, while Socialist candidate Eugene Debs received 316 votes, Prohibition candidate Eugene Chafin received 147 votes.
References
- "State & County QuickFacts". United States Census Bureau. Retrieved July 20, 2014.
- "Find a County". National Association of Counties. Retrieved June 7, 2011.
- "US Gazetteer files: 2010, 2000, and 1990". United States Census Bureau. February 12, 2011. Retrieved April 23, 2011.
- Webster County Google Maps (accessed 16 August 2018)
- "Population and Housing Unit Estimates". Retrieved June 20, 2019.
- "U.S. Decennial Census". United States Census Bureau. Retrieved July 20, 2014.
- "Historical Census Browser". University of Virginia Library. Retrieved July 20, 2014.
- "Population of Counties by Decennial Census: 1900 to 1990". United States Census Bureau. Retrieved July 20, 2014.
- "Census 2000 PHC-T-4. Ranking Tables for Counties: 1990 and 2000" (PDF). United States Census Bureau. Retrieved July 20, 2014.
- "Population & Housing Occupancy Status 2010". United States Census Bureau – American FactFinder. Retrieved June 18, 2011.
- "U.S. Census website". United States Census Bureau. Retrieved January 31, 2008.
- Bony, Jan. "Webster County IAGenWeb". Retrieved July 25, 2014.
- "Highway and Transportation Map, Webster County, Iowa" (PDF). IAGenWeb. Retrieved November 6, 2014.
- "SUMMARY REPORT, WEBSTER COUNTY, IOWA, UNOFFICIAL RESULTS, 2014 GENERAL ELECTION". Webster County Auditor's Office. Retrieved November 6, 2014.
- 2010 Census
- "Here's a map of the US counties that flipped to Trump from Democrats". www.cnbc.com. Retrieved January 28, 2019.
- Leip, David. "Dave Leip's Atlas of U.S. Presidential Elections". uselectionatlas.org. Retrieved April 28, 2018.
External links
| Wikimedia Commons has media related to Webster County, Iowa. |
Places adjacent to Webster County, Iowa | ||||||||||
|---|---|---|---|---|---|---|---|---|---|---|
| ||||||||||
Municipalities and communities of Webster County, Iowa, United States | ||
|---|---|---|
| Cities | Map of Iowa highlighting Webster County | |
| Townships | ||
| CDP | ||
| Communities | ||
| Footnotes | ‡This populated place also has portions in an adjacent county or counties | |
| ||

| Authority control |
|---|