Hancock County, Iowa
Hancock County is a county in the U.S. state of Iowa. As of the 2010 census, the population was 11,341.[1] The county seat is Garner.[2] The county was founded on January 15, 1851 and named in honor of John Hancock, a leader of the Continental Congress during the American Revolution.[3]
Hancock County | |
|---|---|
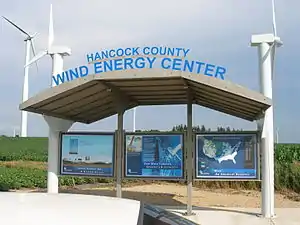 Visitor kiosk at the 148 wind turbine farm | |
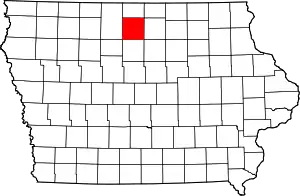 Location within the U.S. state of Iowa | |
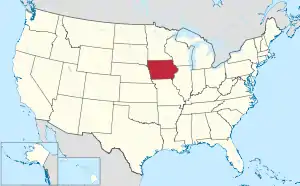 Iowa's location within the U.S. | |
| Coordinates: 43°05′00″N 93°44′11″W | |
| Country | |
| State | |
| Founded | 1851 |
| Named for | John Hancock |
| Seat | Garner |
| Largest city | Garner |
| Area | |
| • Total | 573 sq mi (1,480 km2) |
| • Land | 571 sq mi (1,480 km2) |
| • Water | 2.0 sq mi (5 km2) 0.4% |
| Population (2010) | |
| • Total | 11,341 |
| • Estimate (2018) | 10,712 |
| • Density | 20/sq mi (7.6/km2) |
| Time zone | UTC−6 (Central) |
| • Summer (DST) | UTC−5 (CDT) |
| Congressional district | 4th |
| Website | www |
Geography
According to the U.S. Census Bureau, the county has an area of 573 square miles (1,480 km2), of which 571 square miles (1,480 km2) is land and 2.0 square miles (5.2 km2) (0.4%) is water.[4]
Major highways
 U.S. Highway 18
 U.S. Highway 69
 Iowa Highway 17
Adjacent counties
- Winnebago County (north)
- Cerro Gordo County (east)
- Wright County (south)
- Kossuth County (west)
History
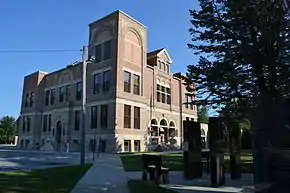
Hancock county was established as a result of an election on June 28, 1858.[5] At the time two townships, Avery and Madison, were also established. Soon after a courthouse was built in Garner, Iowa that continues to be the county seat.
Demographics
| Historical population | |||
|---|---|---|---|
| Census | Pop. | %± | |
| 1860 | 179 | — | |
| 1870 | 999 | 458.1% | |
| 1880 | 3,453 | 245.6% | |
| 1890 | 7,621 | 120.7% | |
| 1900 | 13,752 | 80.4% | |
| 1910 | 12,731 | −7.4% | |
| 1920 | 14,723 | 15.6% | |
| 1930 | 14,802 | 0.5% | |
| 1940 | 15,402 | 4.1% | |
| 1950 | 15,077 | −2.1% | |
| 1960 | 14,604 | −3.1% | |
| 1970 | 13,506 | −7.5% | |
| 1980 | 13,833 | 2.4% | |
| 1990 | 12,638 | −8.6% | |
| 2000 | 12,100 | −4.3% | |
| 2010 | 11,341 | −6.3% | |
| 2018 (est.) | 10,712 | [6] | −5.5% |
| U.S. Decennial Census[7] 1790-1960[8] 1900-1990[9] 1990-2000[10] 2010-2018[1] | |||
2010 census
The 2010 census recorded a population of 11,341 in the county, with a population density of 19.8578/sq mi (7.6671/km2). There were 5,330 housing units, of which 4,741 were occupied.[11]
2000 census

At the 2000 census there were 12,100 people, 4,795 households, and 3,375 families in the county. The population density was 21 people per square mile (8/km2). There were 5,164 housing units at an average density of 9 per square mile (3/km2). The racial makeup of the county was 97.70% White, 0.09% Black or African American, 0.10% Native American, 0.31% Asian, 0.02% Pacific Islander, 1.38% from other races, and 0.40% from two or more races. 2.49%.[12] were Hispanic or Latino of any race.
Of the 4,795 households 32.60% had children under the age of 18 living with them, 60.90% were married couples living together, 6.00% had a female householder with no husband present, and 29.60% were non-families. 26.50% of households were one person and 13.70% were one person aged 65 or older. The average household size was 2.48 and the average family size was 3.01.
The age distribution was 26.50% under the age of 18, 6.60% from 18 to 24, 25.50% from 25 to 44, 23.50% from 45 to 64, and 17.90% 65 or older. The median age was 40 years. For every 100 females there were 96.80 males. For every 100 females age 18 and over, there were 95.00 males.
The median household income was $37,703 and the median family income was $44,248. Males had a median income of $29,452 versus $20,376 for females. The per capita income for the county was $17,957. About 5.20% of families and 6.00% of the population were below the poverty line, including 6.90% of those under age 18 and 6.90% of those age 65 or over.
Economy
As of December 2008, the unemployment rate in Hancock County was 9.1%, a sharp rise from 4.0% in December 2007.[13] In 2016 the unemployment rate dropped back to 2.2%.[14]
Communities
Cities
Other unincorporated community
Townships
Hancock County is divided into sixteen townships:
Population ranking
The population ranking of the following table is based on the 2010 census of Hancock County.[15]
† county seat
| Rank | City/Town/etc. | Municipal type | Population (2010 Census) |
|---|---|---|---|
| 1 | Forest City (partially in Winnebago County) | City | 4,151 |
| 2 | † Garner | City | 3,129 |
| 3 | Britt | City | 2,069 |
| 4 | Kanawha | City | 652 |
| 5 | Klemme | City | 507 |
| 6 | Corwith | City | 309 |
| 7 | Crystal Lake | City | 250 |
| 8 | Woden | City | 229 |
| 9 | Goodell | City | 139 |
| 10 | Duncan | CDP | 131 |
| 11 | Miller | CDP | 60 |
| 12 | Hayfield | CDP | 43 |
| 13 | Hutchins | CDP | 28 |
Politics
| Year | Republican | Democratic | Third Parties |
|---|---|---|---|
| 2016 | 67.7% 3,977 | 27.0% 1,587 | 5.2% 307 |
| 2012 | 56.0% 3,317 | 42.6% 2,521 | 1.5% 87 |
| 2008 | 50.9% 3,016 | 47.3% 2,805 | 1.8% 109 |
| 2004 | 57.0% 3,368 | 42.1% 2,484 | 0.9% 53 |
| 2000 | 55.0% 2,988 | 42.0% 2,281 | 3.1% 169 |
| 1996 | 44.3% 2,353 | 45.2% 2,399 | 10.5% 557 |
| 1992 | 41.8% 2,428 | 37.5% 2,175 | 20.7% 1,203 |
| 1988 | 48.8% 2,731 | 50.6% 2,831 | 0.6% 31 |
| 1984 | 56.6% 3,362 | 42.8% 2,539 | 0.6% 37 |
| 1980 | 60.4% 3,681 | 31.5% 1,918 | 8.1% 493 |
| 1976 | 50.5% 3,127 | 48.1% 2,975 | 1.4% 85 |
| 1972 | 60.5% 3,706 | 38.3% 2,349 | 1.2% 74 |
| 1968 | 59.6% 3,544 | 35.8% 2,131 | 4.6% 274 |
| 1964 | 37.0% 2,269 | 62.9% 3,857 | 0.1% 7 |
| 1960 | 60.2% 4,179 | 39.7% 2,757 | 0.0% 1 |
| 1956 | 60.5% 4,305 | 39.4% 2,803 | 0.1% 6 |
| 1952 | 71.3% 5,115 | 28.6% 2,053 | 0.1% 10 |
| 1948 | 46.3% 2,802 | 51.2% 3,096 | 2.5% 153 |
| 1944 | 51.9% 3,114 | 47.6% 2,855 | 0.6% 34 |
| 1940 | 50.6% 3,632 | 49.0% 3,514 | 0.4% 27 |
| 1936 | 39.0% 2,585 | 59.3% 3,930 | 1.7% 114 |
| 1932 | 37.7% 2,355 | 61.1% 3,822 | 1.2% 77 |
| 1928 | 61.1% 3,114 | 37.9% 1,933 | 0.9% 48 |
| 1924 | 59.6% 3,183 | 10.3% 550 | 30.1% 1,606 |
| 1920 | 80.8% 3,617 | 16.2% 725 | 3.0% 132 |
| 1916 | 64.4% 1,726 | 34.1% 913 | 1.5% 40 |
| 1912 | 34.3% 860 | 28.3% 710 | 37.4% 937 |
| 1908 | 67.2% 1,750 | 30.9% 804 | 2.0% 52 |
| 1904 | 78.4% 2,112 | 19.2% 517 | 2.4% 65 |
| 1900 | 71.3% 2,186 | 27.0% 827 | 1.7% 52 |
| 1896 | 65.6% 1,975 | 33.5% 1,007 | 0.9% 27 |
See also
References
- "State & County QuickFacts". United States Census Bureau. Archived from the original on June 7, 2011. Retrieved July 17, 2014.
- "Find a County". National Association of Counties. Retrieved June 7, 2011.
- Gannett, Henry (1905). The Origin of Certain Place Names in the United States. Govt. Print. Off. pp. 148.
- "US Gazetteer files: 2010, 2000, and 1990". United States Census Bureau. February 12, 2011. Retrieved April 23, 2011.
- Story of Hancock County Court House, Hancock County Iowa. A project published by the Garner Lions Club, 1944. Authors included H. Ollenburg, E. Elling, J. Sprole, F. Zeiger, and C. Whitney.
- "Population and Housing Unit Estimates". Retrieved June 25, 2019.
- "U.S. Decennial Census". United States Census Bureau. Retrieved July 17, 2014.
- "Historical Census Browser". University of Virginia Library. Retrieved July 17, 2014.
- "Population of Counties by Decennial Census: 1900 to 1990". United States Census Bureau. Retrieved July 17, 2014.
- "Census 2000 PHC-T-4. Ranking Tables for Counties: 1990 and 2000" (PDF). United States Census Bureau. Retrieved July 17, 2014.
- "Population & Housing Occupancy Status 2010". United States Census Bureau American FactFinder. Retrieved May 12, 2011.
- "U.S. Census website". United States Census Bureau. Retrieved 2008-01-31.
- Geography of a Recession, The New York Times, March 3, 2009. Accessed March 5, 2009.
- "Iowa Workforce Development Statistics on unemployment in Iowa".
- https://www.census.gov/2010census/
- Leip, David. "Dave Leip's Atlas of U.S. Presidential Elections". uselectionatlas.org. Retrieved April 26, 2018.
External links
| Wikimedia Commons has media related to Hancock County, Iowa. |
- Hancock County, Iowa Official website
Places adjacent to Hancock County, Iowa | ||||||||||
|---|---|---|---|---|---|---|---|---|---|---|
| ||||||||||
Municipalities and communities of Hancock County, Iowa, United States | ||
|---|---|---|
| Cities | Map of Iowa highlighting Hancock County | |
| Townships | ||
| CDPs | ||
| Other unincorporated communities | ||
| Footnotes | ‡This populated place also has portions in an adjacent county or counties | |
| ||

| Authority control |
|---|