Tama County, Iowa
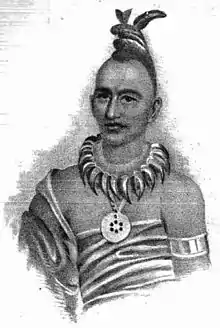
Tama County is a county located in the U.S. state of Iowa. As of the 2010 census, the population was 17,767.[1] Its county seat is Toledo.[2] The county was formed on February 17, 1843[3] and named for Taimah, a leader of the Meskwaki Indians.[4]
Tama County | |
|---|---|
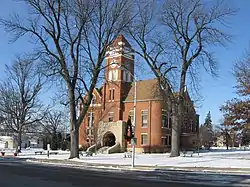 Tama County Courthouse in Toledo | |
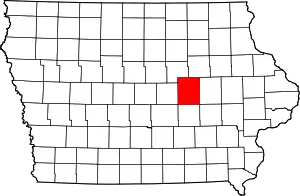 Location within the U.S. state of Iowa | |
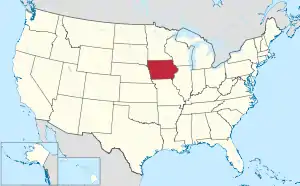 Iowa's location within the U.S. | |
| Coordinates: 42°04′43″N 92°31′53″W | |
| Country | |
| State | |
| Founded | 1843 |
| Named for | Taimah |
| Seat | Toledo |
| Largest city | Tama |
| Area | |
| • Total | 722 sq mi (1,870 km2) |
| • Land | 721 sq mi (1,870 km2) |
| • Water | 1.1 sq mi (3 km2) 0.1% |
| Population (2010) | |
| • Total | 17,767 |
| • Estimate (2018) | 16,904 |
| • Density | 25/sq mi (9.5/km2) |
| Time zone | UTC−6 (Central) |
| • Summer (DST) | UTC−5 (CDT) |
| Congressional district | 1st |
| Website | www |
Geography
According to the U.S. Census Bureau, the county has a total area of 722 square miles (1,870 km2), of which 721 square miles (1,870 km2) is land and 1.1 square miles (2.8 km2) (0.1%) is water.[5]
Major highways
Adjacent counties
- Grundy County (northwest)
- Black Hawk County (northeast)
- Benton County (east)
- Poweshiek County (south)
- Marshall County (west)
- Iowa County (southeast)
- Jasper County (southwest)
Demographics
| Historical population | |||
|---|---|---|---|
| Census | Pop. | %± | |
| 1850 | 8 | — | |
| 1860 | 5,285 | 65,962.5% | |
| 1870 | 16,131 | 205.2% | |
| 1880 | 21,585 | 33.8% | |
| 1890 | 22,052 | 2.2% | |
| 1900 | 24,585 | 11.5% | |
| 1910 | 22,156 | −9.9% | |
| 1920 | 21,861 | −1.3% | |
| 1930 | 21,987 | 0.6% | |
| 1940 | 22,428 | 2.0% | |
| 1950 | 21,688 | −3.3% | |
| 1960 | 21,413 | −1.3% | |
| 1970 | 20,147 | −5.9% | |
| 1980 | 19,533 | −3.0% | |
| 1990 | 17,419 | −10.8% | |
| 2000 | 18,103 | 3.9% | |
| 2010 | 17,767 | −1.9% | |
| 2018 (est.) | 16,904 | [6] | −4.9% |
| U.S. Decennial Census[7] 1790-1960[8] 1900-1990[9] 1990-2000[10] 2010-2018[1] | |||
2010 census
The 2010 census recorded a population of 17,767 in the county, with a population density of 24.5638/sq mi (9.4841/km2). There were 7,766 housing units, of which 6,947 were occupied.[11]
2000 census
As of the census [12] of 2000, there were 17,767 people, 7,018 households, and 4,968 families residing in the county. The population density was 25 people per square mile (10/km2). There were 7,583 housing units at an average density of 10 per square mile (4/km2). The racial makeup of the county was 90.38% White, 0.25% Black or African American, 6.09% Native American, 0.18% Asian, 0.02% Pacific Islander, 1.90% from other races, and 1.18% from two or more races. 3.75% of the population were Hispanic or Latino of any race.
There were 7,018 households, out of which 31.60% had children under the age of 18 living with them, 59.20% were married couples living together, 8.00% had a female householder with no husband present, and 29.20% were non-families. 25.30% of all households were made up of individuals, and 13.70% had someone living alone who was 65 years of age or older. The average household size was 2.51 and the average family size was 3.01.
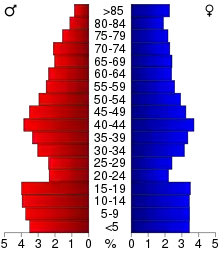
In the county, the population was spread out, with 26.60% under the age of 18, 7.00% from 18 to 24, 25.20% from 25 to 44, 22.50% from 45 to 64, and 18.70% who were 65 years of age or older. The median age was 39 years. For every 100 females there were 96.60 males. For every 100 females age 18 and over, there were 92.50 males.
The median income for a household in the county was $37,419, and the median income for a family was $43,646. Males had a median income of $30,723 versus $22,597 for females. The per capita income for the county was $17,097. About 7.60% of families and 10.50% of the population were below the poverty line, including 14.50% of those under age 18 and 9.40% of those age 65 or over.
Education
Tama County is served by four school districts, the largest of which is South Tama Community School District, at the 3A designation. Second largest is North Tama Community Schools. Lastly both GMG and Meskwaki Settlement School with an eight-man designation.[13][14][15][16]
Communities
Cities
Unincorporated communities
Townships
Tama County is divided into twenty-one townships:
Population ranking
The population ranking of the following table is based on the 2010 census of Tama County.[17]
† county seat
| Rank | City/Town/etc. | Municipal type | Population (2010 Census) |
|---|---|---|---|
| 1 | Tama | City | 2,877 |
| 2 | † Toledo | City | 2,341 |
| 3 | Traer | City | 1,703 |
| 4 | Dysart | City | 1,379 |
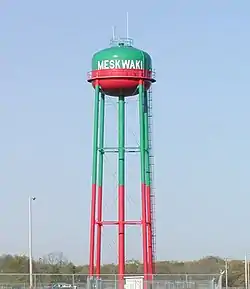
| 5 | Sac and Fox/Meskwaki Settlement | AIAN | 1,062 |
| 6 | Gladbrook | City | 945 |
| 7 | Le Grand (mostly in Marshall County) | City | 938 |
| 8 | Garwin | City | 527 |
| 9 | Chelsea | City | 267 |
| 10 | Montour | City | 249 |
| 11 | Clutier | City | 213 |
| 12 | Elberon | City | 196 |
| 13 | Lincoln | City | 162 |
| 14 | Vining | City | 50 |
Notable people
- George R. Struble (1836–1918). Iowa judge and politician from Toledo. Speaker of the Iowa House of Representatives, 1881–1883. Ardent prohibitionist. Brother of John T. Struble of Johnson County, and Congressman Isaac S. Struble of Plymouth County. Biography in the Journal of the House, memorial resolution of 3/23/1921.
- Michael Emerson, born in Cedar Rapids and raised in Toledo, Emerson has been on Broadway and appeared on Lost.[18]
- Clifford Berry (1918-1963), born in Gladbrook, was a graduate student at Iowa State when he and John Vincent Atanasoff created the Atanasoff–Berry Computer (ABC), the first digital electronic computer, in 1939.
Politics
| Year | Republican | Democratic | Third Parties |
|---|---|---|---|
| 2016 | 56.8% 4,971 | 36.5% 3,196 | 6.7% 585 |
| 2012 | 45.5% 4,098 | 52.9% 4,768 | 1.7% 151 |
| 2008 | 43.2% 3,820 | 55.3% 4,899 | 1.5% 133 |
| 2004 | 49.5% 4,456 | 49.9% 4,487 | 0.6% 58 |
| 2000 | 48.5% 4,034 | 48.7% 4,045 | 2.8% 236 |
| 1996 | 38.5% 2,986 | 51.5% 3,994 | 10.0% 772 |
| 1992 | 35.4% 2,948 | 42.9% 3,573 | 21.7% 1,809 |
| 1988 | 42.0% 3,362 | 57.2% 4,584 | 0.8% 66 |
| 1984 | 54.3% 4,882 | 45.2% 4,061 | 0.5% 47 |
| 1980 | 56.3% 4,840 | 35.5% 3,049 | 8.3% 713 |
| 1976 | 48.1% 4,379 | 50.3% 4,580 | 1.6% 148 |
| 1972 | 57.0% 5,058 | 41.6% 3,693 | 1.5% 129 |
| 1968 | 53.6% 4,955 | 40.7% 3,767 | 5.7% 531 |
| 1964 | 36.9% 3,543 | 63.0% 6,057 | 0.1% 8 |
| 1960 | 52.8% 5,535 | 47.2% 4,950 | 0.0% 1 |
| 1956 | 55.3% 5,952 | 44.5% 4,795 | 0.2% 26 |
| 1952 | 63.3% 7,061 | 36.5% 4,076 | 0.2% 17 |
| 1948 | 47.5% 4,763 | 51.0% 5,115 | 1.5% 150 |
| 1944 | 49.7% 5,249 | 50.0% 5,286 | 0.3% 32 |
| 1940 | 49.3% 5,865 | 50.4% 5,996 | 0.3% 32 |
| 1936 | 41.1% 4,737 | 57.5% 6,625 | 1.4% 160 |
| 1932 | 37.1% 4,051 | 61.4% 6,704 | 1.5% 165 |
| 1928 | 53.6% 5,589 | 46.0% 4,798 | 0.4% 45 |
| 1924 | 55.3% 5,177 | 23.3% 2,180 | 21.5% 2,010 |
| 1920 | 70.0% 6,352 | 28.1% 2,552 | 1.9% 169 |
| 1916 | 53.4% 3,061 | 44.9% 2,572 | 1.8% 102 |
| 1912 | 21.6% 1,179 | 44.8% 2,446 | 33.7% 1,840 |
| 1908 | 49.8% 2,774 | 45.8% 2,550 | 4.5% 248 |
| 1904 | 55.1% 3,127 | 41.6% 2,360 | 3.3% 186 |
| 1900 | 53.5% 3,290 | 44.5% 2,736 | 2.1% 129 |
| 1896 | 53.3% 3,054 | 45.3% 2,596 | 1.5% 83 |
References
- "State & County QuickFacts". United States Census Bureau. Retrieved July 20, 2014.
- "Find a County". National Association of Counties. Retrieved June 7, 2011.
- "City Community Description Congressional district Overview Population District type Geographical location/Climate Closest major city Political structure History Cultural institutions/events Distinguishing features Existing ties with Russia". ccfrussia.ru. Archived from the original on September 19, 2010. Retrieved April 11, 2018.
- Tama County
- "US Gazetteer files: 2010, 2000, and 1990". United States Census Bureau. February 12, 2011. Retrieved April 23, 2011.
- "Population and Housing Unit Estimates". Retrieved June 22, 2019.
- "U.S. Decennial Census". United States Census Bureau. Retrieved July 20, 2014.
- "Historical Census Browser". University of Virginia Library. Retrieved July 20, 2014.
- "Population of Counties by Decennial Census: 1900 to 1990". United States Census Bureau. Retrieved July 20, 2014.
- "Census 2000 PHC-T-4. Ranking Tables for Counties: 1990 and 2000" (PDF). United States Census Bureau. Retrieved July 20, 2014.
- "Population and Housing Occupancy Status: 2010 - State -- County". United States Census Bureau American FactFinder. Retrieved March 26, 2011.
- "U.S. Census website". United States Census Bureau. Retrieved January 31, 2008.
- South Tama County | Home of the Trojans! Web. March 26, 2011.<http://www.s-tama.k12.ia.us/>
- Meskwaki Settlement School. Web. March 26, 2011.<http://www.msswarriors.org/>
- Welcome to North Tama County Community Schools. Web. March 26, 2011.<http://www.n-tama.k12.ia.us/>
- New Page 1. Web. March 26, 2011.<http://www.garwin.k12.ia.us/>.
- "Archived copy". Retrieved February 10, 2013.
- "Michael Emerson". IMDb. Retrieved April 28, 2018.
- Leip, David. "Dave Leip's Atlas of U.S. Presidential Elections". uselectionatlas.org. Retrieved April 11, 2018.
External links
| Wikimedia Commons has media related to Tama County, Iowa. |
- IAGenWeb History, Biographies, Records and more
Places adjacent to Tama County, Iowa | ||||||||||
|---|---|---|---|---|---|---|---|---|---|---|
| ||||||||||
Municipalities and communities of Tama County, Iowa, United States | ||
|---|---|---|
| Cities | Map of Iowa highlighting Tama County | |
| Townships | ||
| Unincorporated communities | ||
| Indian reservation | ||
| Footnotes | ‡This populated place also has portions in an adjacent county or counties | |
| ||

| Authority control |
|---|