Guthrie County, Iowa
Guthrie County is a county located in the U.S. state of Iowa. As of the 2010 census, the population was 10,954.[1] The county seat is Guthrie Center.[2] The county was formed on January 15, 1851 and named after Captain Edwin B. Guthrie,[3] who had died in the Mexican–American War.
Guthrie County | |
|---|---|
 | |
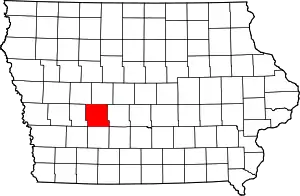 Location within the U.S. state of Iowa | |
 Iowa's location within the U.S. | |
| Coordinates: 41°41′00″N 94°30′00″W | |
| Country | |
| State | |
| Founded | 1851 |
| Seat | Guthrie Center |
| Largest city | Guthrie Center |
| Area | |
| • Total | 593 sq mi (1,540 km2) |
| • Land | 591 sq mi (1,530 km2) |
| • Water | 2.5 sq mi (6 km2) 0.4% |
| Population (2010) | |
| • Total | 10,954 |
| • Estimate (2018) | 10,720 |
| • Density | 18/sq mi (7.1/km2) |
| Time zone | UTC−6 (Central) |
| • Summer (DST) | UTC−5 (CDT) |
| Congressional district | 3rd |
| Website | www |
Guthrie County is one of the six counties that make up the Des Moines–West Des Moines, IA Metropolitan Statistical Area.[4]
Geography
According to the U.S. Census Bureau, the county has a total area of 593 square miles (1,540 km2), of which 591 square miles (1,530 km2) is land and 2.5 square miles (6.5 km2) (0.4%) is water.[5]
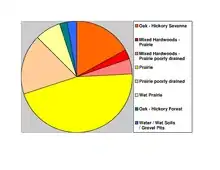
Example of native vegetation: https://commons.wikimedia.org/wiki/File:Whiterock_Conservancy_Neighborhood_New_Wiki_Version.JPG
Major highways
Adjacent counties
- Greene County (north)
- Dallas County (east)
- Adair County (south)
- Audubon County (west)
- Carroll County (northwest)
Demographics
| Historical population | |||
|---|---|---|---|
| Census | Pop. | %± | |
| 1860 | 3,058 | — | |
| 1870 | 7,061 | 130.9% | |
| 1880 | 14,394 | 103.9% | |
| 1890 | 17,380 | 20.7% | |
| 1900 | 18,729 | 7.8% | |
| 1910 | 17,374 | −7.2% | |
| 1920 | 17,596 | 1.3% | |
| 1930 | 17,324 | −1.5% | |
| 1940 | 17,210 | −0.7% | |
| 1950 | 15,197 | −11.7% | |
| 1960 | 13,607 | −10.5% | |
| 1970 | 12,243 | −10.0% | |
| 1980 | 11,983 | −2.1% | |
| 1990 | 10,935 | −8.7% | |
| 2000 | 11,353 | 3.8% | |
| 2010 | 10,954 | −3.5% | |
| 2018 (est.) | 10,720 | [6] | −2.1% |
| U.S. Decennial Census[7] 1790-1960[8] 1900-1990[9] 1990-2000[10] 2010-2018[1] | |||
2010 census
The 2010 census recorded a population of 10,954 in the county, with a population density of 18.5463/sq mi (7.1608/km2). There were 5,756 housing units, of which 4,544 were occupied.[11]
2000 census
At the 2000 census there were 11,353 people, 4,641 households, and 3,248 families in the county. The population density was 19 people per square mile (7/km2). There were 5,467 housing units at an average density of 9 per square mile (4/km2). The racial makeup of the county was 98.61% White, 0.12% Black or African American, 0.05% Native American, 0.14% Asian, 0.04% Pacific Islander, 0.42% from other races, and 0.61% from two or more races. 1.06%.[12] were Hispanic or Latino of any race.
Of the 4,641 households 27.90% had children under the age of 18 living with them, 60.00% were married couples living together, 6.60% had a female householder with no husband present, and 30.00% were non-families. 26.10% of households were one person and 14.10% were one person aged 65 or older. The average household size was 2.39 and the average family size was 2.86.
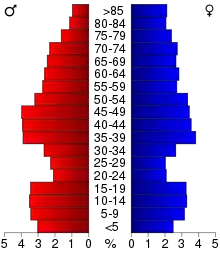
The age distribution was 23.60% under the age of 18, 6.30% from 18 to 24, 24.80% from 25 to 44, 24.90% from 45 to 64, and 20.50% 65 or older. The median age was 42 years. For every 100 females, there were 97.60 males. For every 100 females age 18 and over, there were 94.30 males.
The median household income was $36,495 and the median family income was $43,601. Males had a median income of $31,018 versus $22,077 for females. The per capita income for the county was $19,726. About 5.80% of families and 8.00% of the population were below the poverty line, including 8.90% of those under age 18 and 8.10% of those age 65 or over.
Communities
Townships
Census-designated places
Population ranking
The population ranking of the following table is based on the 2010 census of Guthrie County.[13]
† county seat
| Rank | City/Town/etc. | Municipal type | Population (2010 Census) |
|---|---|---|---|
| 1 | † Guthrie Center | City | 1,569 |
| 2 | Lake Panorama | CDP | 1,309 |
| 3 | Panora | City | 1,124 |
| 4 | Stuart (partially in Adair County) | City | 949 (1,648 total) |
| 5 | Bayard | City | 471 |
| 6 | Casey (partially in Adair County) | City | 416 (426 total) |
| 7 | Diamondhead Lake | CDP | 366 |
| 8 | Menlo | City | 353 |
| 9 | Bagley | City | 303 |
| 10 | Yale | City | 246 |
| 11 | Jamaica | City | 224 |
| 12 | Adair (mostly in Adair County) | City | 19 (781 total) |
| 13 | Coon Rapids (mostly in Carroll County) | City | 0 (1,305 total) |
Politics
| Year | Republican | Democratic | Third Parties |
|---|---|---|---|
| 2016 | 63.1% 3,628 | 30.1% 1,732 | 6.8% 390 |
| 2012 | 53.9% 3,171 | 43.6% 2,569 | 2.5% 148 |
| 2008 | 52.6% 3,074 | 44.9% 2,625 | 2.6% 150 |
| 2004 | 55.5% 3,325 | 43.6% 2,614 | 0.9% 55 |
| 2000 | 51.9% 2,840 | 45.6% 2,493 | 2.5% 136 |
| 1996 | 39.6% 2,034 | 49.7% 2,552 | 10.8% 554 |
| 1992 | 36.0% 1,962 | 41.0% 2,234 | 23.1% 1,257 |
| 1988 | 40.2% 2,005 | 58.4% 2,910 | 1.4% 68 |
| 1984 | 51.9% 2,783 | 46.9% 2,517 | 1.2% 63 |
| 1980 | 58.3% 3,214 | 33.8% 1,866 | 7.9% 434 |
| 1976 | 46.9% 2,644 | 50.9% 2,873 | 2.2% 124 |
| 1972 | 60.7% 3,655 | 37.5% 2,258 | 1.8% 109 |
| 1968 | 58.2% 3,346 | 35.9% 2,063 | 6.0% 342 |
| 1964 | 35.3% 2,169 | 64.5% 3,962 | 0.2% 15 |
| 1960 | 58.2% 4,046 | 41.7% 2,896 | 0.1% 7 |
| 1956 | 58.9% 4,283 | 41.0% 2,981 | 0.1% 6 |
| 1952 | 70.1% 5,377 | 29.7% 2,281 | 0.2% 13 |
| 1948 | 49.2% 3,389 | 49.2% 3,392 | 1.6% 110 |
| 1944 | 57.9% 4,042 | 41.6% 2,899 | 0.5% 36 |
| 1940 | 57.3% 4,733 | 42.3% 3,489 | 0.4% 33 |
| 1936 | 51.5% 4,155 | 44.9% 3,619 | 3.7% 296 |
| 1932 | 45.4% 2,637 | 53.3% 3,099 | 1.3% 76 |
| 1928 | 67.8% 4,772 | 31.8% 2,235 | 0.4% 27 |
| 1924 | 60.1% 4,314 | 11.7% 840 | 28.3% 2,029 |
| 1920 | 75.2% 5,338 | 23.2% 1,647 | 1.6% 114 |
| 1916 | 55.3% 2,316 | 43.1% 1,805 | 1.6% 67 |
| 1912 | 30.7% 1,258 | 33.9% 1,390 | 35.4% 1,449[15] |
| 1908 | 61.4% 2,560 | 36.8% 1,532 | 1.8% 75 |
| 1904 | 70.5% 2,857 | 25.5% 1,032 | 4.0% 161 |
| 1900 | 59.5% 2,806 | 38.7% 1,824 | 1.8% 84 |
| 1896 | 52.7% 2,541 | 46.0% 2,220 | 1.3% 64 |
See also
References
- "State & County QuickFacts". United States Census Bureau. Archived from the original on June 7, 2011. Retrieved July 17, 2014.
- "Find a County". National Association of Counties. Retrieved June 7, 2011.
- Gannett, Henry (1905). The Origin of Certain Place Names in the United States. Govt. Print. Off. pp. 146.
- United States Office of Management and Budget. "Update of Statistical Area Definitions and Guidance on Their Uses" (PDF). pp. 5, 36. Archived from the original (PDF) on May 14, 2006. Retrieved 2006-07-21.
- "US Gazetteer files: 2010, 2000, and 1990". United States Census Bureau. February 12, 2011. Retrieved April 23, 2011.
- "Population and Housing Unit Estimates". Retrieved June 25, 2019.
- "U.S. Decennial Census". United States Census Bureau. Retrieved July 17, 2014.
- "Historical Census Browser". University of Virginia Library. Retrieved July 17, 2014.
- "Population of Counties by Decennial Census: 1900 to 1990". United States Census Bureau. Retrieved July 17, 2014.
- "Census 2000 PHC-T-4. Ranking Tables for Counties: 1990 and 2000" (PDF). United States Census Bureau. Retrieved July 17, 2014.
- "Population & Housing Occupancy Status 2010". United States Census Bureau American FactFinder. Retrieved May 12, 2011.
- "U.S. Census website". United States Census Bureau. Retrieved January 31, 2008.
- https://www.census.gov/2010census/
- Leip, David. "Dave Leip's Atlas of U.S. Presidential Elections". uselectionatlas.org. Retrieved April 26, 2018.
- The leading "other" candidate, Progressive Theodore Roosevelt, received 1,303 votes, while Socialist candidate Eugene Debs received 74 votes, Prohibition candidate Eugene Chafin received 72 votes.
External links
| Wikimedia Commons has media related to Guthrie County, Iowa. |
Places adjacent to Guthrie County, Iowa | ||||||||||
|---|---|---|---|---|---|---|---|---|---|---|
| ||||||||||
Municipalities and communities of Guthrie County, Iowa, United States | ||
|---|---|---|
| Cities | Map of Iowa highlighting Guthrie County | |
| CDPs | ||
| Unincorporated communities | ||
| Ghost town | ||
| Footnotes | ‡This populated place also has portions in an adjacent county or counties | |
| ||

| Authority control |
|---|