Black Hawk County, Iowa
Black Hawk County is a county in the northeastern part of U.S. state of Iowa. As of the 2010 census, the population was 131,090,[1] making it Iowa's fourth-most populous county. The county seat is Waterloo.[2]
Black Hawk County | |
|---|---|
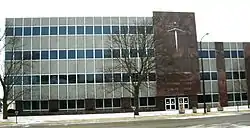 Black Hawk County Courthouse in Waterloo | |
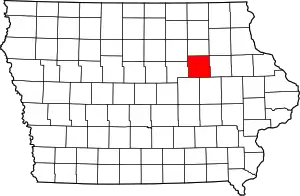 Location within the U.S. state of Iowa | |
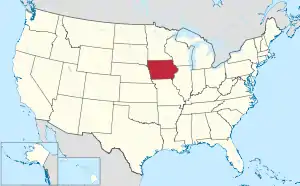 Iowa's location within the U.S. | |
| Coordinates: 42°28′08″N 92°18′19″W | |
| Country | |
| State | |
| Founded | 1843 |
| Named for | Black Hawk |
| Seat | Waterloo |
| Largest city | Waterloo |
| Area | |
| • Total | 573 sq mi (1,480 km2) |
| • Land | 566 sq mi (1,470 km2) |
| • Water | 6.9 sq mi (18 km2) 1.2% |
| Population (2010) | |
| • Total | 131,090 |
| • Estimate (2019) | 131,228 |
| • Density | 230/sq mi (88/km2) |
| Time zone | UTC−6 (Central) |
| • Summer (DST) | UTC−5 (CDT) |
| Congressional district | 1st |
| Website | www |
Black Hawk County is part of the Waterloo-Cedar Falls, IA Metropolitan Statistical Area.[3]
History
Black Hawk County was formed on February 17, 1853 from sections of Buchanan County. It was named after Black Hawk, a Sauk leader during the 1832 Black Hawk War.[4]
Geography
According to the U.S. Census Bureau, the county has an area of 573 square miles (1,480 km2), of which 566 square miles (1,470 km2) is land and 6.9 square miles (18 km2) (1.2%) is water.[5]
The Cedar River roughly divides the county in half from the northwest to the southeast corner. The land is mostly level since much of it is on the river's flood plain.
Major highways
Adjacent counties
- Bremer County (north)
- Buchanan County (east)
- Benton County (southeast)
- Tama County (southwest)
- Grundy County (west)
- Butler County (northwest)
- Fayette County (northeast)
Demographics
| Historical population | |||
|---|---|---|---|
| Census | Pop. | %± | |
| 1850 | 135 | — | |
| 1860 | 8,244 | 6,006.7% | |
| 1870 | 21,706 | 163.3% | |
| 1880 | 23,913 | 10.2% | |
| 1890 | 24,219 | 1.3% | |
| 1900 | 32,399 | 33.8% | |
| 1910 | 44,865 | 38.5% | |
| 1920 | 56,570 | 26.1% | |
| 1930 | 69,146 | 22.2% | |
| 1940 | 79,946 | 15.6% | |
| 1950 | 100,448 | 25.6% | |
| 1960 | 122,482 | 21.9% | |
| 1970 | 132,916 | 8.5% | |
| 1980 | 137,961 | 3.8% | |
| 1990 | 123,798 | −10.3% | |
| 2000 | 128,012 | 3.4% | |
| 2010 | 131,090 | 2.4% | |
| 2019 (est.) | 131,228 | [6] | 0.1% |
| U.S. Decennial Census[7] 1790-1960[8] 1900-1990[9] 1990-2000[10] 2010-2019[1] | |||
2010 census
The 2010 census recorded a population of 131,090 in the county, with a population density of 231.20/sq mi (89.27/km2). There were 55,887 housing units, of which 52,470 were occupied.[11]
2000 census
At the 2000 census there were 128,012 people, 49,683 households, and 31,946 families in the county. The population density was 226 people per square mile (87/km2). There were 51,759 housing units at an average density of 91 per square mile (35/km2). The racial makeup of the county was 88.42% White, 7.95% Black or African American, 0.18% Native American, 0.98% Asian, 0.04% Pacific Islander, 0.93% from other races, and 1.49% from two or more races. 1.84%.[12] were Hispanic or Latino of any race.
Of the 49,683 households 29.50% had children under the age of 18 living with them, 50.20% were married couples living together, 10.80% had a female householder with no husband present, and 35.70% were non-families. 27.10% of households were one person and 10.90% were one person aged 65 or older. The average household size was 2.45 and the average family size was 2.97.
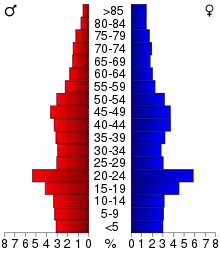
Age spread: 23.10% under the age of 18, 15.70% from 18 to 24, 25.20% from 25 to 44, 22.00% from 45 to 64, and 14.00% 65 or older. The median age was 34 years. For every 100 females, there were 92.30 males. For every 100 females age 18 and over, there were 88.80 males.
The median household income was $37,266 and the median family income was $47,398. Males had a median income of $33,138 versus $23,394 for females. The per capita income for the county was $18,885. About 7.90% of families and 13.10% of the population were below the poverty line, including 14.40% of those under age 18 and 8.90% of those age 65 or over.
Communities
Cities
Census-designated place
Other unincorporated communities
- Blessing
- Dewar
- Eagle Center
- Finchford
- Glasgow
- Voorhies
Townships
Black Hawk County is divided into seventeen townships:
Population ranking
The population ranking of the following table is based on the 2010 census of Black Hawk County.[13]
† county seat
| Rank | City/Town/etc. | Municipal type | Population (2010 Census) |
|---|---|---|---|
| 1 | † Waterloo | City | 68,406 |
| 2 | Cedar Falls | City | 39,260 |
| 3 | Evansdale | City | 4,751 |
| 4 | Jesup (mostly in Buchanan County) | City | 2,520 |
| 5 | La Porte City | City | 2,285 |
| 6 | Hudson | City | 2,282 |
| 7 | Elk Run Heights | City | 1,117 |
| 8 | Janesville (mostly in Bremer County) | City | 930 |
| 9 | Washburn | CDP | 876 |
| 10 | Dunkerton | City | 852 |
| 11 | Raymond | City | 788 |
| 12 | Gilbertville | City | 712 |
Politics
| Year | Republican | Democratic | Third Parties |
|---|---|---|---|
| 2020 | 44.5% 29,640 | 53.5% 35,647 | 2.0% 1,306 |
| 2016 | 42.7% 27,476 | 50.1% 32,233 | 7.3% 4,696 |
| 2012 | 39.1% 26,235 | 59.3% 39,821 | 1.6% 1,085 |
| 2008 | 38.1% 24,662 | 60.5% 39,184 | 1.5% 941 |
| 2004 | 43.9% 28,046 | 55.4% 35,392 | 0.7% 469 |
| 2000 | 42.6% 23,468 | 54.7% 30,112 | 2.7% 1,505 |
| 1996 | 36.4% 19,322 | 55.8% 29,651 | 7.8% 4,136 |
| 1992 | 34.8% 21,398 | 48.1% 29,584 | 17.2% 10,568 |
| 1988 | 42.9% 24,112 | 56.4% 31,657 | 0.7% 402 |
| 1984 | 50.2% 32,262 | 49.0% 31,467 | 0.8% 504 |
| 1980 | 46.5% 29,627 | 43.1% 27,443 | 10.4% 6,652 |
| 1976 | 50.2% 30,994 | 47.8% 29,508 | 2.0% 1,213 |
| 1972 | 57.5% 30,929 | 40.4% 21,721 | 2.1% 1,132 |
| 1968 | 51.7% 25,594 | 42.6% 21,097 | 5.8% 2,863 |
| 1964 | 39.1% 19,744 | 60.8% 30,716 | 0.1% 56 |
| 1960 | 54.1% 28,435 | 45.8% 24,078 | 0.1% 38 |
| 1956 | 58.0% 28,250 | 41.9% 20,403 | 0.1% 66 |
| 1952 | 62.0% 28,671 | 37.6% 17,360 | 0.4% 203 |
| 1948 | 44.3% 16,041 | 54.1% 19,603 | 1.6% 586 |
| 1944 | 48.4% 15,687 | 51.2% 16,593 | 0.5% 154 |
| 1940 | 49.6% 17,132 | 50.1% 17,305 | 0.3% 95 |
| 1936 | 43.1% 13,666 | 53.0% 16,793 | 3.9% 1,222 |
| 1932 | 49.5% 14,746 | 49.3% 14,660 | 1.2% 359 |
| 1928 | 69.4% 19,409 | 30.3% 8,467 | 0.4% 113 |
| 1924 | 65.3% 15,813 | 12.3% 2,981 | 22.4% 5,427 |
| 1920 | 76.6% 16,920 | 18.1% 4,000 | 5.3% 1,181 |
| 1916 | 59.3% 6,742 | 37.6% 4,270 | 3.1% 349 |
| 1912 | 15.0% 1,601 | 34.8% 3,702 | 50.2% 5,346 |
| 1908 | 59.7% 5,437 | 34.3% 3,127 | 6.0% 548 |
| 1904 | 66.9% 5,236 | 23.8% 1,861 | 9.3% 730 |
| 1900 | 64.4% 5,010 | 32.3% 2,512 | 3.3% 259 |
| 1896 | 66.1% 4,643 | 30.8% 2,167 | 3.1% 220 |
| 1892 | 57.1% 3,483 | 41.7% 2,544 | 1.2% 75 |
| 1888 | 58.5% 3,106 | 40.1% 2,127 | 1.4% 76 |
| 1884 | 60.2% 3,153 | 39.8% 2,084 | |
| 1880 | 64.6% 3,014 | 33.4% 1,558 | 2.1% 96 |
See also
- National Register of Historic Places listings in Black Hawk County, Iowa
- Impact of the 2019–20 coronavirus pandemic on the meat industry in the United States
References
- "State & County QuickFacts". United States Census Bureau. Archived from the original on July 7, 2011. Retrieved July 13, 2014.
- "Find a County". National Association of Counties. Archived from the original on May 31, 2011. Retrieved June 7, 2011.
- United States Office of Management and Budget. "Update of Statistical Area Definitions and Guidance on Their Uses" (PDF). pp. 5, 36. Archived from the original (PDF) on 2006-05-14. Retrieved 2006-07-21.
- Black Hawk County Online Archived October 13, 2007, at the Wayback Machine
- "US Gazetteer files: 2010, 2000, and 1990". United States Census Bureau. 2011-02-12. Retrieved 2011-04-23.
- "Population and Housing Unit Estimates". Retrieved May 21, 2020.
- "U.S. Decennial Census". United States Census Bureau. Retrieved July 13, 2014.
- "Historical Census Browser". University of Virginia Library. Retrieved July 13, 2014.
- "Population of Counties by Decennial Census: 1900 to 1990". United States Census Bureau. Retrieved July 13, 2014.
- "Census 2000 PHC-T-4. Ranking Tables for Counties: 1990 and 2000" (PDF). United States Census Bureau. Retrieved July 13, 2014.
- "Population and Housing Occupancy Status: 2010 - State -- County". United States Census Bureau American FactFinder. Archived from the original on September 29, 2015. Retrieved March 6, 2011.
- "U.S. Census website". United States Census Bureau. Retrieved 2008-01-31.
- "2010 Census". Retrieved February 13, 2016.
- Leip, David. "Dave Leip's Atlas of U.S. Presidential Elections". uselectionatlas.org. Retrieved 10 April 2018.
- http://geoelections.free.fr/. Retrieved January 13, 2021. Missing or empty
|title=(help)
External links
| Wikimedia Commons has media related to Black Hawk County, Iowa. |
Places adjacent to Black Hawk County, Iowa | ||||||||||
|---|---|---|---|---|---|---|---|---|---|---|
| ||||||||||
Municipalities and communities of Black Hawk County, Iowa, United States | ||
|---|---|---|
| Cities | Map of Iowa highlighting Black Hawk County | |
| Townships | ||
| CDP | ||
| Other unincorporated communities | ||
| Footnotes | ‡This populated place also has portions in an adjacent county or counties | |
| ||

| Authority control |
|---|
