Van Buren County, Iowa
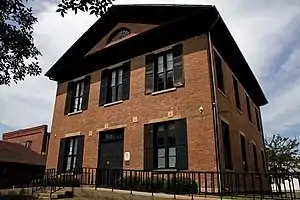
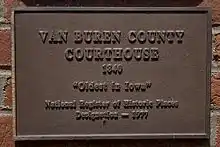
Van Buren County (/væn ˈbjʊərən/ van BEWR-ən) is a county located in the U.S. state of Iowa. As of the 2010 census, the population was 7,570.[1] The county seat is Keosauqua,[2] which contains the oldest continuously operational courthouse in the state of Iowa, and second oldest in the United States.
Van Buren County | |
|---|---|
 | |
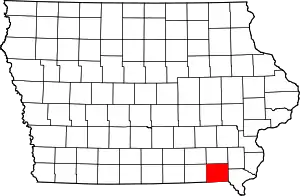 Location within the U.S. state of Iowa | |
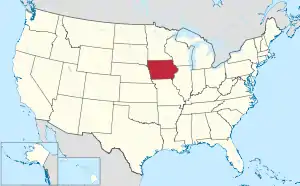 Iowa's location within the U.S. | |
| Coordinates: 40°45′00″N 91°57′06″W | |
| Country | |
| State | |
| Founded | December 7, 1836 |
| Named for | Martin Van Buren |
| Seat | Keosauqua |
| Largest city | Keosauqua |
| Area | |
| • Total | 491 sq mi (1,270 km2) |
| • Land | 485 sq mi (1,260 km2) |
| • Water | 5.7 sq mi (15 km2) 1.2% |
| Population (2010) | |
| • Total | 7,570 |
| • Estimate (2018) | 7,020 |
| • Density | 15/sq mi (6.0/km2) |
| Time zone | UTC−6 (Central) |
| • Summer (DST) | UTC−5 (CDT) |
| Congressional district | 2nd |
| Website | vanburencoia |
History
Van Buren County was formed on December 7, 1836 as a part of Wisconsin Territory, and was split off from Des Moines County. It was named for President Martin Van Buren. It became a part of Iowa Territory (later the state of Iowa) when that territory was organized on July 4, 1838.[3]
The county's courthouse was built in September 1843 in the style of Greek Revival and stands as Iowa's oldest, and the nation's second oldest, courthouse in operation.[4]
"The Honey War" refers to a colorful episode in Van Buren County's history when the State of Missouri and Wisconsin Territory border came into dispute. Missouri attempted to collect taxes from residents north of the disputed Sullivan Line of 1816, which residents said was not rightfully theirs to tax. The sheriff of Van Buren County subsequently arrested and jailed the sheriff from Kahoka, Missouri, and Missourians were charged with "stealing honey from bee trees in what in now Lacey-Keosauqua State Park. Each governor sent troops to resolve the problem but no bloodshed resulted. The matter was turned over to the U.S. Congress for arbitration".[5] The dispute, however, was not resolved until 1846, when Iowa became a state. Congress ruled "in favor of Iowa, allowing the original Sullivan line of 1816 to remain intact".[6]
Van Buren County is also home to Iowa's oldest community theater group still in operation, the "Van Buren Players," founded in 1963.[7]
Geography
According to the U.S. Census Bureau, the county has a total area of 491 square miles (1,270 km2), of which 485 square miles (1,260 km2) is land and 5.7 square miles (15 km2) (1.2%) is water.[8]
Major highways
Adjacent counties
- Jefferson County (north)
- Henry County (northeast)
- Lee County (east)
- Clark County, Missouri (southeast)
- Scotland County, Missouri (southwest)
- Davis County (west)
Demographics
| Historical population | |||
|---|---|---|---|
| Census | Pop. | %± | |
| 1850 | 12,270 | — | |
| 1860 | 17,081 | 39.2% | |
| 1870 | 17,672 | 3.5% | |
| 1880 | 17,043 | −3.6% | |
| 1890 | 16,253 | −4.6% | |
| 1900 | 17,354 | 6.8% | |
| 1910 | 15,020 | −13.4% | |
| 1920 | 14,060 | −6.4% | |
| 1930 | 12,603 | −10.4% | |
| 1940 | 12,053 | −4.4% | |
| 1950 | 11,007 | −8.7% | |
| 1960 | 9,778 | −11.2% | |
| 1970 | 8,643 | −11.6% | |
| 1980 | 8,626 | −0.2% | |
| 1990 | 7,676 | −11.0% | |
| 2000 | 7,809 | 1.7% | |
| 2010 | 7,570 | −3.1% | |
| 2018 (est.) | 7,020 | [9] | −7.3% |
| U.S. Decennial Census[10] 1790-1960[11] 1900-1990[12] 1990-2000[13] 2010-2018[1] | |||
2010 census
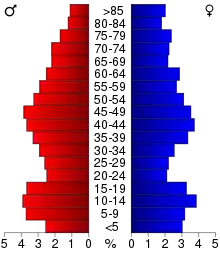
As of the census[14] of 2010, there were 7,570 people, 3,108 households, and 2,058 families residing in the county. The population density was 15.614/sq mi (6.029/km2) people per square mile. There were 3,670 housing units at an average density of 7.570/sq mi (2.923/km2) per square mile. The racial makeup of the county was 98.3% White, 0.2% Black or African American, 0.1% Native American, 0.5% Asian, 0.2% from other races, and 0.7% from two or more races. 1.2% of the population were Hispanic or Latino of any race.
There were 3,108 households, out of which 25.4% had children under the age of 18 living with them, 55.4% were married couples living together, 7.0% had a female householder with no husband present, and 33.8% were non-families. 27.7% of all households were made up of individuals, and 33.6% had someone living alone who was 65 years of age or older. The average household size was 2.40 and the average family size was 2.97.
In the county, the population was spread out, with 24.1% under the age of 18 and 19.8% who were 65 years of age or older. The median age was 43.3 years. For every 100 females there were 100.6 males.
As of the 2000 census, the median income for a household in the county was $31,094, and the median income for a family was $36,420. Males had a median income of $27,379 versus $20,925 for females. The per capita income for the county was $15,748. About 8.70% of families and 12.70% of the population were below the poverty line, including 14.00% of those under age 18 and 15.60% of those age 65 or over.
Communities
Census-designated places
Unincorporated communities
- Iowaville
- Lebanon
- Mt. Zion
- Pittsburg
- Selma
- Winchester
Townships
According to the 1850 US Census Records.
Population ranking
The population ranking of the following table is based on the 2010 census of Van Buren County.[15]
† county seat
| Rank | City/Town/etc. | Municipal type | Population (2010 Census) |
|---|---|---|---|
| 1 | † Keosauqua | City | 1,006 |
| 2 | Farmington | City | 664 |
| 3 | Birmingham | City | 448 |
| 4 | Milton | City | 443 |
| 5 | Bonaparte | City | 433 |
| 6 | Stockport | City | 296 |
| 7 | Cantril | City | 222 |
| 8 | Douds | CDP | 152 |
| 9 | Leando | CDP | 115 |
| 10 | Mount Sterling | CDP | 36 |
Politics
Van Buren County has been predominantly Republican throughout its history, only voting for the Democratic candidate only six times in presidential elections from 1896 onward. However, the county was a national bellwether between 1964 & 2004, but voted Republican by wide margins in years the nation went Republican. Aside from Lyndon B. Johnson's landslide victory in 1964, the margins of victory Democrats won the county by in this 40-year period were incredibly narrow, with the difference being less than one hundred votes when Jimmy Carter & Bill Clinton won the county. From 2000 on, the county has trended strongly Republican, particularly in 2016 where Hillary Clinton received the lowest percentage by a Democratic candidate in 60 years. Clinton also failed to win even 1,000 votes, a feat which every major party candidate prior to 2016 had been able to accomplish in the county.
| Year | Republican | Democratic | Third Parties |
|---|---|---|---|
| 2016 | 71.0% 2,527 | 23.7% 845 | 5.3% 189 |
| 2012 | 57.8% 2,064 | 39.3% 1,402 | 2.9% 103 |
| 2008 | 55.0% 1,986 | 42.8% 1,546 | 2.2% 80 |
| 2004 | 57.6% 2,211 | 40.9% 1,568 | 1.5% 57 |
| 2000 | 56.6% 2,016 | 40.4% 1,440 | 3.0% 105 |
| 1996 | 43.3% 1,460 | 45.5% 1,536 | 11.2% 379 |
| 1992 | 38.2% 1,418 | 39.5% 1,464 | 22.3% 828 |
| 1988 | 50.8% 1,692 | 48.4% 1,612 | 0.9% 30 |
| 1984 | 56.7% 2,138 | 42.6% 1,606 | 0.7% 25 |
| 1980 | 58.2% 2,142 | 35.6% 1,311 | 6.2% 227 |
| 1976 | 49.1% 1,804 | 49.2% 1,807 | 1.6% 60 |
| 1972 | 63.2% 2,272 | 35.3% 1,268 | 1.6% 56 |
| 1968 | 59.3% 2,294 | 34.4% 1,331 | 6.3% 244 |
| 1964 | 39.9% 1,700 | 60.0% 2,555 | 0.1% 2 |
| 1960 | 63.9% 3,129 | 36.0% 1,760 | 0.1% 5 |
| 1956 | 63.8% 3,233 | 36.2% 1,833 | 0.0% 2 |
| 1952 | 70.6% 3,870 | 28.8% 1,577 | 0.6% 33 |
| 1948 | 57.6% 2,702 | 40.9% 1,917 | 1.5% 69 |
| 1944 | 60.4% 3,095 | 39.0% 1,997 | 0.6% 30 |
| 1940 | 62.7% 4,108 | 36.9% 2,416 | 0.4% 26 |
| 1936 | 55.1% 3,535 | 43.7% 2,804 | 1.3% 83 |
| 1932 | 42.6% 2,375 | 56.2% 3,135 | 1.3% 71 |
| 1928 | 66.5% 3,904 | 33.1% 1,944 | 0.5% 27 |
| 1924 | 60.7% 3,623 | 20.3% 1,209 | 19.1% 1,138 |
| 1920 | 71.0% 4,321 | 27.6% 1,682 | 1.4% 83 |
| 1916 | 52.5% 1,994 | 45.7% 1,735 | 1.8% 68 |
| 1912 | 39.4% 1,483 | 39.7% 1,495 | 21.0% 790 |
| 1908 | 53.9% 2,133 | 43.7% 1,730 | 2.5% 97 |
| 1904 | 61.5% 2,469 | 35.3% 1,416 | 3.2% 129 |
| 1900 | 56.4% 2,547 | 41.9% 1,893 | 1.7% 76 |
| 1896 | 53.5% 2,478 | 44.9% 2,076 | 1.6% 74 |
References
- "State & County QuickFacts". United States Census Bureau. Archived from the original on June 7, 2011. Retrieved July 20, 2014.
- "Find a County". National Association of Counties. Retrieved June 7, 2011.
- "WI: Individual County Chronologies". publications.newberry.org. Retrieved 2016-09-28.
- Van Buren County Archived October 20, 2007, at the Wayback Machine
- Van Buren County, Iowa, a Pictorial History. Villages of Van Buren. 2007. p. 46.
- Van Buren County, Iowa, a Pictorial History. Villages of Van Buren. 2007. p. 46.
- Mary Ovrum; editor (1999). The Van Buren Players. The Van Buren Players.CS1 maint: multiple names: authors list (link)
- "US Gazetteer files: 2010, 2000, and 1990". United States Census Bureau. February 12, 2011. Retrieved April 23, 2011.
- "Population and Housing Unit Estimates". Retrieved June 22, 2019.
- "U.S. Decennial Census". United States Census Bureau. Retrieved July 20, 2014.
- "Historical Census Browser". University of Virginia Library. Retrieved July 20, 2014.
- "Population of Counties by Decennial Census: 1900 to 1990". United States Census Bureau. Retrieved July 20, 2014.
- "Census 2000 PHC-T-4. Ranking Tables for Counties: 1990 and 2000" (PDF). United States Census Bureau. Retrieved July 20, 2014.
- "Population & Housing Occupancy Status 2010". United States Census Bureau American FactFinder. Retrieved June 3, 2011.
- https://www.census.gov/2010census/
- Leip, David. "Dave Leip's Atlas of U.S. Presidential Elections". uselectionatlas.org. Retrieved April 28, 2018.
External links
| Wikimedia Commons has media related to Van Buren County, Iowa. |
Places adjacent to Van Buren County, Iowa | ||||||||||
|---|---|---|---|---|---|---|---|---|---|---|
| ||||||||||
Municipalities and communities of Van Buren County, Iowa, United States | ||
|---|---|---|
| Cities | Map of Iowa highlighting Van Buren County | |
| CDPs | ||
| Other unincorporated communities | ||
| Ghost town | ||
| ||
| Authority control |
|---|