Adams County, Iowa
Adams County is a county in the U.S. state of Iowa. As of the 2010 census, the population was 4,029, making it Iowa's least-populous county. Its county seat is Corning.[1][2]
Adams County | |
|---|---|
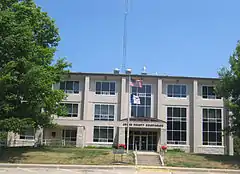 Adams County Courthouse in Corning | |
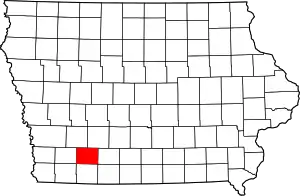 Location within the U.S. state of Iowa | |
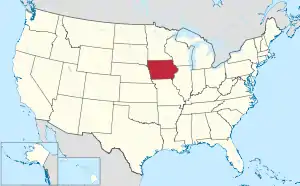 Iowa's location within the U.S. | |
| Coordinates: 41°01′45″N 94°41′57″W | |
| Country | |
| State | |
| Founded | March 12, 1853 |
| Named for | John Adams |
| Seat | Corning |
| Largest city | Corning |
| Area | |
| • Total | 426 sq mi (1,100 km2) |
| • Land | 423 sq mi (1,100 km2) |
| • Water | 2.1 sq mi (5 km2) 0.5% |
| Population (2010) | |
| • Total | 4,029 |
| • Estimate (2018) | 3,645 |
| • Density | 9.5/sq mi (3.7/km2) |
| Time zone | UTC−6 (Central) |
| • Summer (DST) | UTC−5 (CDT) |
| Congressional district | 3rd |
| Website | www |
History
Adams County was established by the state legislature in 1851 and named in honor of the second President of the United States, John Adams, or his son, the sixth President, John Quincy Adams (sources differ). The county was finally organized and separated from Pottawattamie County on March 12, 1853. Its original size was later reduced by the creation of Montgomery and Union counties.
The first county seat was Quincy, Iowa. In 1872, it was moved to Corning.[3]
Geography
According to the U.S. Census Bureau, the county has a total area of 426 square miles (1,100 km2), of which 423 square miles (1,100 km2) is land and 2.1 square miles (5.4 km2) (0.5%) is water.[4]
Major highways
Adjacent counties
- Cass County (northwest)
- Adair County (northeast)
- Union County (east)
- Taylor County (south)
- Montgomery County (west)
Demographics
| Historical population | |||
|---|---|---|---|
| Census | Pop. | %± | |
| 1860 | 1,533 | — | |
| 1870 | 4,614 | 201.0% | |
| 1880 | 11,888 | 157.7% | |
| 1890 | 12,292 | 3.4% | |
| 1900 | 13,601 | 10.6% | |
| 1910 | 10,998 | −19.1% | |
| 1920 | 10,521 | −4.3% | |
| 1930 | 10,437 | −0.8% | |
| 1940 | 10,156 | −2.7% | |
| 1950 | 8,753 | −13.8% | |
| 1960 | 7,468 | −14.7% | |
| 1970 | 6,322 | −15.3% | |
| 1980 | 5,731 | −9.3% | |
| 1990 | 4,866 | −15.1% | |
| 2000 | 4,482 | −7.9% | |
| 2010 | 4,029 | −10.1% | |
| 2018 (est.) | 3,645 | [5] | −9.5% |
| U.S. Decennial Census[6] 1790-1960[7] 1900-1990[8] 1990-2000[9] 2010-2018[2] | |||
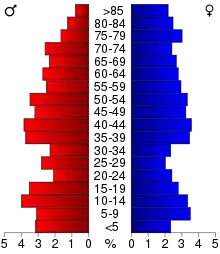
As of the 2010 United States Census, there were 4,029 people, 1,715 households, and 1,126 families residing in the county.[10] The population density was 9.5 inhabitants per square mile (3.7/km2). There were 2,010 housing units at an average density of 4.7 per square mile (1.8/km2).[11] The racial makeup of the county was 98.1% white, 0.6% Asian, 0.5% American Indian, 0.2% black or African American, 0.1% from other races, and 0.5% from two or more races. Those of Hispanic or Latino origin made up 0.9% of the population.[10] In terms of ancestry, 33.6% were German, 15.9% were Irish, 14.7% were English, and 4.9% were American.[12]
Of the 1,715 households, 25.7% had children under the age of 18 living with them, 56.2% were married couples living together, 5.8% had a female householder with no husband present, 34.3% were non-families, and 29.0% of all households were made up of individuals. The average household size was 2.28 and the average family size was 2.81. The median age was 46.7 years.[10]
The median income for a household in the county was $40,368 and the median income for a family was $52,782. Males had a median income of $33,505 versus $25,332 for females. The per capita income for the county was $23,549. About 6.0% of families and 12.2% of the population were below the poverty line, including 8.9% of those under age 18 and 18.5% of those age 65 or over.[13]
Communities
Cities, Towns, Villages and Hamlets
Population ranking
The population ranking of the following table is based on the 2010 census of Adams County.[14]
† county seat
| Rank | City/Town/etc. | Municipal type | Population (2010 Census) |
|---|---|---|---|
| 1 | † Corning | City | 1,635 |
| 2 | Prescott | City | 257 |
| 3 | Nodaway | City | 114 |
| 4 | Carbon | City | 34 |
| 5 | Lenox (mostly in Taylor County) | City | 0 (1,407 total) |
Politics
| Year | Republican | Democratic | Third Parties |
|---|---|---|---|
| 2020 | 70.8% 1,530 | 27.3% 590 | 1.9% 40 |
| 2016 | 66.2% 1,395 | 26.8% 565 | 6.9% 146 |
| 2012 | 50.7% 1,108 | 47.1% 1,028 | 2.2% 49 |
| 2008 | 47.4% 1,046 | 50.7% 1,118 | 1.9% 42 |
| 2004 | 56.7% 1,317 | 42.0% 977 | 1.3% 31 |
| 2000 | 54.6% 1,170 | 41.8% 897 | 3.6% 78 |
| 1996 | 39.6% 920 | 46.0% 1,070 | 14.5% 336 |
| 1992 | 33.2% 863 | 39.8% 1,034 | 26.9% 699 |
| 1988 | 45.4% 1,080 | 53.9% 1,283 | 0.7% 17 |
| 1984 | 57.6% 1,706 | 41.3% 1,221 | 1.1% 33 |
| 1980 | 59.6% 1,779 | 31.5% 940 | 8.9% 265 |
| 1976 | 47.3% 1,388 | 51.3% 1,507 | 1.4% 42 |
| 1972 | 59.6% 1,814 | 38.1% 1,161 | 2.3% 70 |
| 1968 | 59.7% 1,868 | 31.8% 993 | 8.5% 267 |
| 1964 | 40.5% 1,321 | 59.5% 1,941 | 0.0% 1 |
| 1960 | 57.1% 2,185 | 42.9% 1,643 | 0.0% 0 |
| 1956 | 55.9% 2,248 | 43.7% 1,756 | 0.4% 16 |
| 1952 | 69.1% 3,129 | 30.5% 1,383 | 0.4% 19 |
| 1948 | 53.4% 2,142 | 45.3% 1,817 | 1.3% 53 |
| 1944 | 57.6% 2,540 | 42.3% 1,868 | 0.1% 5 |
| 1940 | 60.1% 3,182 | 39.5% 2,088 | 0.4% 22 |
| 1936 | 56.1% 2,953 | 42.7% 2,249 | 1.3% 66 |
| 1932 | 45.6% 1,795 | 53.2% 2,097 | 1.2% 47 |
| 1928 | 66.0% 2,958 | 33.0% 1,479 | 0.9% 42 |
| 1924 | 54.3% 2,547 | 19.1% 897 | 26.6% 1,248 |
| 1920 | 62.4% 2,845 | 36.7% 1,670 | 0.9% 42 |
| 1916 | 50.2% 1,401 | 48.9% 1,365 | 0.9% 25 |
| 1912 | 32.8% 913 | 43.7% 1,215 | 23.5% 655 |
| 1908 | 53.0% 1,595 | 44.1% 1,325 | 2.9% 88 |
| 1904 | 58.9% 1,761 | 33.6% 1,003 | 7.5% 225 |
| 1900 | 55.2% 1,873 | 42.1% 1,428 | 2.7% 91 |
| 1896 | 49.8% 1,736 | 48.8% 1,701 | 1.5% 51 |
References
- "Find a County". National Association of Counties. Archived from the original on May 31, 2011. Retrieved June 7, 2011.
- "State & County QuickFacts". United States Census Bureau. Archived from the original on June 7, 2011. Retrieved July 13, 2014.
- Adams County
- "US Gazetteer files: 2010, 2000, and 1990". United States Census Bureau. 2011-02-12. Retrieved 2011-04-23.
- "Population and Housing Unit Estimates". Retrieved June 10, 2019.
- "U.S. Decennial Census". United States Census Bureau. Retrieved July 13, 2014.
- "Historical Census Browser". University of Virginia Library. Retrieved July 13, 2014.
- "Population of Counties by Decennial Census: 1900 to 1990". United States Census Bureau. Retrieved July 13, 2014.
- "Census 2000 PHC-T-4. Ranking Tables for Counties: 1990 and 2000" (PDF). United States Census Bureau. Retrieved July 13, 2014.
- "DP-1 Profile of General Population and Housing Characteristics: 2010 Demographic Profile Data". United States Census Bureau. Archived from the original on February 13, 2020. Retrieved July 13, 2015.
- "Population, Housing Units, Area, and Density: 2010 - County". United States Census Bureau. Archived from the original on February 13, 2020. Retrieved July 13, 2015.
- "DP02 SELECTED SOCIAL CHARACTERISTICS IN THE UNITED STATES – 2006-2010 American Community Survey 5-Year Estimates". United States Census Bureau. Archived from the original on February 13, 2020. Retrieved July 13, 2015.
- "DP03 SELECTED ECONOMIC CHARACTERISTICS – 2006-2010 American Community Survey 5-Year Estimates". United States Census Bureau. Archived from the original on February 13, 2020. Retrieved July 13, 2015.
- https://www.census.gov/2010census/
- Leip, David. "Dave Leip's Atlas of U.S. Presidential Elections". uselectionatlas.org. Retrieved April 25, 2018.
External links
| Wikimedia Commons has media related to Adams County, Iowa. |
Places adjacent to Adams County, Iowa | ||||||||||
|---|---|---|---|---|---|---|---|---|---|---|
| ||||||||||
Municipalities and communities of Adams County, Iowa, United States | ||
|---|---|---|
| Cities | Map of Iowa highlighting Adams County | |
| Townships | ||
| Unincorporated communities | ||
| Ghost town | ||
| Footnotes | ‡This populated place also has portions in an adjacent county or counties | |
| ||

| Authority control |
|---|